| Param | Original file | Final file |
|---|---|---|
| Filename | modeM0/AS1G05_213T01_9000000506_03963cztM0_level2.evt | modeM0/AS1G05_213T01_9000000506_03963cztM0_level2_quad_clean.evt |
| Size (bytes) | 436,953,600 | 79,344,000 |
| Size | 416.7 MB | 75.7 MB |
| Events in quadrant A | 3,548,790 | 496,210 |
| Events in quadrant B | 3,360,298 | 499,738 |
| Events in quadrant C | 2,709,843 | 492,490 |
| Events in quadrant D | 3,185,128 | 473,732 |
| Mode SS | |||
|---|---|---|---|
| Quadrant | BADHDUFLAG | Total packets | Discarded packets |
| A | 0 | 128 | 0 |
| B | 0 | 128 | 0 |
| C | 0 | 128 | 0 |
| D | 0 | 128 | 0 |
| Mode M0 | |||
|---|---|---|---|
| Quadrant | BADHDUFLAG | Total packets | Discarded packets |
| A | 0 | 14814 | 3 |
| B | 0 | 14255 | 2 |
| C | 0 | 12731 | 2 |
| D | 0 | 14073 | 2 |
| Mode M9 | |||
|---|---|---|---|
| Quadrant | BADHDUFLAG | Total packets | Discarded packets |
| A | 0 | 14 | 0 |
| B | 0 | 14 | 0 |
| C | 0 | 14 | 0 |
| D | 0 | 15 | 0 |
| Quadrant | Total seconds | Saturated seconds | Saturation percentage |
|---|---|---|---|
| A | 6310 | 210 | 3.328051% |
| B | 6310 | 21 | 0.332805% |
| C | 6310 | 4 | 0.063391% |
| D | 6310 | 66 | 1.045959% |
Noise dominated data is calculated using 1-second bins in cleaned event files. If a bin has >2000 counts, and if more than 50% of those come from <1% of pixels, then it is considered to be noise-dominated and hence unusable.
| Quadrant | # 1 sec bins | Bins with >0 counts | Bins with >2000 counts | High rate bins dominated by noise | Noise dominated (total time) | Noise dominated (detector-on time) | Marked lightcurve |
|---|---|---|---|---|---|---|---|
| A | 7460 | 6311 | 100 | 100 | 1.34% | 1.58% | 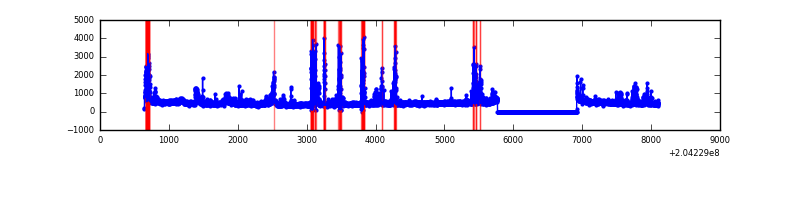 |
| B | 7460 | 6311 | 2 | 2 | 0.03% | 0.03% |  |
| C | 7460 | 6311 | 0 | 0 | 0.00% | 0.00% | 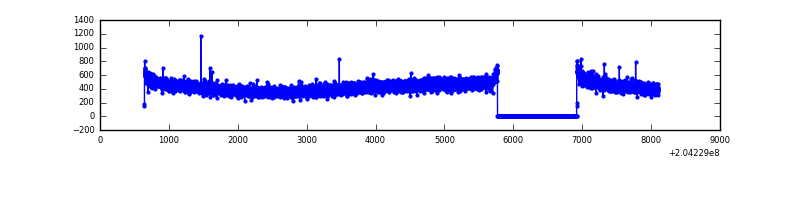 |
| D | 7460 | 6311 | 51 | 51 | 0.68% | 0.81% | 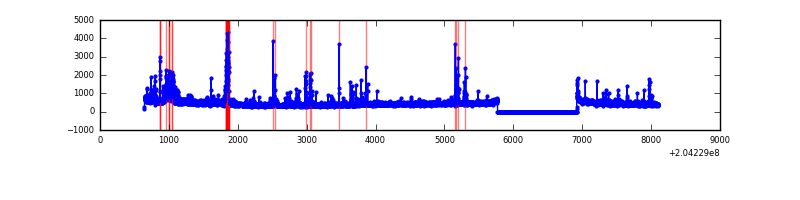 |
Top three noisy pixels from each quadrant. If the there are fewer than three noisy pixels in the level2.evt file, extra rows are filled as -1
| Pixel properties | Quadrant properties | ||||||
|---|---|---|---|---|---|---|---|
| Quadrant | DetID | PixID | Counts | Sigma | Mean | Median | Sigma |
| A | 0 | 118 | 409540 | 2833.16 | 709 | 694 | 144.3 |
| A | 13 | 251 | 208312 | 1438.72 | 709 | 694 | 144.3 |
| A | 4 | 48 | 68997 | 473.32 | 709 | 694 | 144.3 |
| B | 15 | 204 | 264535 | 1876.46 | 734 | 717 | 140.6 |
| B | 3 | 0 | 131297 | 928.78 | 734 | 717 | 140.6 |
| B | 4 | 81 | 54828 | 384.88 | 734 | 717 | 140.6 |
| C | 10 | 65 | 5999 | 32.96 | 691 | 694 | 160.9 |
| C | 13 | 61 | 5934 | 32.56 | 691 | 694 | 160.9 |
| C | 12 | 4 | 3910 | 19.98 | 691 | 694 | 160.9 |
| D | 10 | 246 | 180805 | 1081.03 | 684 | 663 | 166.6 |
| D | 2 | 232 | 133283 | 795.85 | 684 | 663 | 166.6 |
| D | 4 | 95 | 48059 | 284.42 | 684 | 663 | 166.6 |
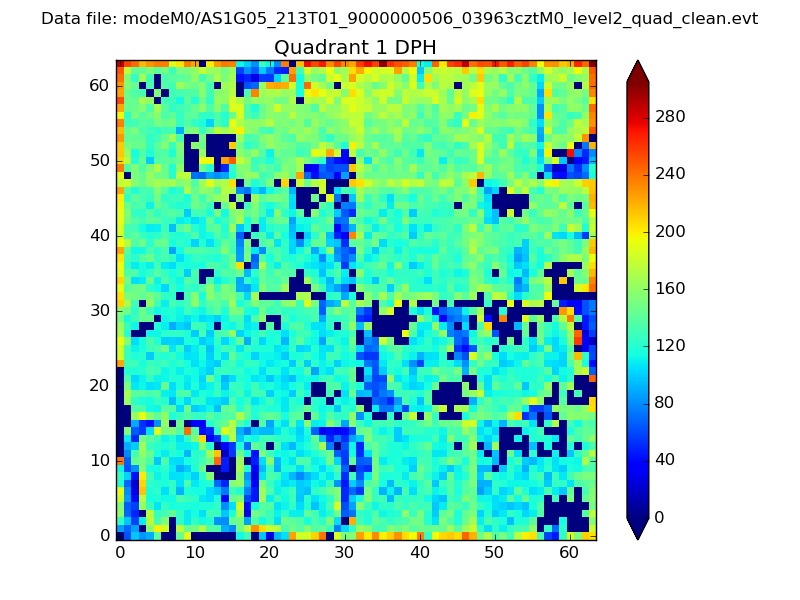
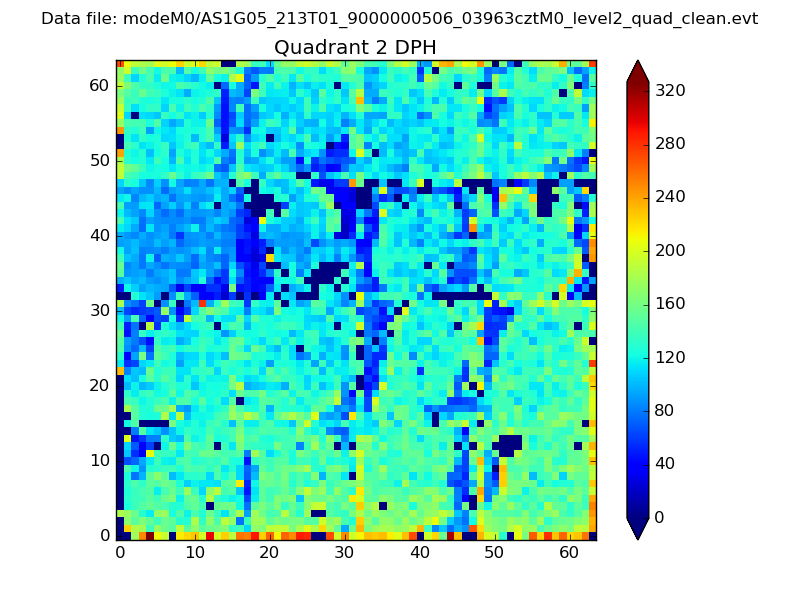
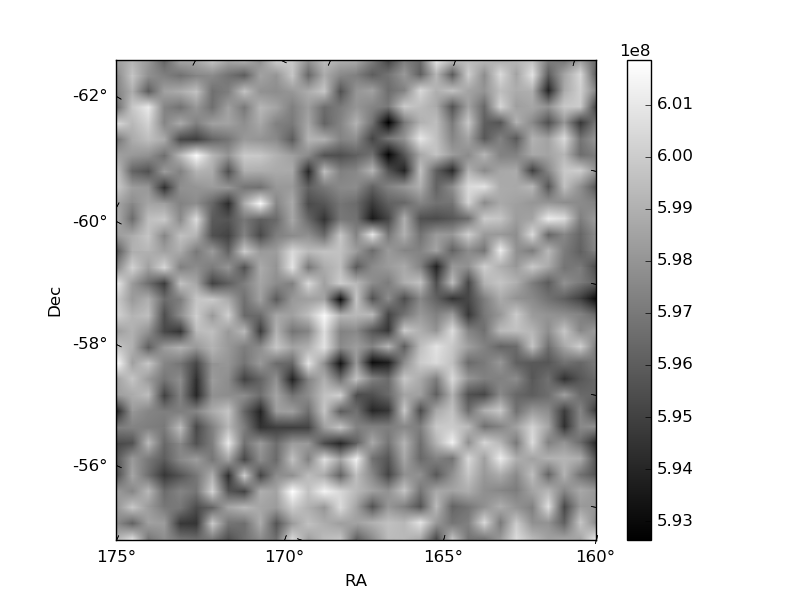
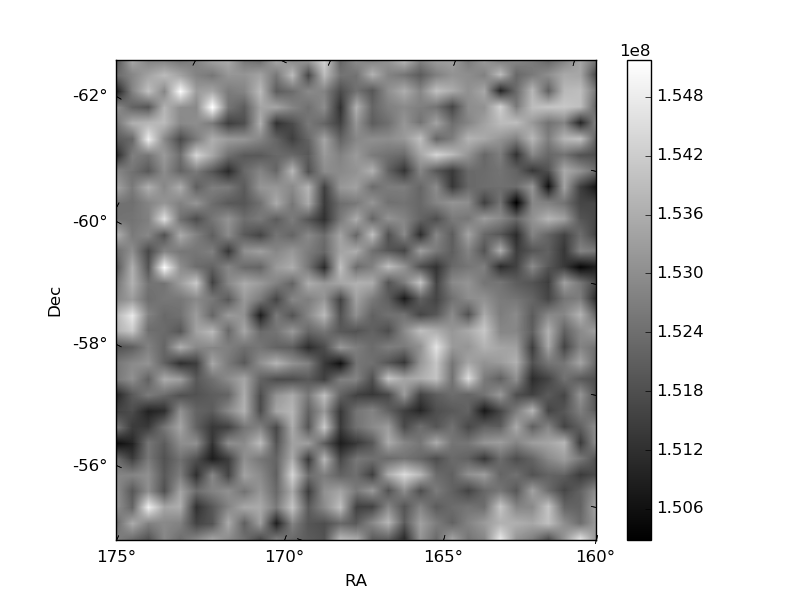
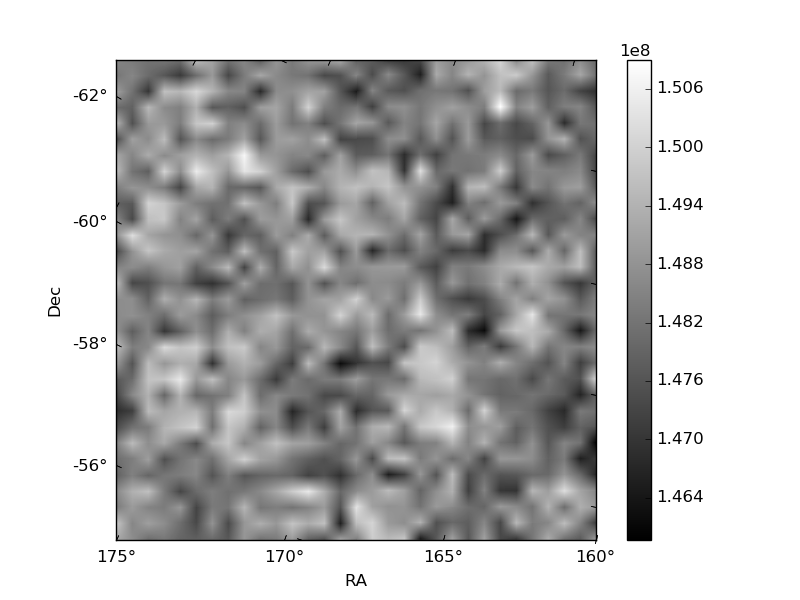
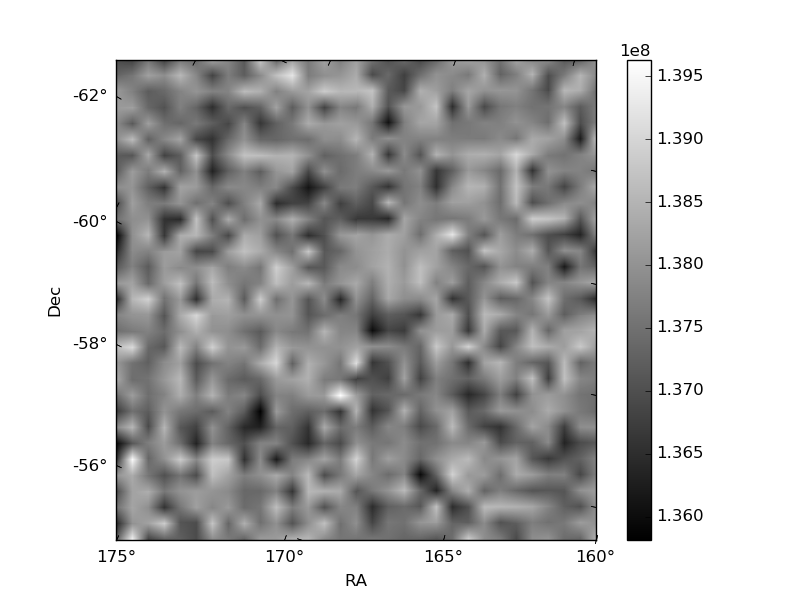
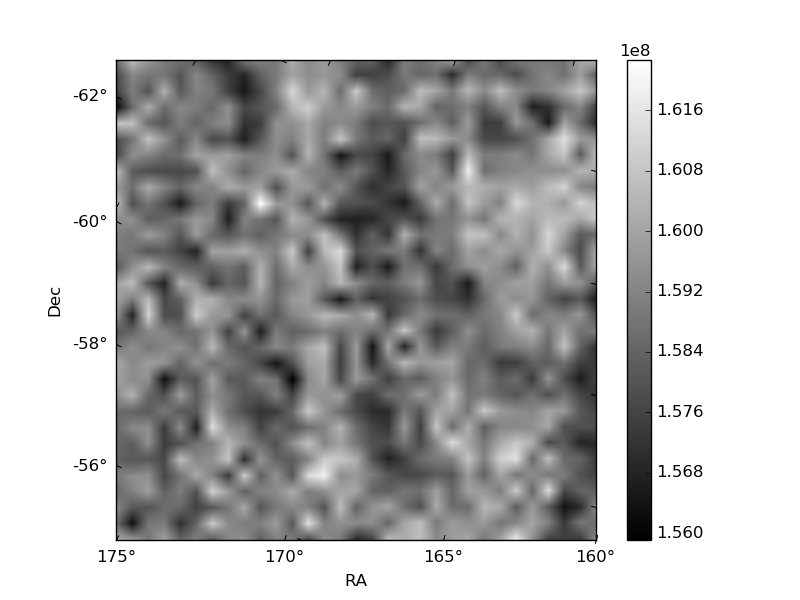
Histogram calculated using DETX and DETY for each event in the final _common_clean file
| Quadrant A | 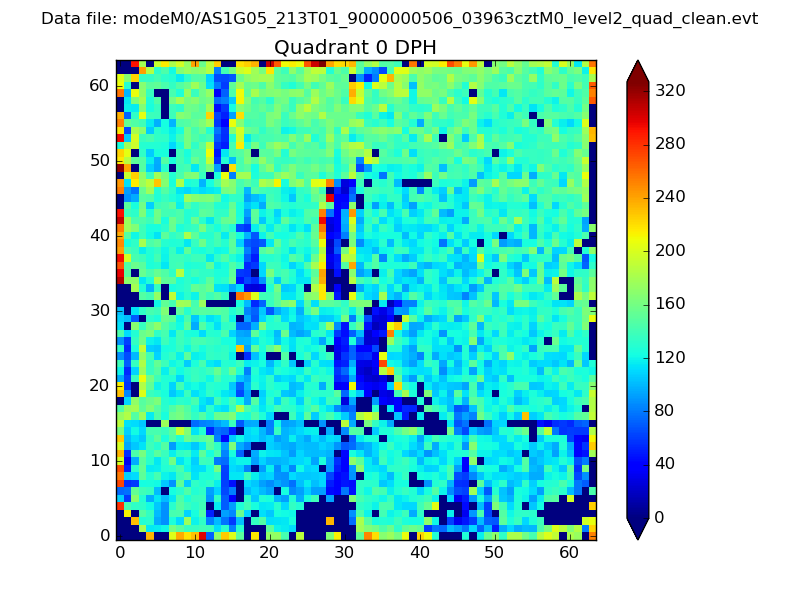 |
 |
Quadrant B |
|---|---|---|---|
| Quadrant D | 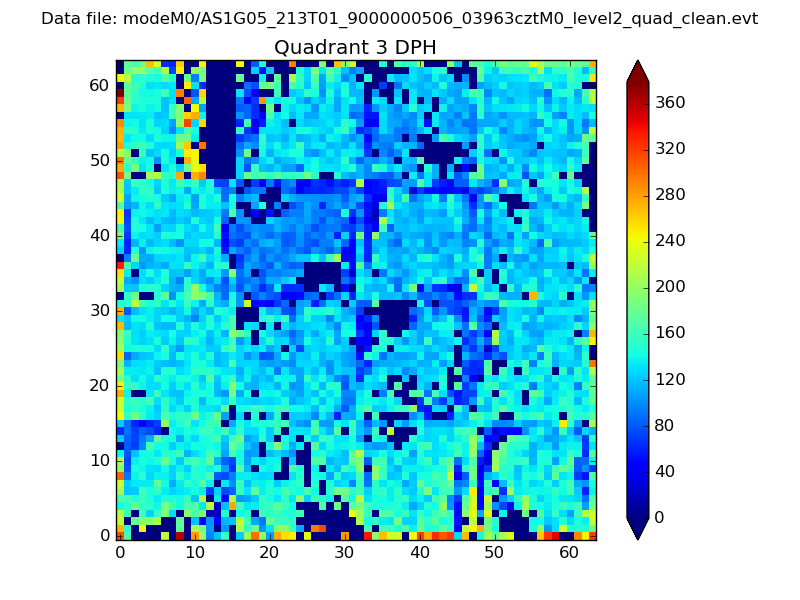 |
 |
Quadrant C |
| Plot type | Count rate plots | Images |
|---|---|---|
| Comparison with Poisson distribution Blue bars denote a histogram of data divided into 1 sec bins. Red curve is a Poisson curve with rate = median count rate of data. |
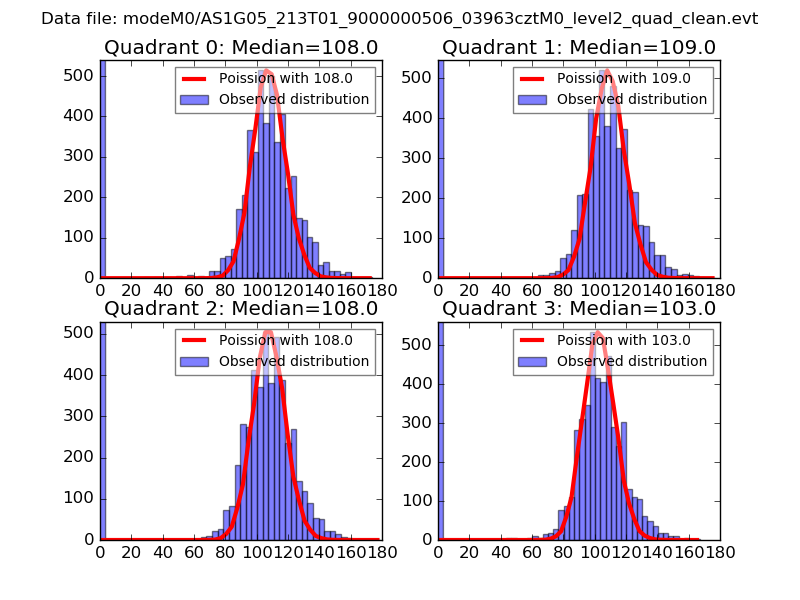 |
 |
| Quadrant-wise count rates Data is divided into 100 sec bins |
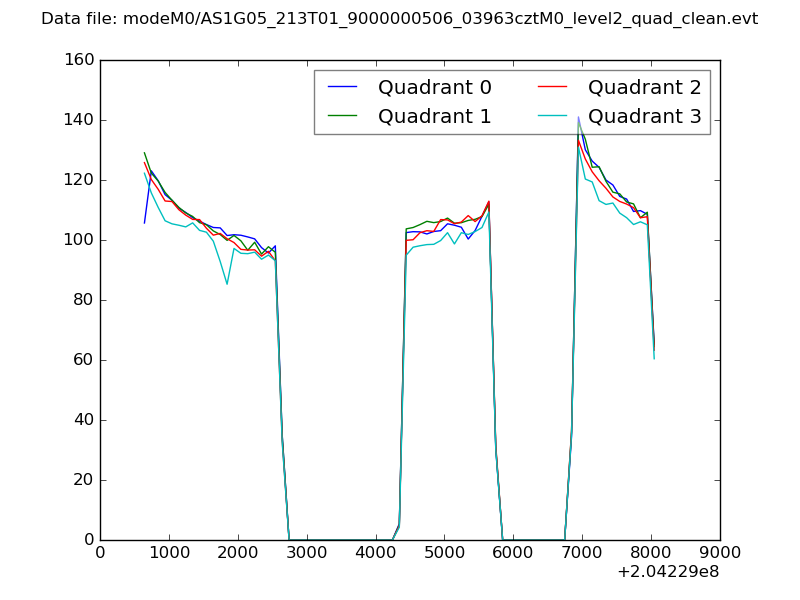 |
|
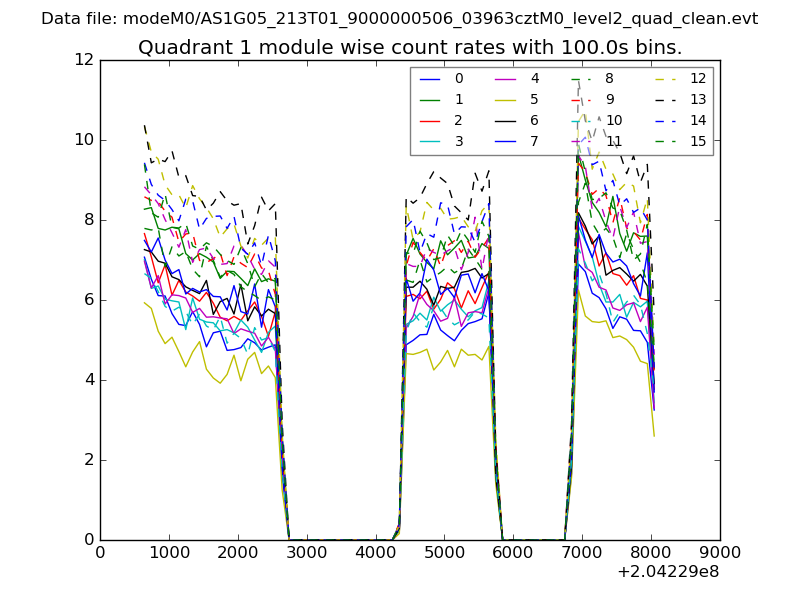
| Module-wise count rates for Quadrant A Data is divided into 100 sec bins |
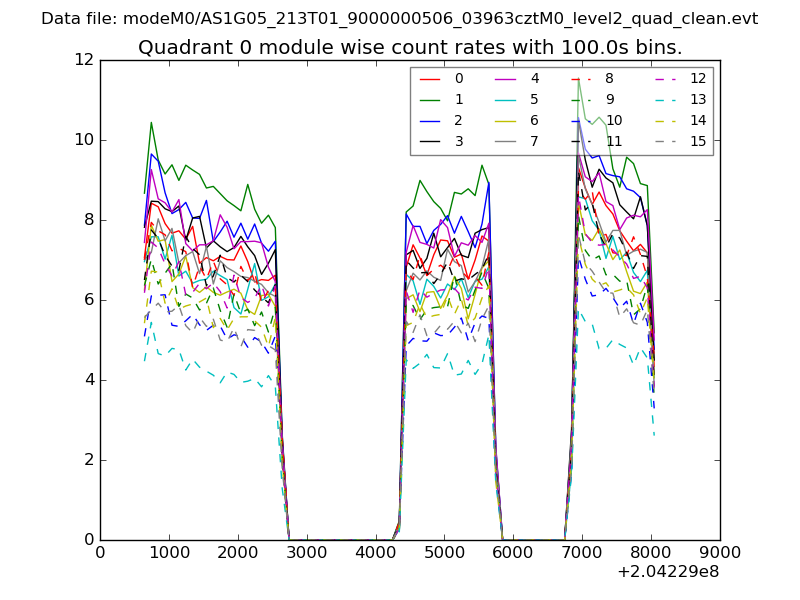 |
 |
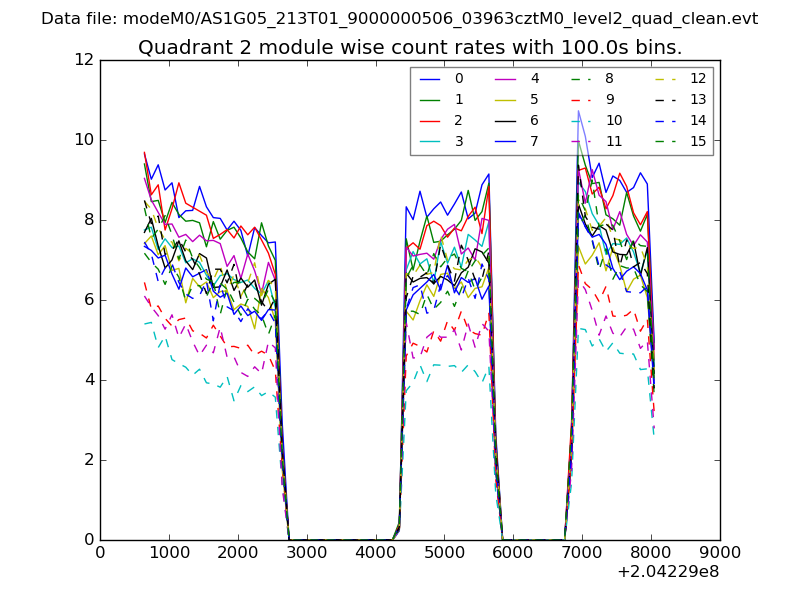
| Module-wise count rates for Quadrant B Data is divided into 100 sec bins |
 |
 |
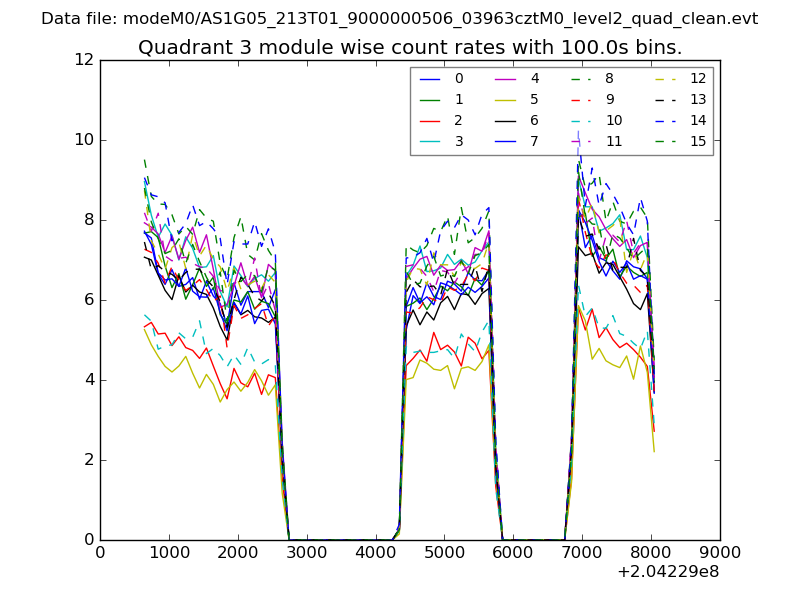
| Module-wise count rates for Quadrant C Data is divided into 100 sec bins |
 |
 |
| Module-wise count rates for Quadrant D Data is divided into 100 sec bins |
 |
 |
| Parameter | Plot |
|---|---|
| CZT HV Monitor | 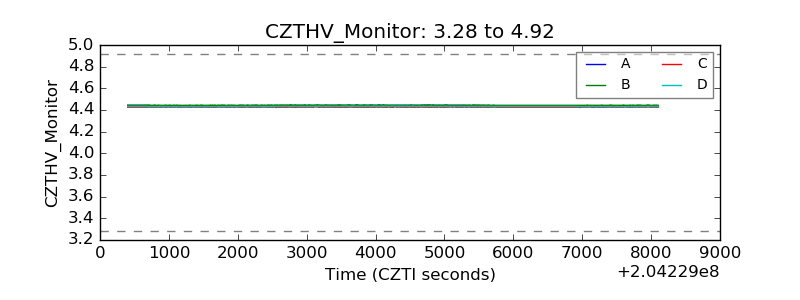 |
| D_VDD |  |
| Temperature 1 | 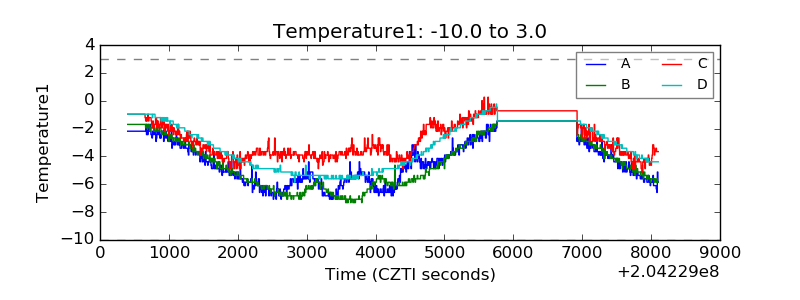 |
| Veto HV Monitor |  |
| Veto LLD | 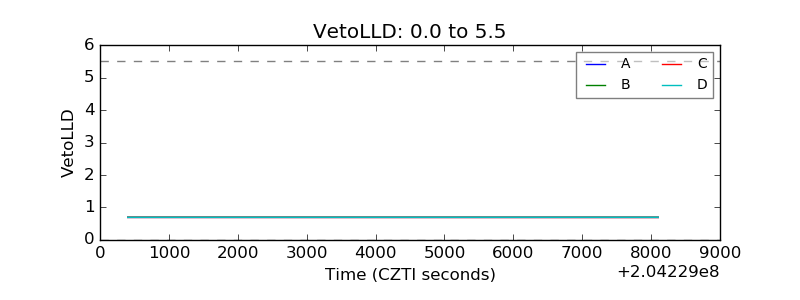 |
| Alpha Counter | 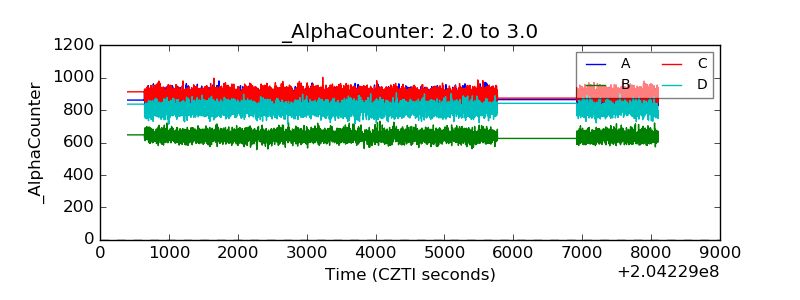 |
| _CPM_Rate | 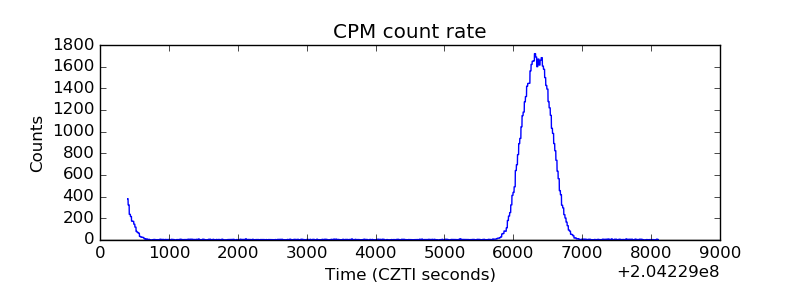 |
| CZT Counter | 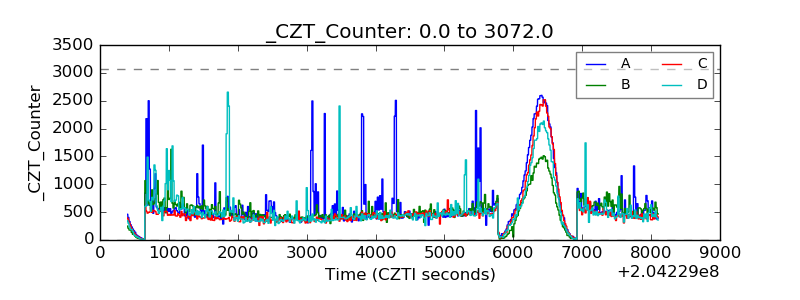 |
| +2.5 Volts monitor |  |
| +5 Volts monitor |  |
| _ROLL_ROT | 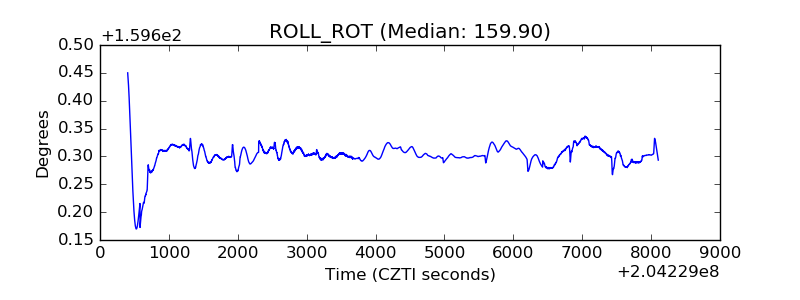 |
| _Roll_DEC | 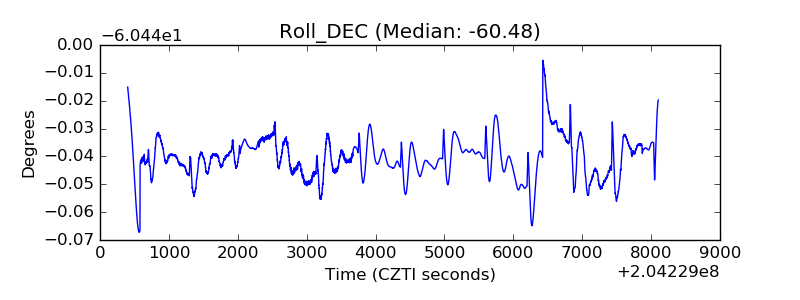 |
| _Roll_RA | 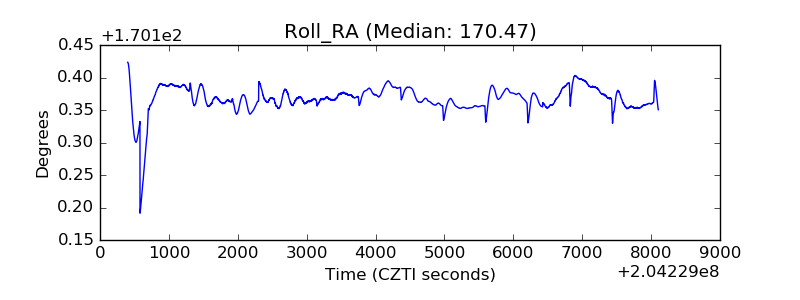 |
| Veto Counter | 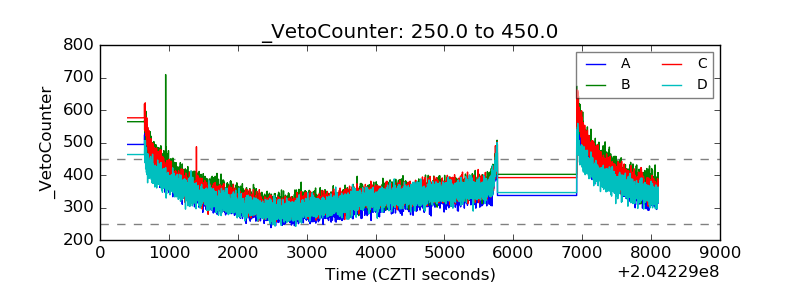 |