| Param | Original file | Final file |
|---|---|---|
| Filename | modeM0/AS1G05_229T02_9000000508cztM0_level2.fits | modeM0/AS1G05_229T02_9000000508cztM0_level2_quad_clean.evt |
| Size (bytes) | 414,728,640 | 407,062,080 |
| Size | 395.5 MB | 388.2 MB |
| Events in quadrant A | 2,490,624 | 2,409,777 |
| Events in quadrant B | 2,417,524 | 2,414,320 |
| Events in quadrant C | 2,464,034 | 2,314,321 |
| Events in quadrant D | 2,099,666 | 2,101,870 |
| Mode M9 | |||
|---|---|---|---|
| Quadrant | BADHDUFLAG | Total packets | Discarded packets |
| A | 0 | 69 | 0 |
| B | 0 | 69 | 0 |
| C | 0 | 69 | 0 |
| D | 0 | 69 | 0 |
| Mode SS | |||
|---|---|---|---|
| Quadrant | BADHDUFLAG | Total packets | Discarded packets |
| A | 0 | 916 | 0 |
| B | 0 | 916 | 0 |
| C | 0 | 916 | 0 |
| D | 0 | 916 | 0 |
| Mode M0 | |||
|---|---|---|---|
| Quadrant | BADHDUFLAG | Total packets | Discarded packets |
| A | 0 | 98359 | 0 |
| B | 0 | 100429 | 0 |
| C | 0 | 93479 | 0 |
| D | 0 | 103849 | 0 |
| Quadrant | Total seconds | Saturated seconds | Saturation percentage |
|---|---|---|---|
| A | 44984 | 1066 | 2.369731% |
| B | 44984 | 996 | 2.214121% |
| C | 44983 | 652 | 1.449436% |
| D | 44984 | 1197 | 2.660946% |
Noise dominated data is calculated using 1-second bins in cleaned event files. If a bin has >2000 counts, and if more than 50% of those come from <1% of pixels, then it is considered to be noise-dominated and hence unusable.
| Quadrant | # 1 sec bins | Bins with >0 counts | Bins with >2000 counts | High rate bins dominated by noise | Noise dominated (total time) | Noise dominated (detector-on time) | Marked lightcurve |
|---|---|---|---|---|---|---|---|
| A | 51820 | 44983 | 0 | 0 | 0.00% | 0.00% |  |
| B | 51820 | 44981 | 0 | 0 | 0.00% | 0.00% |  |
| C | 51820 | 44985 | 0 | 0 | 0.00% | 0.00% |  |
| D | 51820 | 44977 | 0 | 0 | 0.00% | 0.00% |  |
Top three noisy pixels from each quadrant. If the there are fewer than three noisy pixels in the level2.evt file, extra rows are filled as -1
| Pixel properties | Quadrant properties | ||||||
|---|---|---|---|---|---|---|---|
| Quadrant | DetID | PixID | Counts | Sigma | Mean | Median | Sigma |
| A | 0 | 29 | 2500 | 11.2 | 647 | 601 | 169.5 |
| A | 7 | 110 | 2071 | 8.67 | 647 | 601 | 169.5 |
| A | 0 | 30 | 1920 | 7.78 | 647 | 601 | 169.5 |
| B | 2 | 9 | 2119 | 11.79 | 637 | 606 | 128.3 |
| B | 12 | 226 | 1722 | 8.7 | 637 | 606 | 128.3 |
| B | 14 | 254 | 1695 | 8.48 | 637 | 606 | 128.3 |
| C | 1 | 80 | 1723 | 6.41 | 651 | 601 | 175.0 |
| C | 1 | 81 | 1710 | 6.34 | 651 | 601 | 175.0 |
| C | 9 | 242 | 1694 | 6.24 | 651 | 601 | 175.0 |
| D | 11 | 82 | 1767 | 7.58 | 598 | 540 | 161.8 |
| D | 3 | 14 | 1624 | 6.7 | 598 | 540 | 161.8 |
| D | 6 | 231 | 1542 | 6.19 | 598 | 540 | 161.8 |
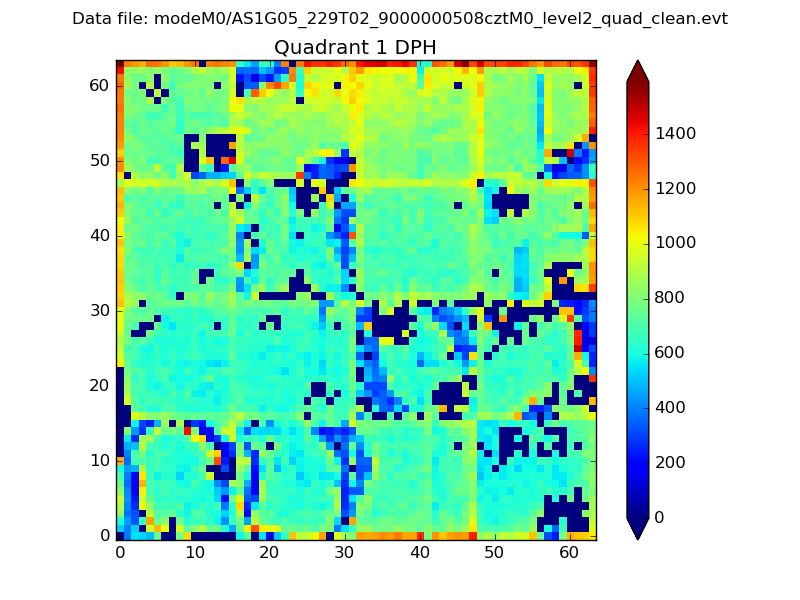
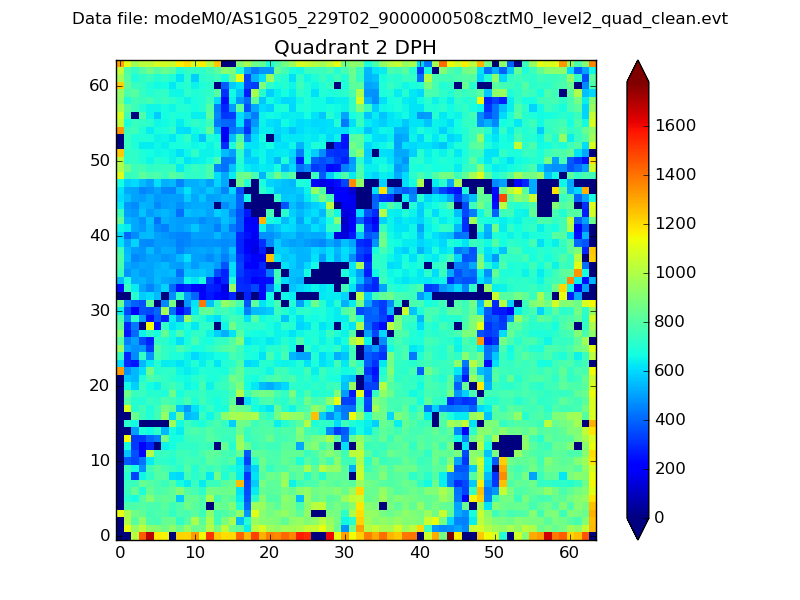
Histogram calculated using DETX and DETY for each event in the final _common_clean file
| Quadrant A |  |
 |
Quadrant B |
|---|---|---|---|
| Quadrant D | 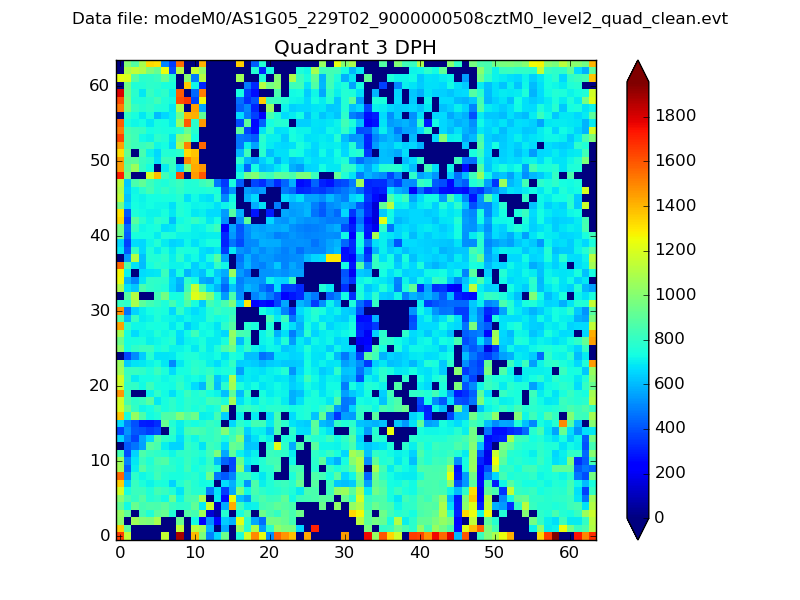 |
 |
Quadrant C |
| Plot type | Count rate plots | Images |
|---|---|---|
| Comparison with Poisson distribution Blue bars denote a histogram of data divided into 1 sec bins. Red curve is a Poisson curve with rate = median count rate of data. |
 |
 |
| Quadrant-wise count rates Data is divided into 100 sec bins |
 |
|
| Module-wise count rates for Quadrant A Data is divided into 100 sec bins |
 |
 |
| Module-wise count rates for Quadrant B Data is divided into 100 sec bins |
 |
 |
| Module-wise count rates for Quadrant C Data is divided into 100 sec bins |
 |
 |
| Module-wise count rates for Quadrant D Data is divided into 100 sec bins |
 |
 |
| Parameter | Plot |
|---|---|
| CZT HV Monitor |  |
| D_VDD |  |
| Temperature 1 |  |
| Veto HV Monitor |  |
| Veto LLD |  |
| Alpha Counter |  |
| _CPM_Rate |  |
| CZT Counter |  |
| +2.5 Volts monitor |  |
| +5 Volts monitor | 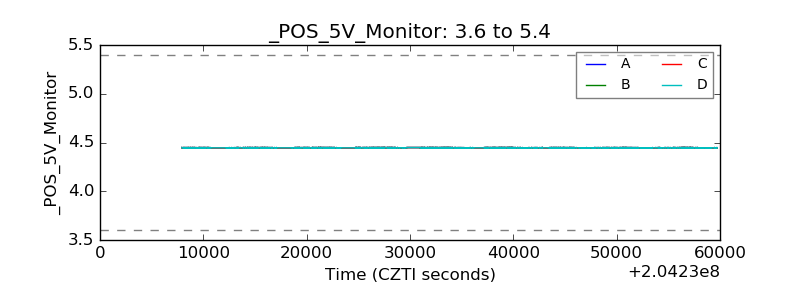 |
| _ROLL_ROT |  |
| _Roll_DEC |  |
| _Roll_RA |  |
| Veto Counter |  |