| Param | Original file | Final file |
|---|---|---|
| Filename | modeM0/AS1G05_229T02_9000000508_03964cztM0_level2.evt | modeM0/AS1G05_229T02_9000000508_03964cztM0_level2_quad_clean.evt |
| Size (bytes) | 339,554,880 | 46,215,360 |
| Size | 323.8 MB | 44.1 MB |
| Events in quadrant A | 2,162,045 | 281,121 |
| Events in quadrant B | 2,420,217 | 281,360 |
| Events in quadrant C | 2,284,148 | 277,440 |
| Events in quadrant D | 3,119,923 | 252,150 |
| Mode M9 | |||
|---|---|---|---|
| Quadrant | BADHDUFLAG | Total packets | Discarded packets |
| A | 0 | 12 | 0 |
| B | 0 | 12 | 0 |
| C | 0 | 12 | 0 |
| D | 0 | 12 | 0 |
| Mode SS | |||
|---|---|---|---|
| Quadrant | BADHDUFLAG | Total packets | Discarded packets |
| A | 0 | 90 | 0 |
| B | 0 | 90 | 0 |
| C | 0 | 90 | 0 |
| D | 0 | 90 | 0 |
| Mode M0 | |||
|---|---|---|---|
| Quadrant | BADHDUFLAG | Total packets | Discarded packets |
| A | 0 | 9226 | 2 |
| B | 0 | 9924 | 1 |
| C | 0 | 9654 | 1 |
| D | 0 | 12233 | 1 |
| Quadrant | Total seconds | Saturated seconds | Saturation percentage |
|---|---|---|---|
| A | 4358 | 24 | 0.550711% |
| B | 4358 | 59 | 1.353832% |
| C | 4358 | 54 | 1.239101% |
| D | 4358 | 286 | 6.562643% |
Noise dominated data is calculated using 1-second bins in cleaned event files. If a bin has >2000 counts, and if more than 50% of those come from <1% of pixels, then it is considered to be noise-dominated and hence unusable.
| Quadrant | # 1 sec bins | Bins with >0 counts | Bins with >2000 counts | High rate bins dominated by noise | Noise dominated (total time) | Noise dominated (detector-on time) | Marked lightcurve |
|---|---|---|---|---|---|---|---|
| A | 5598 | 4359 | 1 | 1 | 0.02% | 0.02% | 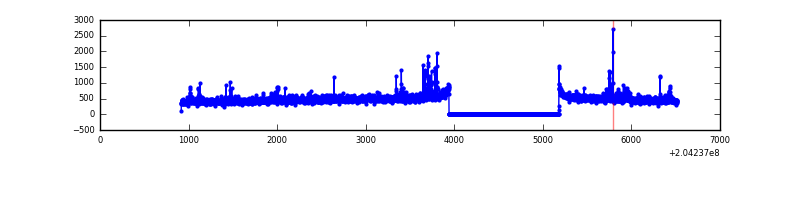 |
| B | 5598 | 4359 | 25 | 25 | 0.45% | 0.57% | 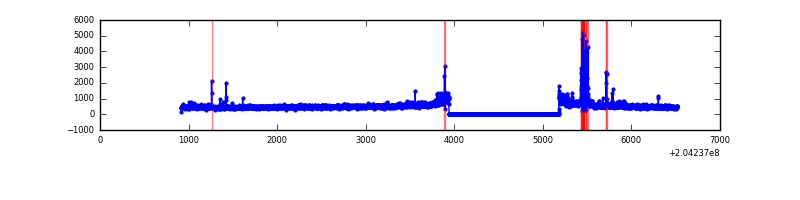 |
| C | 5598 | 4359 | 36 | 36 | 0.64% | 0.83% | 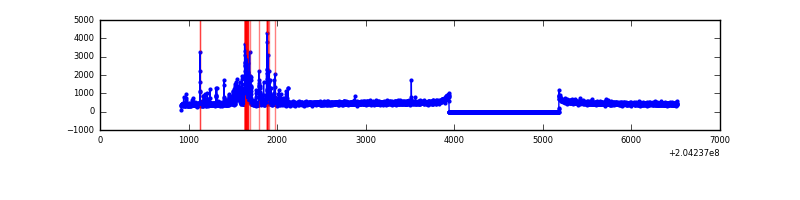 |
| D | 5598 | 4359 | 199 | 199 | 3.55% | 4.57% | 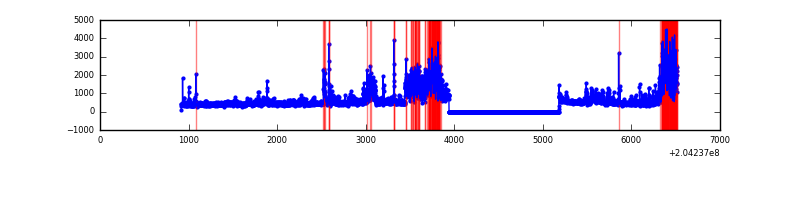 |
Top three noisy pixels from each quadrant. If the there are fewer than three noisy pixels in the level2.evt file, extra rows are filled as -1
| Pixel properties | Quadrant properties | ||||||
|---|---|---|---|---|---|---|---|
| Quadrant | DetID | PixID | Counts | Sigma | Mean | Median | Sigma |
| A | 0 | 118 | 70600 | 649.29 | 526 | 516 | 107.9 |
| A | 4 | 48 | 19206 | 173.15 | 526 | 516 | 107.9 |
| A | 13 | 251 | 16226 | 145.54 | 526 | 516 | 107.9 |
| B | 15 | 204 | 116760 | 1137.04 | 530 | 519 | 102.2 |
| B | 3 | 0 | 87744 | 853.21 | 530 | 519 | 102.2 |
| B | 10 | 16 | 82014 | 797.16 | 530 | 519 | 102.2 |
| C | 14 | 234 | 285698 | 2382.72 | 506 | 510 | 119.7 |
| C | 10 | 65 | 9470 | 74.86 | 506 | 510 | 119.7 |
| C | 9 | 144 | 6322 | 48.56 | 506 | 510 | 119.7 |
| D | 2 | 63 | 585245 | 4827.26 | 490 | 476 | 121.1 |
| D | 2 | 232 | 390517 | 3219.78 | 490 | 476 | 121.1 |
| D | 10 | 246 | 146859 | 1208.39 | 490 | 476 | 121.1 |
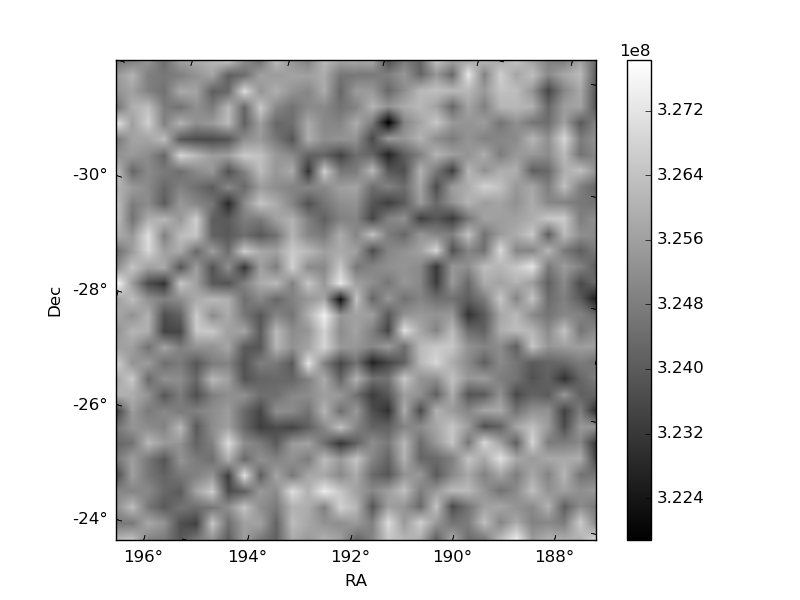
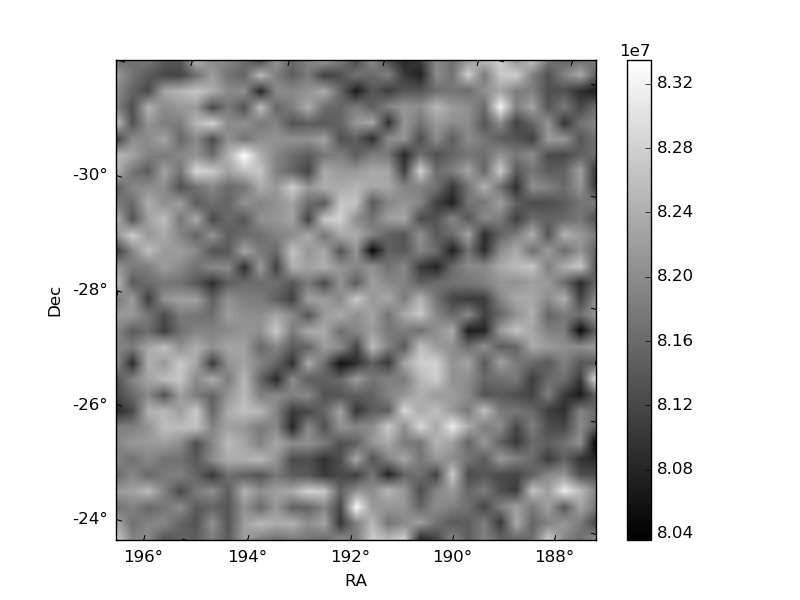
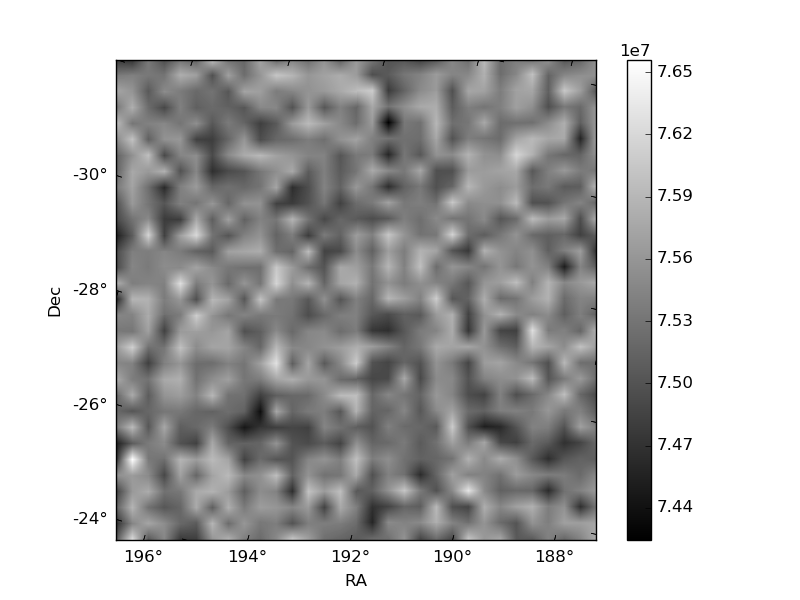
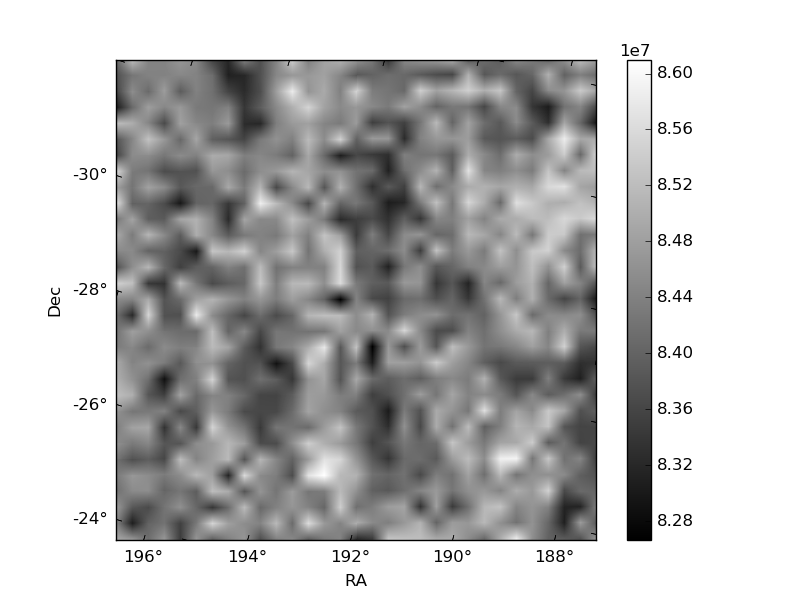
Histogram calculated using DETX and DETY for each event in the final _common_clean file
| Quadrant A | 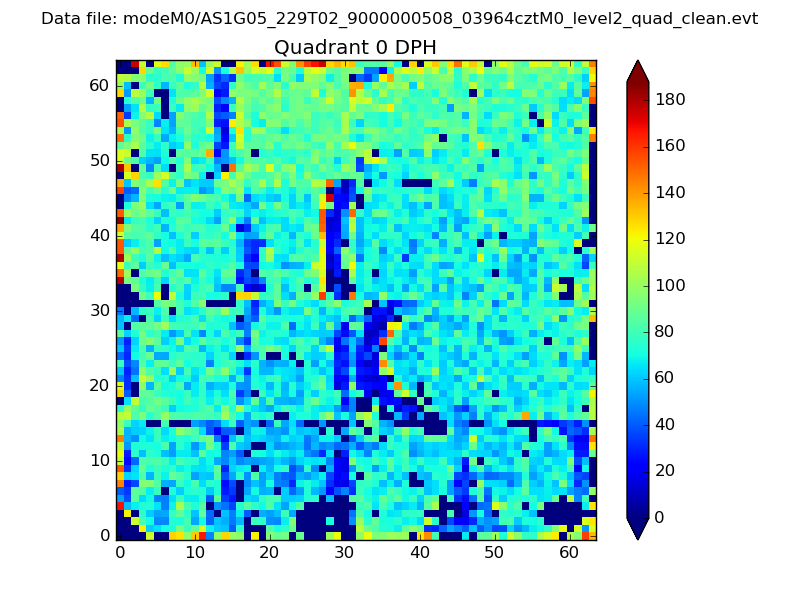 |
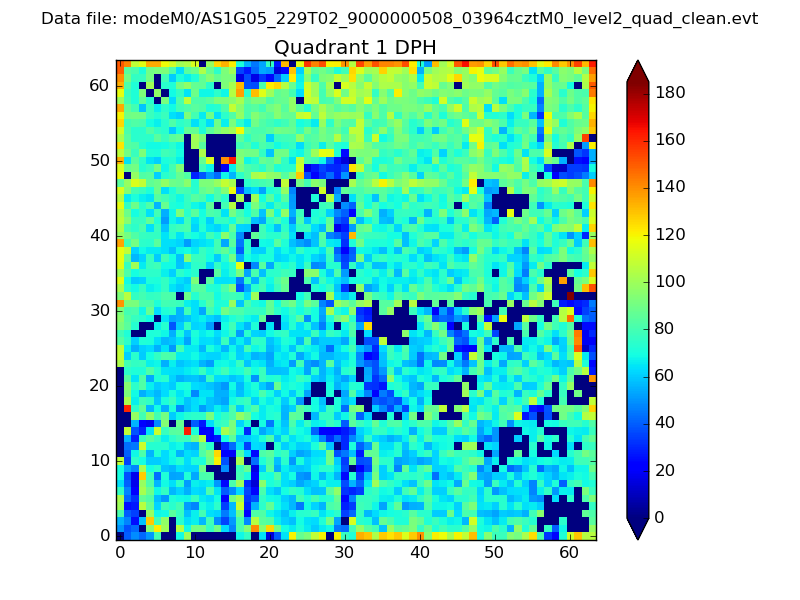 |
Quadrant B |
|---|---|---|---|
| Quadrant D | 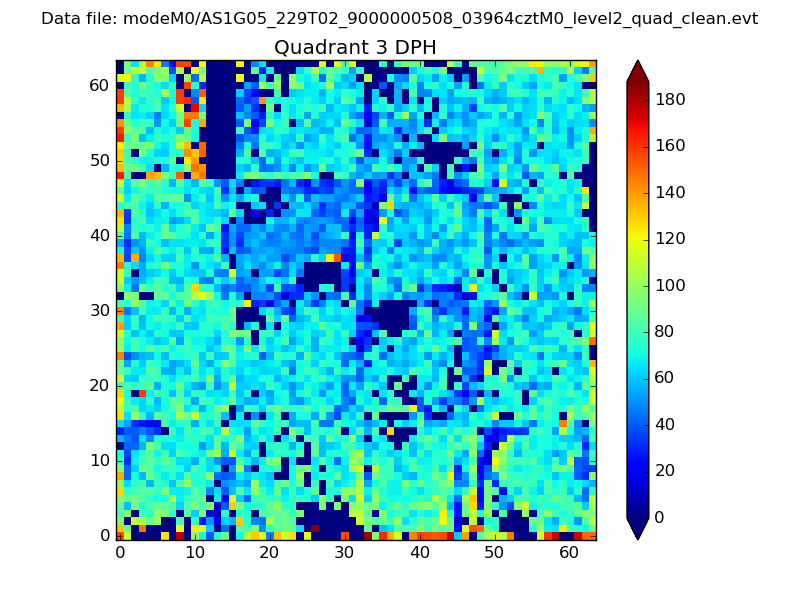 |
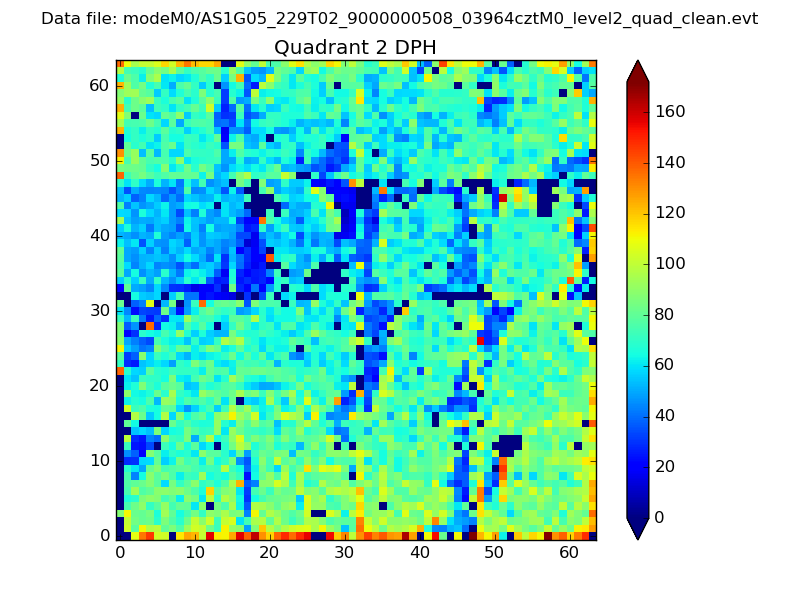 |
Quadrant C |
| Plot type | Count rate plots | Images |
|---|---|---|
| Comparison with Poisson distribution Blue bars denote a histogram of data divided into 1 sec bins. Red curve is a Poisson curve with rate = median count rate of data. |
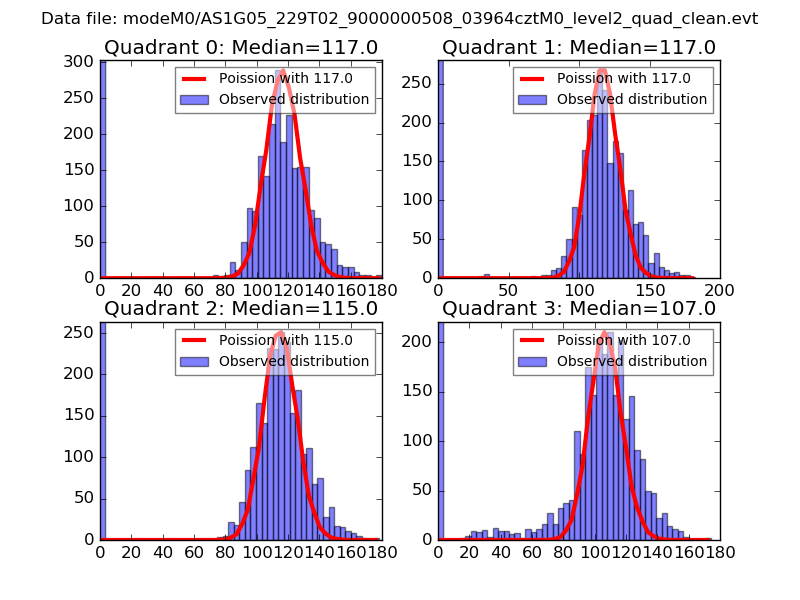 |
 |
| Quadrant-wise count rates Data is divided into 100 sec bins |
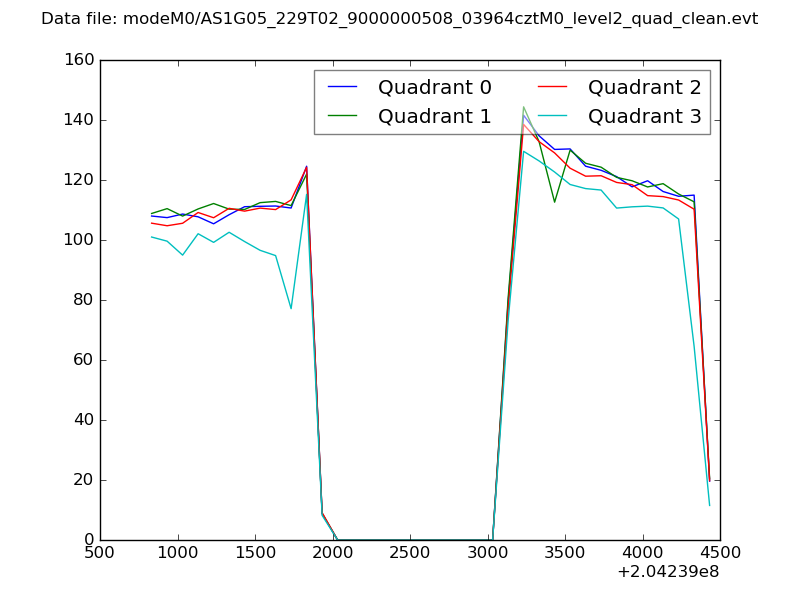 |
|
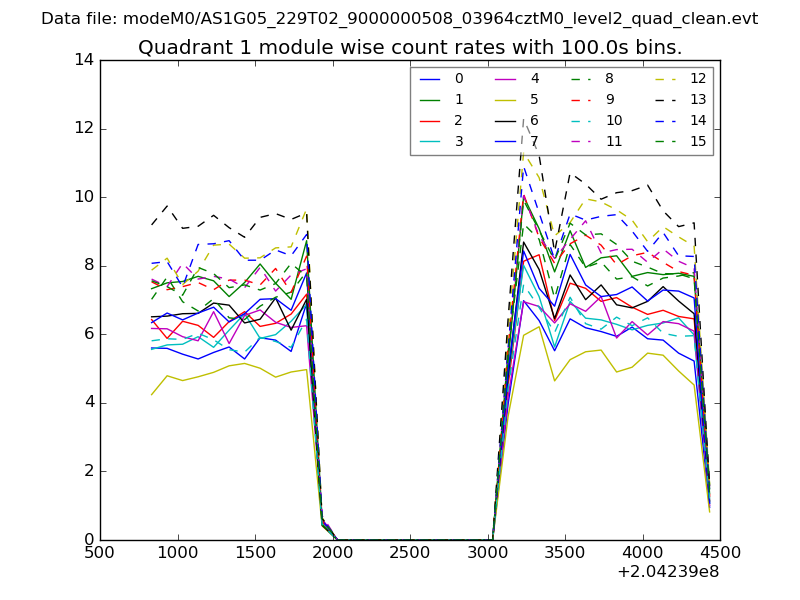
| Module-wise count rates for Quadrant A Data is divided into 100 sec bins |
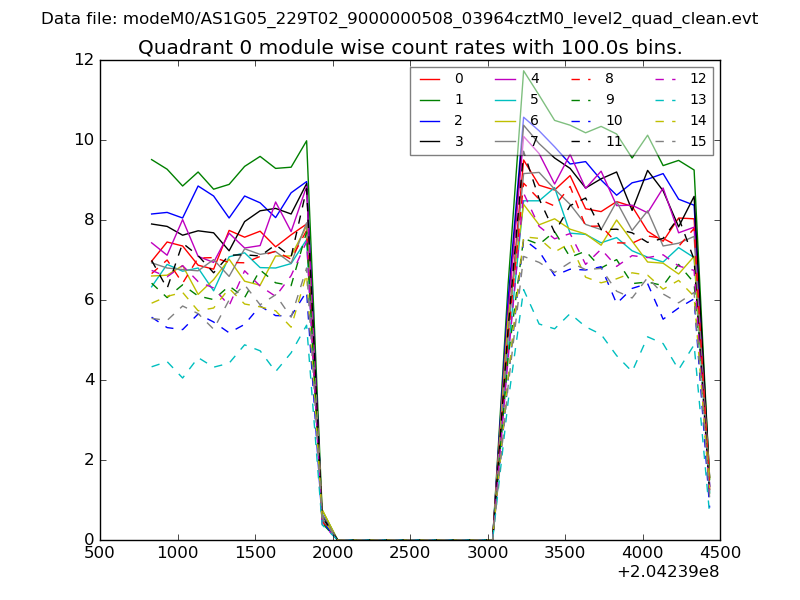 |
 |
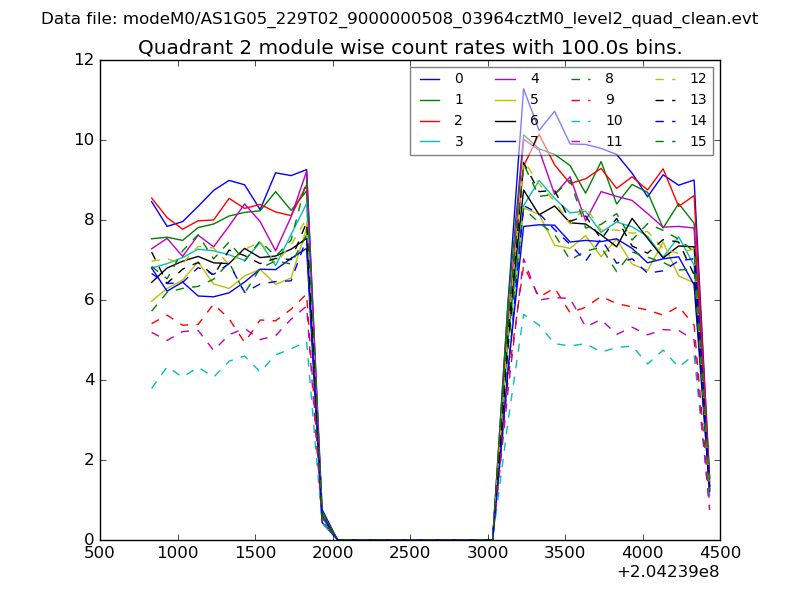
| Module-wise count rates for Quadrant B Data is divided into 100 sec bins |
 |
 |
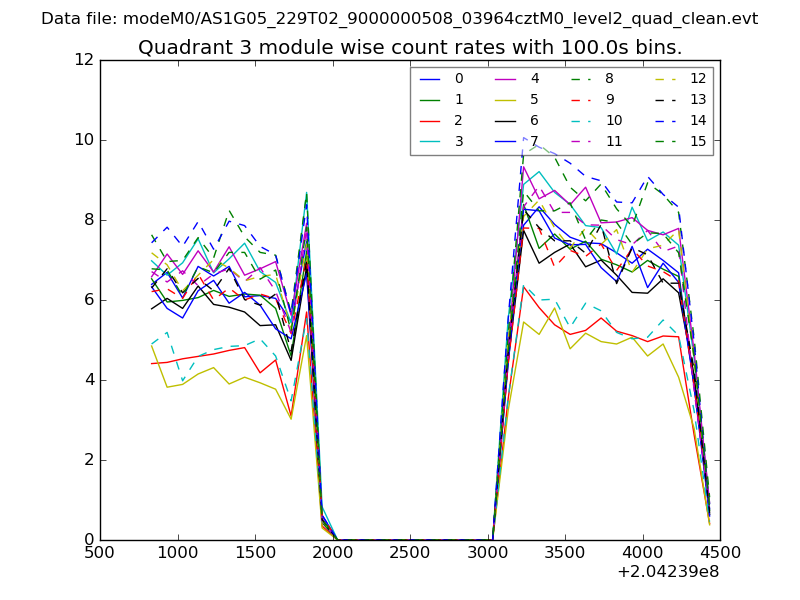
| Module-wise count rates for Quadrant C Data is divided into 100 sec bins |
 |
 |
| Module-wise count rates for Quadrant D Data is divided into 100 sec bins |
 |
 |
| Parameter | Plot |
|---|---|
| CZT HV Monitor | 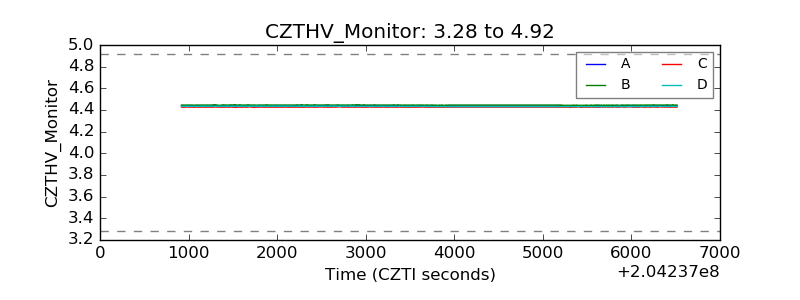 |
| D_VDD |  |
| Temperature 1 | 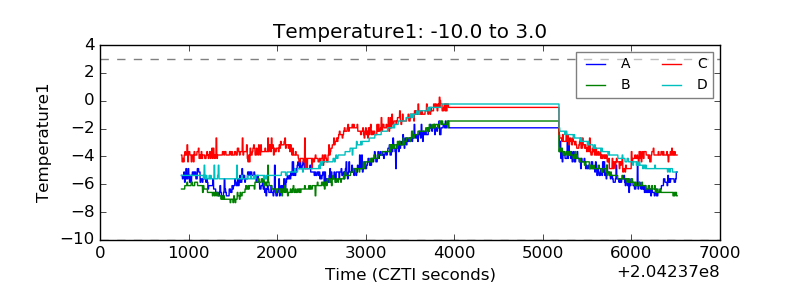 |
| Veto HV Monitor | 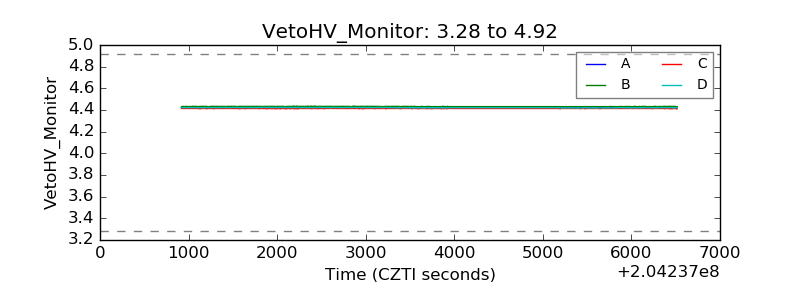 |
| Veto LLD | 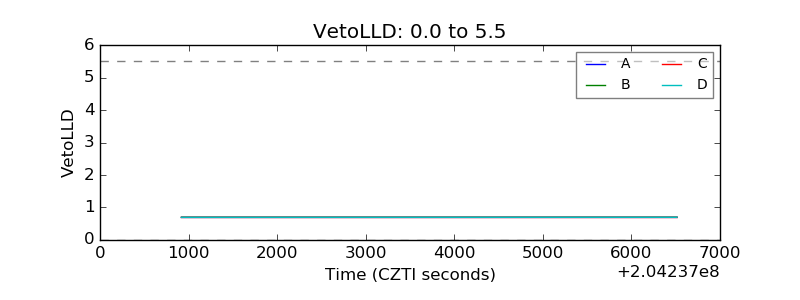 |
| Alpha Counter | 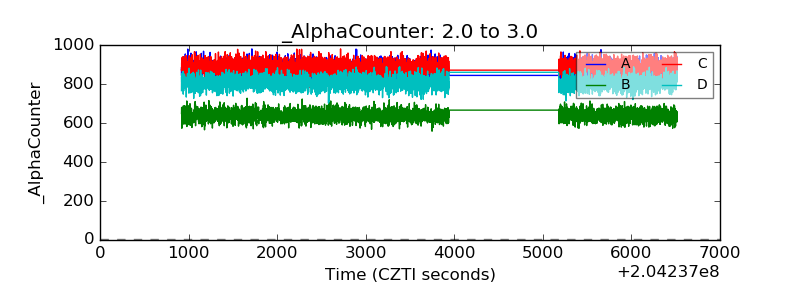 |
| _CPM_Rate | 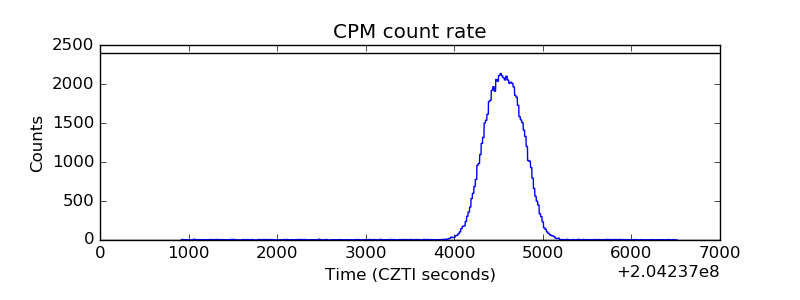 |
| CZT Counter | 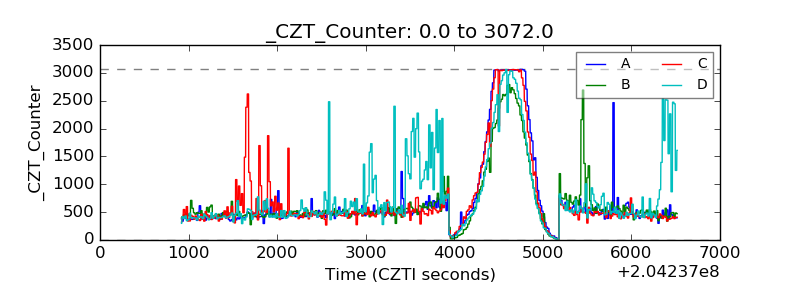 |
| +2.5 Volts monitor |  |
| +5 Volts monitor |  |
| _ROLL_ROT | 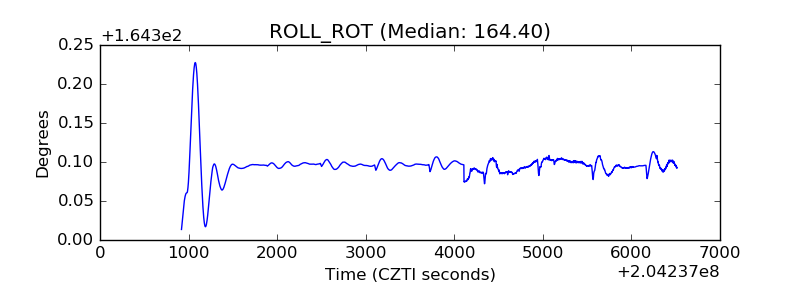 |
| _Roll_DEC | 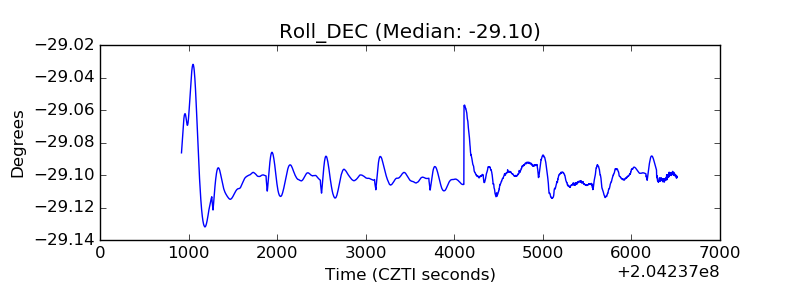 |
| _Roll_RA |  |
| Veto Counter | 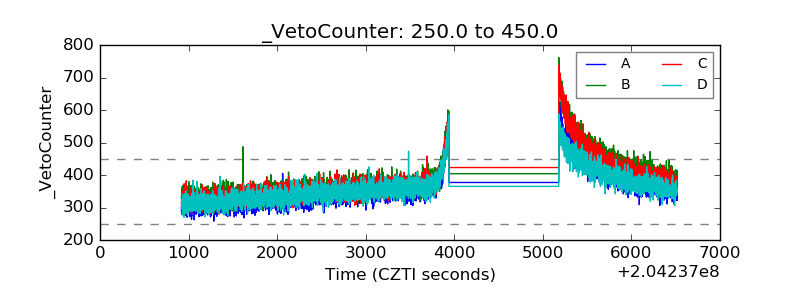 |