| Param | Original file | Final file |
|---|---|---|
| Filename | modeM0/AS1G05_229T02_9000000508_03966cztM0_level2.evt | modeM0/AS1G05_229T02_9000000508_03966cztM0_level2_quad_clean.evt |
| Size (bytes) | 730,584,000 | 96,724,800 |
| Size | 696.7 MB | 92.2 MB |
| Events in quadrant A | 5,023,456 | 566,104 |
| Events in quadrant B | 5,457,307 | 567,839 |
| Events in quadrant C | 4,692,685 | 560,390 |
| Events in quadrant D | 6,259,235 | 525,434 |
| Mode M9 | |||
|---|---|---|---|
| Quadrant | BADHDUFLAG | Total packets | Discarded packets |
| A | 0 | 26 | 0 |
| B | 0 | 26 | 0 |
| C | 0 | 26 | 0 |
| D | 0 | 26 | 0 |
| Mode SS | |||
|---|---|---|---|
| Quadrant | BADHDUFLAG | Total packets | Discarded packets |
| A | 0 | 210 | 0 |
| B | 0 | 210 | 0 |
| C | 0 | 210 | 0 |
| D | 0 | 210 | 0 |
| Mode M0 | |||
|---|---|---|---|
| Quadrant | BADHDUFLAG | Total packets | Discarded packets |
| A | 0 | 21603 | 3 |
| B | 0 | 22529 | 2 |
| C | 0 | 20790 | 2 |
| D | 0 | 25806 | 2 |
| Quadrant | Total seconds | Saturated seconds | Saturation percentage |
|---|---|---|---|
| A | 10231 | 54 | 0.527808% |
| B | 10231 | 91 | 0.889454% |
| C | 10231 | 17 | 0.166162% |
| D | 10231 | 258 | 2.521748% |
Noise dominated data is calculated using 1-second bins in cleaned event files. If a bin has >2000 counts, and if more than 50% of those come from <1% of pixels, then it is considered to be noise-dominated and hence unusable.
| Quadrant | # 1 sec bins | Bins with >0 counts | Bins with >2000 counts | High rate bins dominated by noise | Noise dominated (total time) | Noise dominated (detector-on time) | Marked lightcurve |
|---|---|---|---|---|---|---|---|
| A | 12936 | 10233 | 12 | 12 | 0.09% | 0.12% | 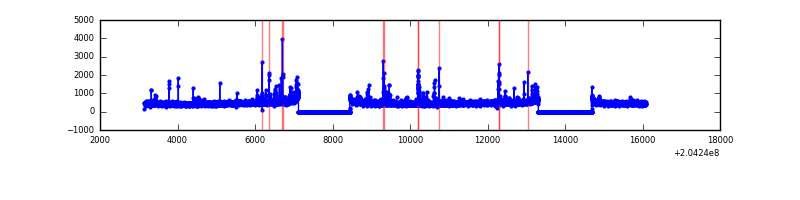 |
| B | 12936 | 10233 | 48 | 48 | 0.37% | 0.47% | 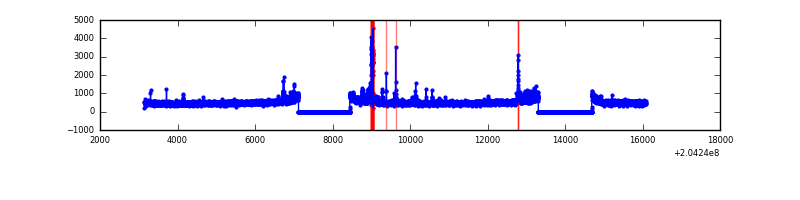 |
| C | 12936 | 10233 | 0 | 0 | 0.00% | 0.00% | 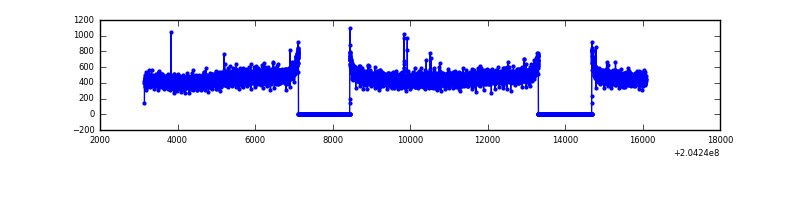 |
| D | 12936 | 10233 | 231 | 231 | 1.79% | 2.26% | 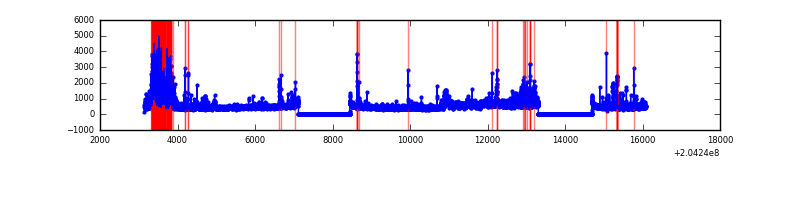 |
Top three noisy pixels from each quadrant. If the there are fewer than three noisy pixels in the level2.evt file, extra rows are filled as -1
| Pixel properties | Quadrant properties | ||||||
|---|---|---|---|---|---|---|---|
| Quadrant | DetID | PixID | Counts | Sigma | Mean | Median | Sigma |
| A | 0 | 118 | 214989 | 854.85 | 1229 | 1205 | 250.1 |
| A | 0 | 226 | 31575 | 121.44 | 1229 | 1205 | 250.1 |
| A | 8 | 4 | 22446 | 84.94 | 1229 | 1205 | 250.1 |
| B | 3 | 0 | 152162 | 639.51 | 1247 | 1218 | 236.0 |
| B | 10 | 16 | 150561 | 632.73 | 1247 | 1218 | 236.0 |
| B | 15 | 204 | 150006 | 630.38 | 1247 | 1218 | 236.0 |
| C | 10 | 65 | 19418 | 65.38 | 1193 | 1199 | 278.7 |
| C | 13 | 61 | 9905 | 31.24 | 1193 | 1199 | 278.7 |
| C | 8 | 128 | 7504 | 22.63 | 1193 | 1199 | 278.7 |
| D | 10 | 246 | 859518 | 3033.58 | 1164 | 1132 | 283.0 |
| D | 2 | 232 | 760444 | 2683.44 | 1164 | 1132 | 283.0 |
| D | 13 | 239 | 77473 | 269.79 | 1164 | 1132 | 283.0 |
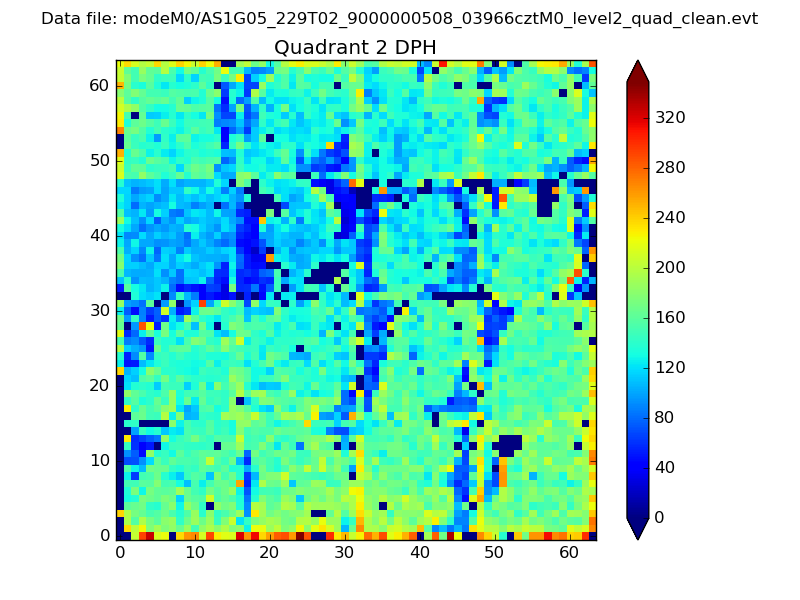
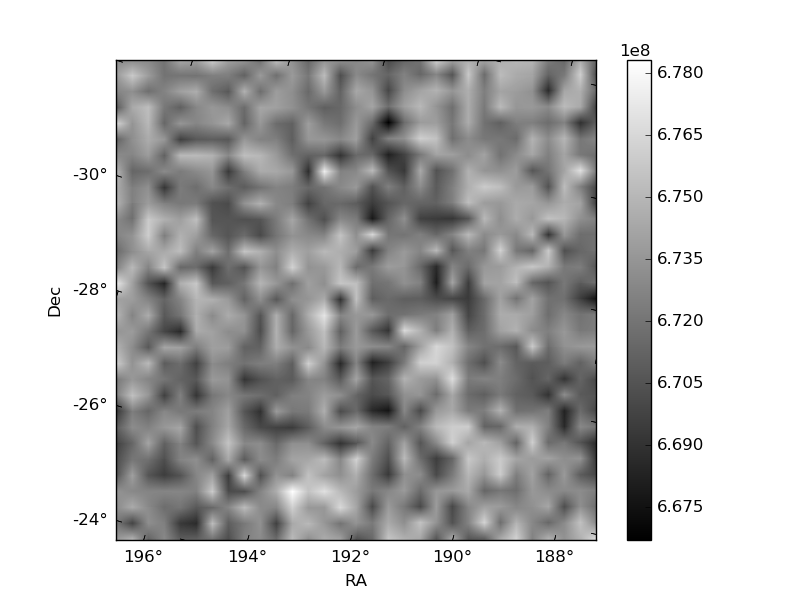
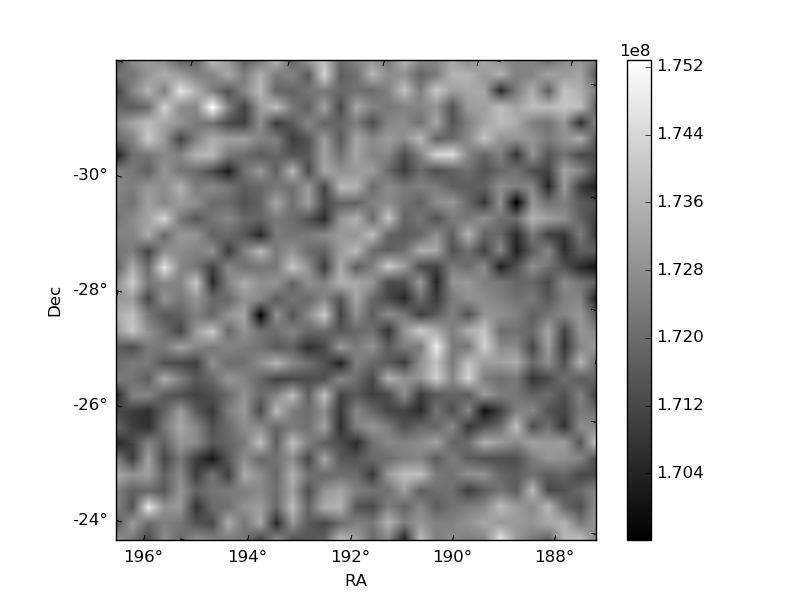
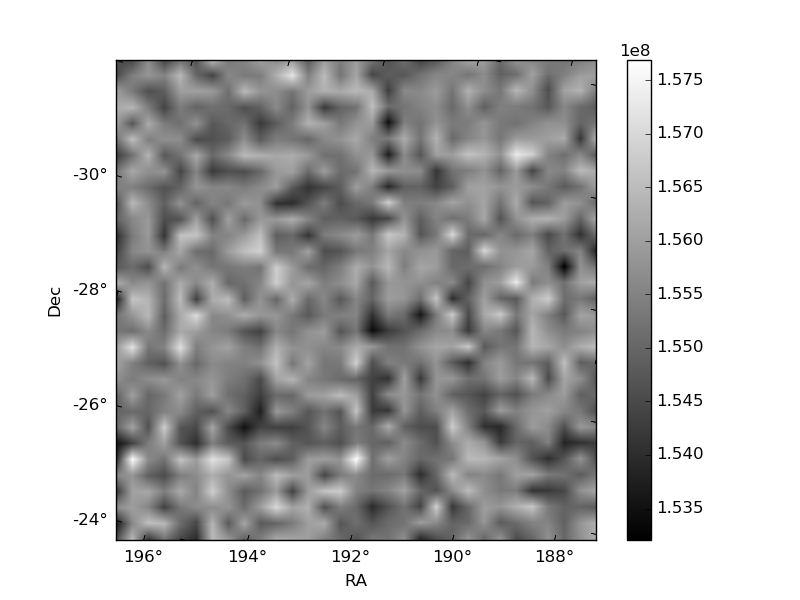
Histogram calculated using DETX and DETY for each event in the final _common_clean file
| Quadrant A | 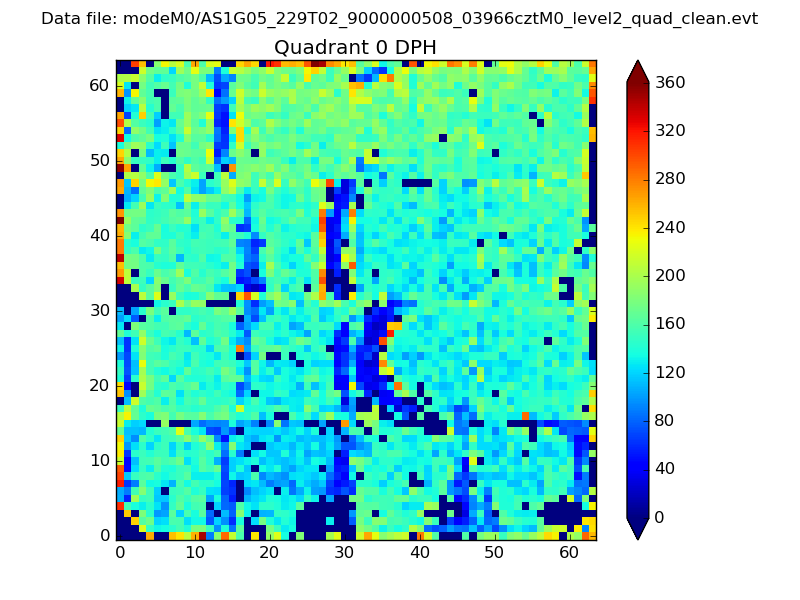 |
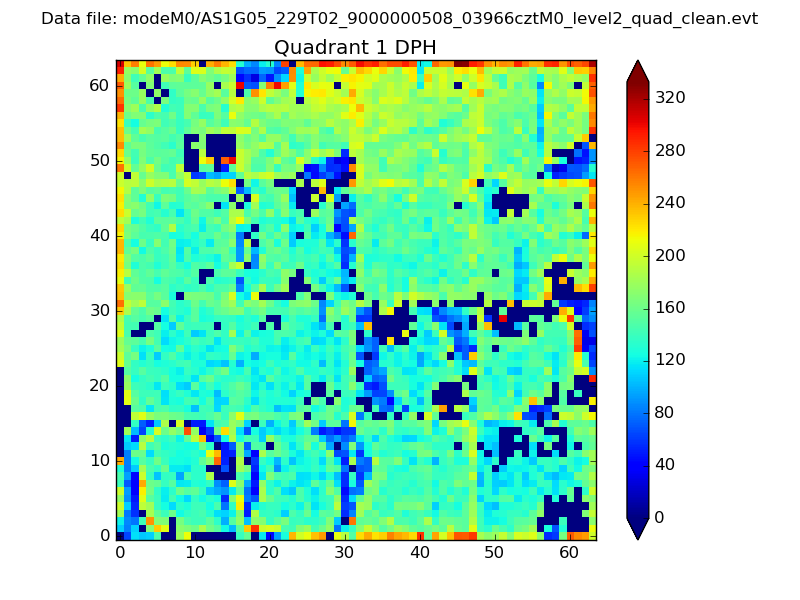 |
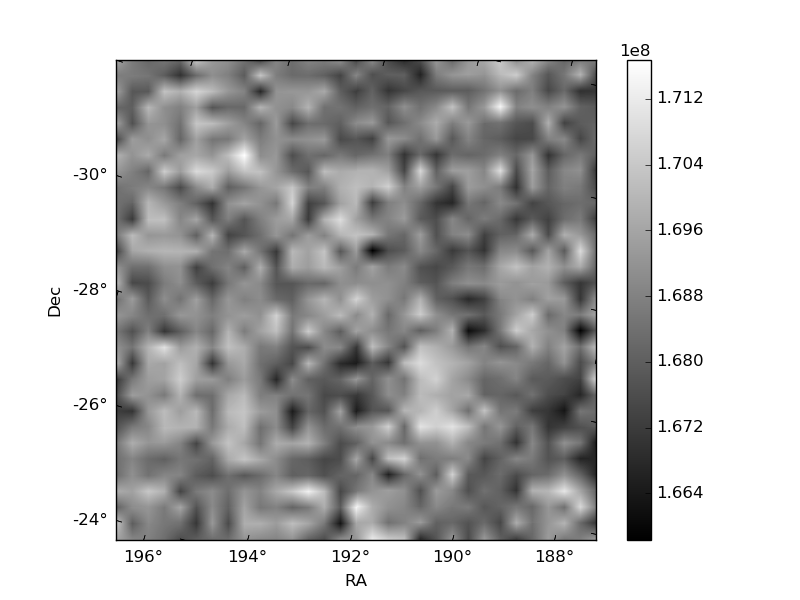
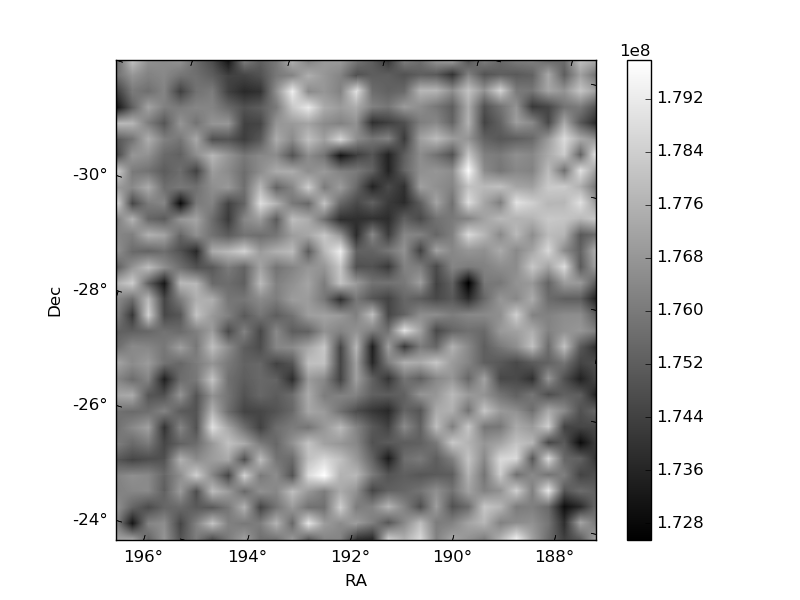
Quadrant B |
|---|---|---|---|
| Quadrant D | 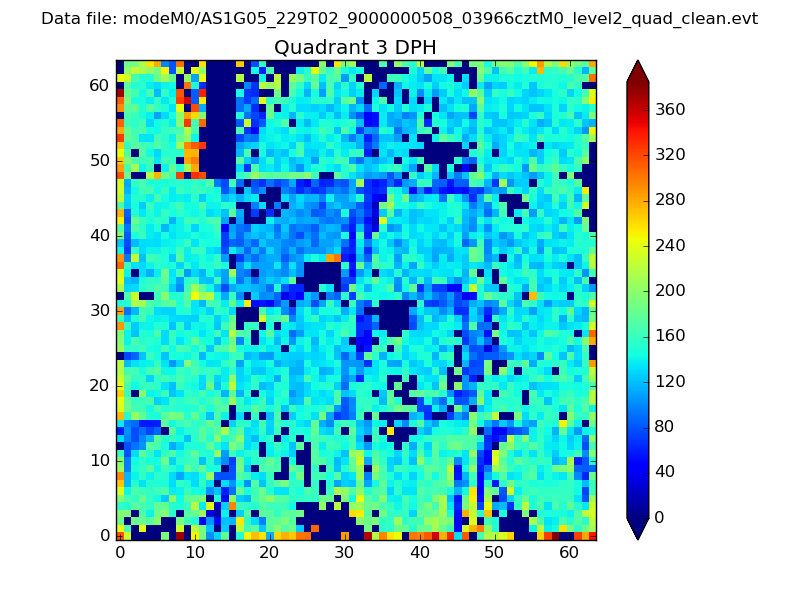 |
 |
Quadrant C |
| Plot type | Count rate plots | Images |
|---|---|---|
| Comparison with Poisson distribution Blue bars denote a histogram of data divided into 1 sec bins. Red curve is a Poisson curve with rate = median count rate of data. |
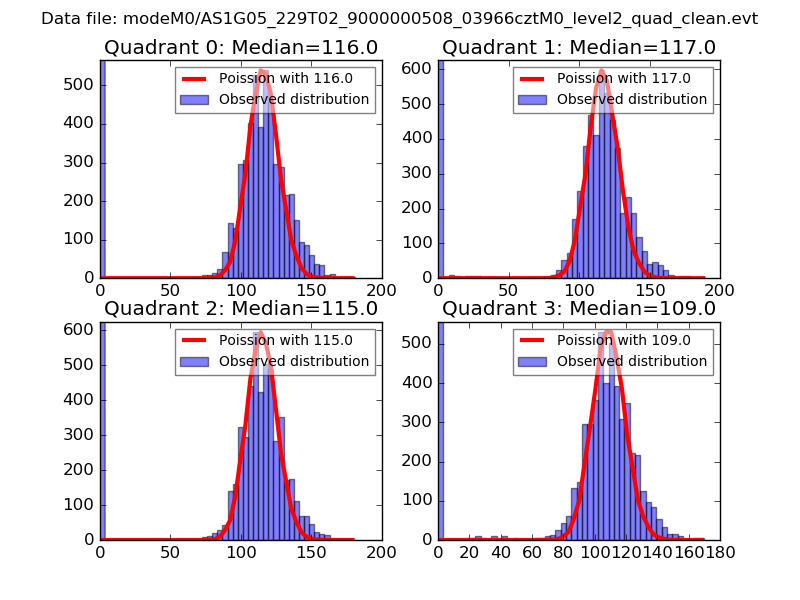 |
 |
| Quadrant-wise count rates Data is divided into 100 sec bins |
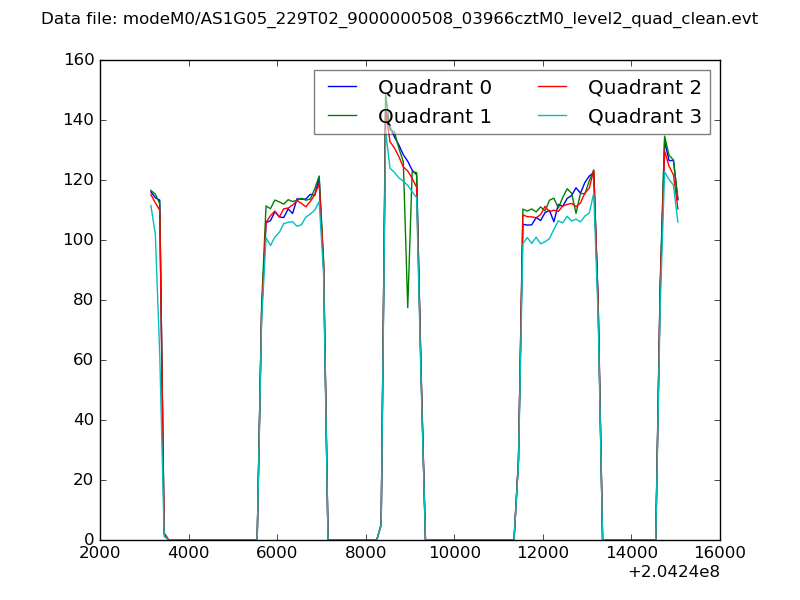 |
|
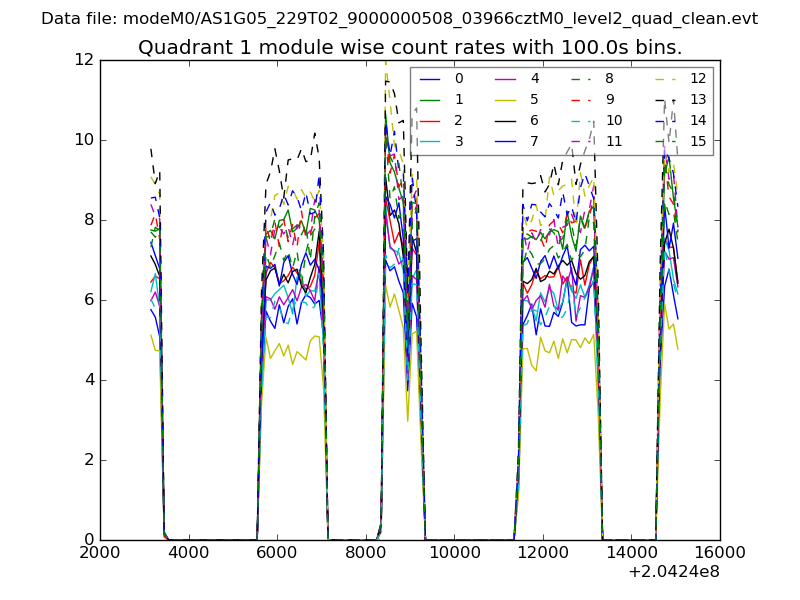
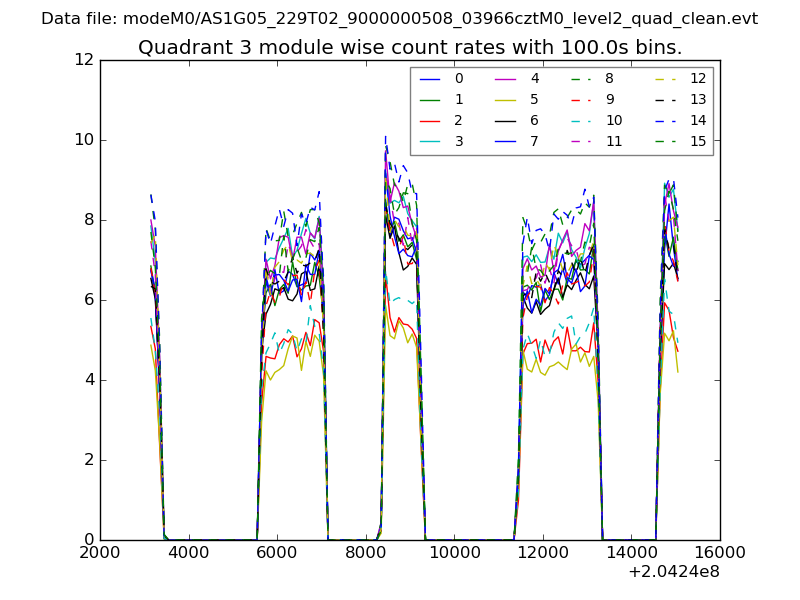
| Module-wise count rates for Quadrant A Data is divided into 100 sec bins |
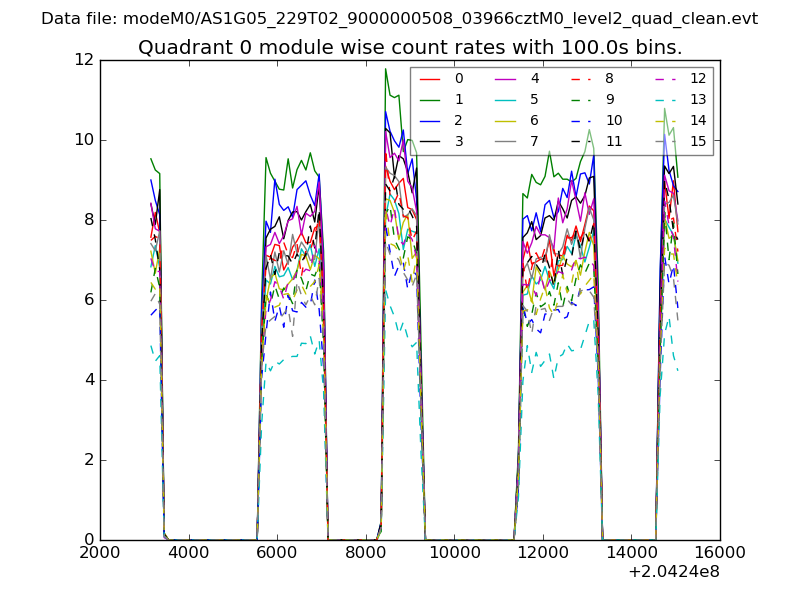 |
 |
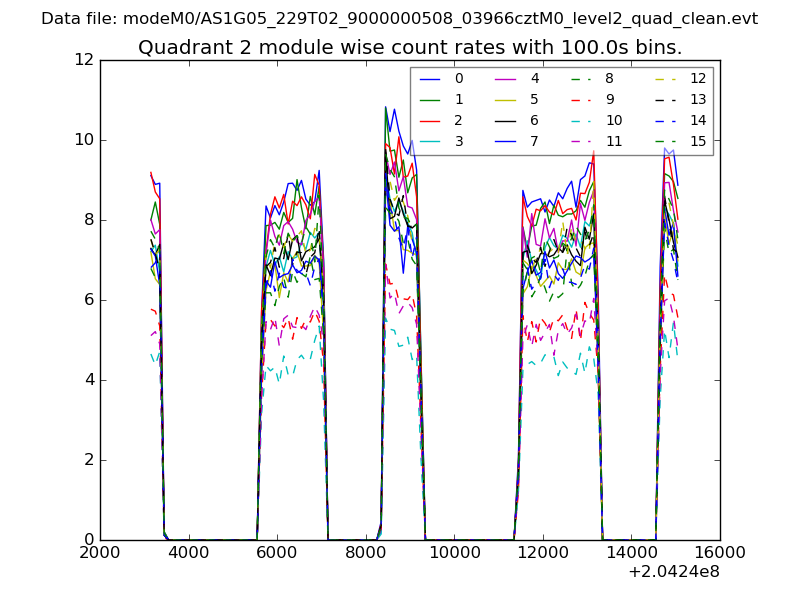
| Module-wise count rates for Quadrant B Data is divided into 100 sec bins |
 |
 |
| Module-wise count rates for Quadrant C Data is divided into 100 sec bins |
 |
 |
| Module-wise count rates for Quadrant D Data is divided into 100 sec bins |
 |
 |
| Parameter | Plot |
|---|---|
| CZT HV Monitor | 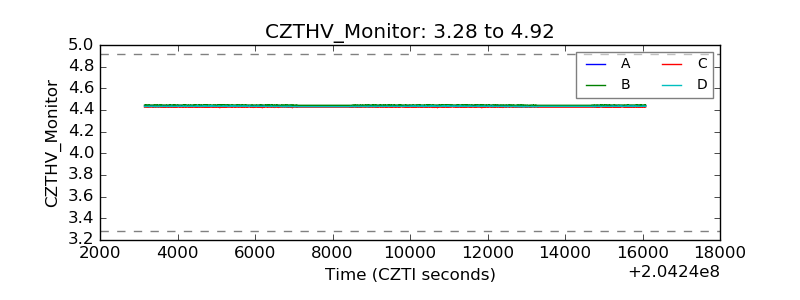 |
| D_VDD | 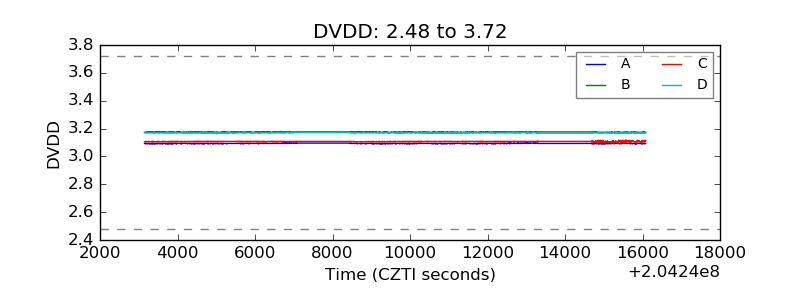 |
| Temperature 1 | 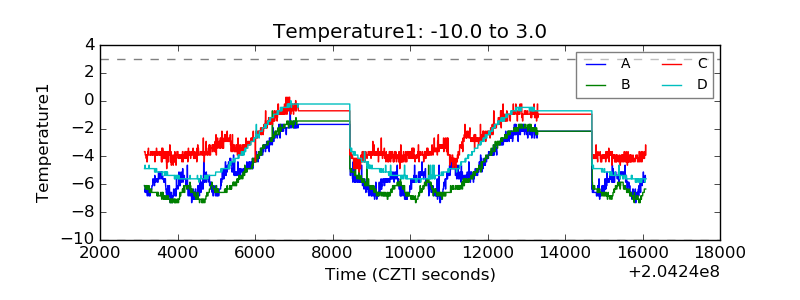 |
| Veto HV Monitor | 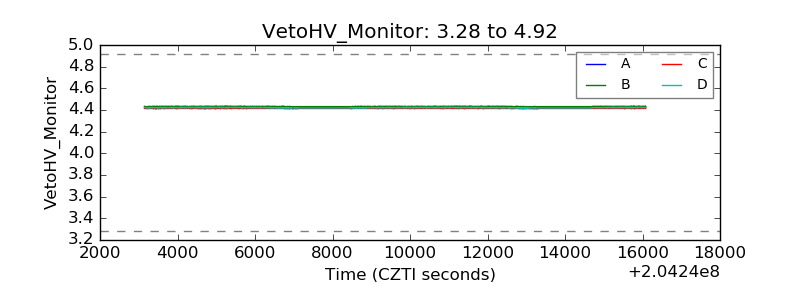 |
| Veto LLD | 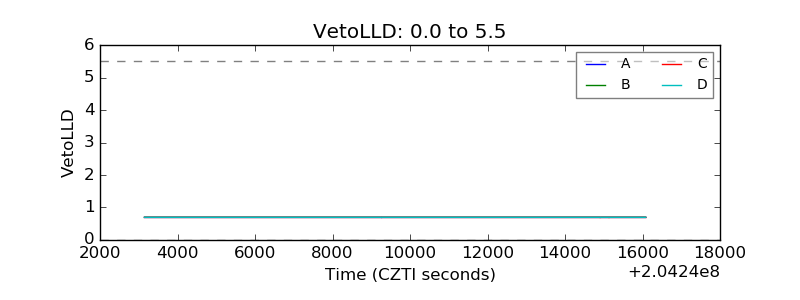 |
| Alpha Counter | 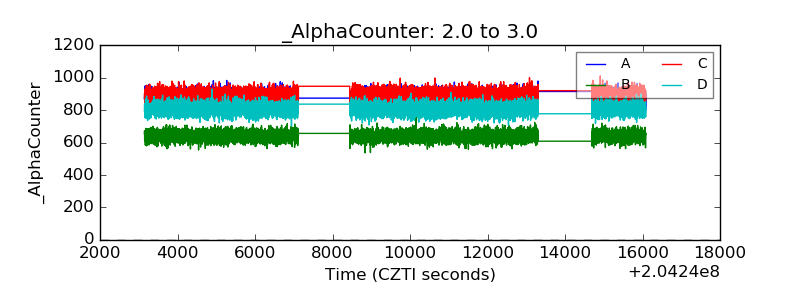 |
| _CPM_Rate | 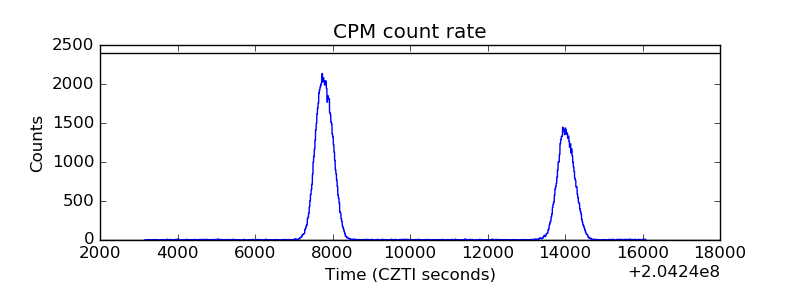 |
| CZT Counter | 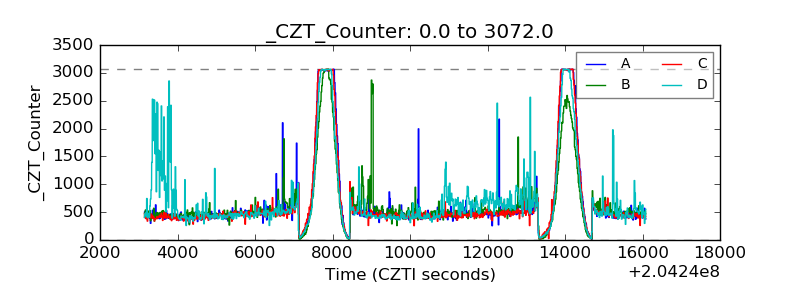 |
| +2.5 Volts monitor | 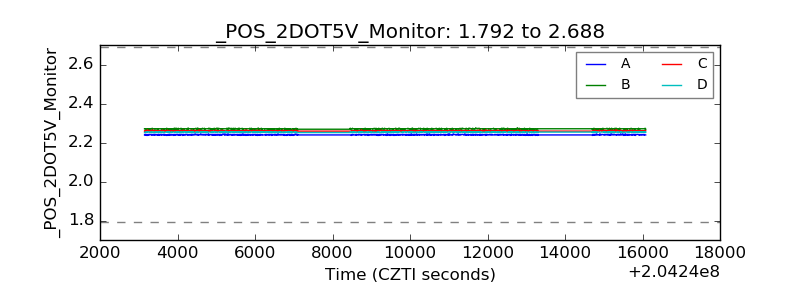 |
| +5 Volts monitor |  |
| _ROLL_ROT | 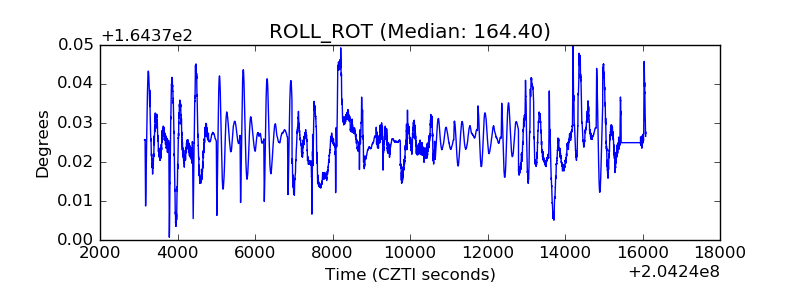 |
| _Roll_DEC | 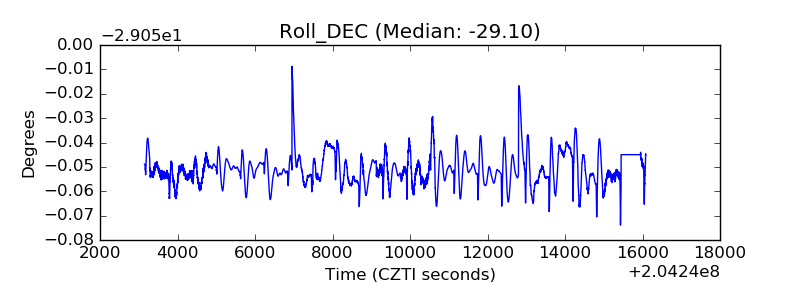 |
| _Roll_RA | 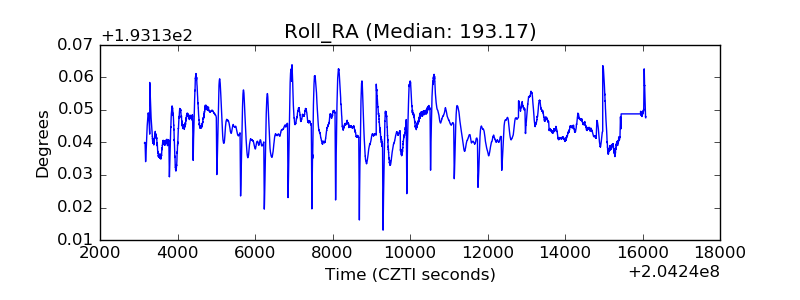 |
| Veto Counter | 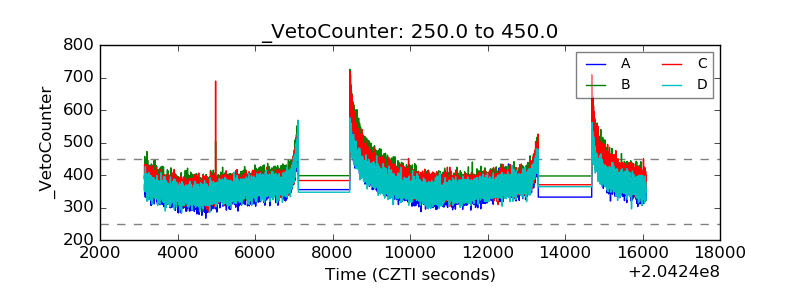 |