| Param | Original file | Final file |
|---|---|---|
| Filename | modeM0/AS1G05_229T02_9000000508_03968cztM0_level2.evt | modeM0/AS1G05_229T02_9000000508_03968cztM0_level2_quad_clean.evt |
| Size (bytes) | 443,041,920 | 56,940,480 |
| Size | 422.5 MB | 54.3 MB |
| Events in quadrant A | 3,215,215 | 320,440 |
| Events in quadrant B | 3,540,715 | 321,426 |
| Events in quadrant C | 2,941,015 | 320,337 |
| Events in quadrant D | 3,277,872 | 307,277 |
| Mode M9 | |||
|---|---|---|---|
| Quadrant | BADHDUFLAG | Total packets | Discarded packets |
| A | 0 | 10 | 0 |
| B | 0 | 10 | 0 |
| C | 0 | 10 | 0 |
| D | 0 | 10 | 0 |
| Mode SS | |||
|---|---|---|---|
| Quadrant | BADHDUFLAG | Total packets | Discarded packets |
| A | 0 | 132 | 0 |
| B | 0 | 132 | 0 |
| C | 0 | 132 | 0 |
| D | 0 | 132 | 0 |
| Mode M0 | |||
|---|---|---|---|
| Quadrant | BADHDUFLAG | Total packets | Discarded packets |
| A | 0 | 13908 | 2 |
| B | 0 | 14393 | 1 |
| C | 0 | 13329 | 1 |
| D | 0 | 14400 | 1 |
| Quadrant | Total seconds | Saturated seconds | Saturation percentage |
|---|---|---|---|
| A | 6514 | 99 | 1.519804% |
| B | 6514 | 107 | 1.642616% |
| C | 6514 | 60 | 0.921093% |
| D | 6514 | 103 | 1.581210% |
Noise dominated data is calculated using 1-second bins in cleaned event files. If a bin has >2000 counts, and if more than 50% of those come from <1% of pixels, then it is considered to be noise-dominated and hence unusable.
| Quadrant | # 1 sec bins | Bins with >0 counts | Bins with >2000 counts | High rate bins dominated by noise | Noise dominated (total time) | Noise dominated (detector-on time) | Marked lightcurve |
|---|---|---|---|---|---|---|---|
| A | 7469 | 6515 | 22 | 22 | 0.29% | 0.34% | 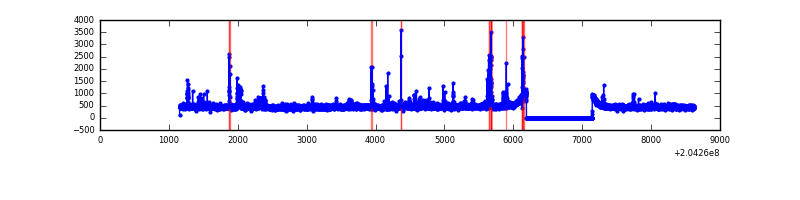 |
| B | 7469 | 6515 | 9 | 9 | 0.12% | 0.14% | 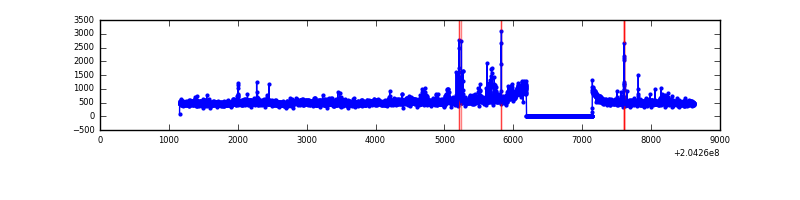 |
| C | 7469 | 6515 | 0 | 0 | 0.00% | 0.00% | 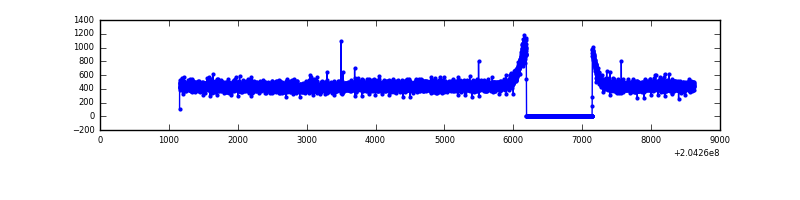 |
| D | 7469 | 6515 | 30 | 30 | 0.40% | 0.46% | 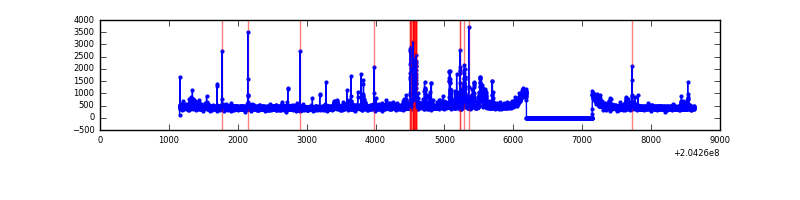 |
Top three noisy pixels from each quadrant. If the there are fewer than three noisy pixels in the level2.evt file, extra rows are filled as -1
| Pixel properties | Quadrant properties | ||||||
|---|---|---|---|---|---|---|---|
| Quadrant | DetID | PixID | Counts | Sigma | Mean | Median | Sigma |
| A | 0 | 118 | 121897 | 762.26 | 770 | 752 | 158.9 |
| A | 0 | 50 | 93936 | 586.32 | 770 | 752 | 158.9 |
| A | 0 | 226 | 18578 | 112.16 | 770 | 752 | 158.9 |
| B | 3 | 0 | 238090 | 1566.74 | 782 | 761 | 151.5 |
| B | 4 | 81 | 99893 | 654.43 | 782 | 761 | 151.5 |
| B | 15 | 204 | 80432 | 525.95 | 782 | 761 | 151.5 |
| C | 13 | 61 | 6290 | 31.15 | 752 | 754 | 177.7 |
| C | 14 | 67 | 2216 | 8.23 | 752 | 754 | 177.7 |
| C | 4 | 250 | 1979 | 6.89 | 752 | 754 | 177.7 |
| D | 2 | 232 | 193565 | 1073.51 | 743 | 721 | 179.6 |
| D | 4 | 95 | 84921 | 468.72 | 743 | 721 | 179.6 |
| D | 2 | 63 | 49198 | 269.86 | 743 | 721 | 179.6 |
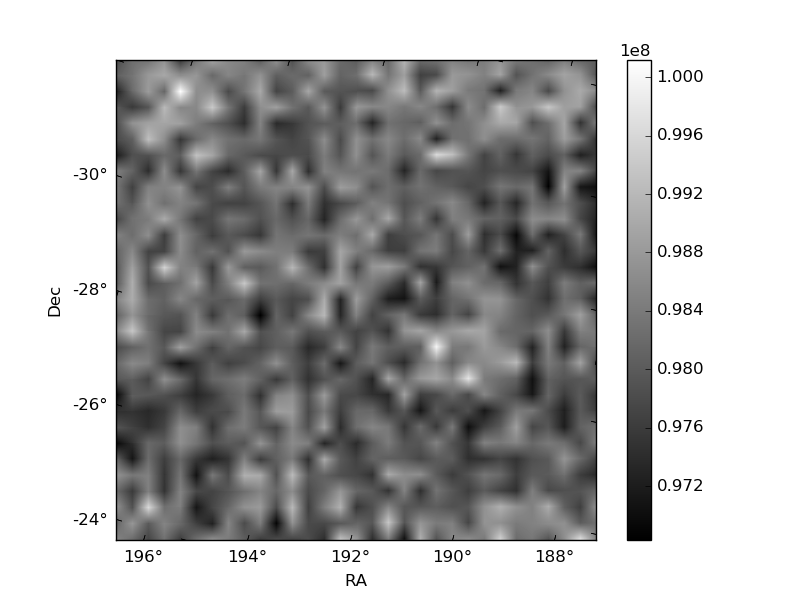
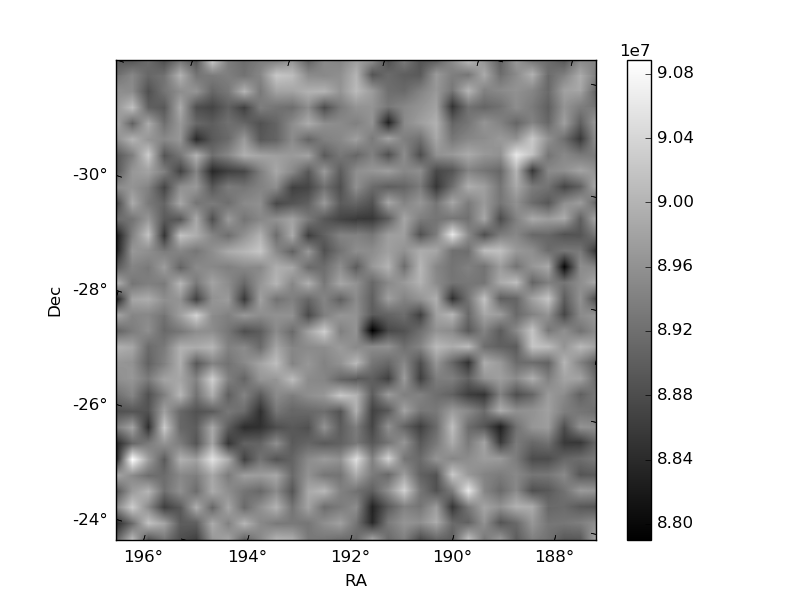
Histogram calculated using DETX and DETY for each event in the final _common_clean file
| Quadrant A | 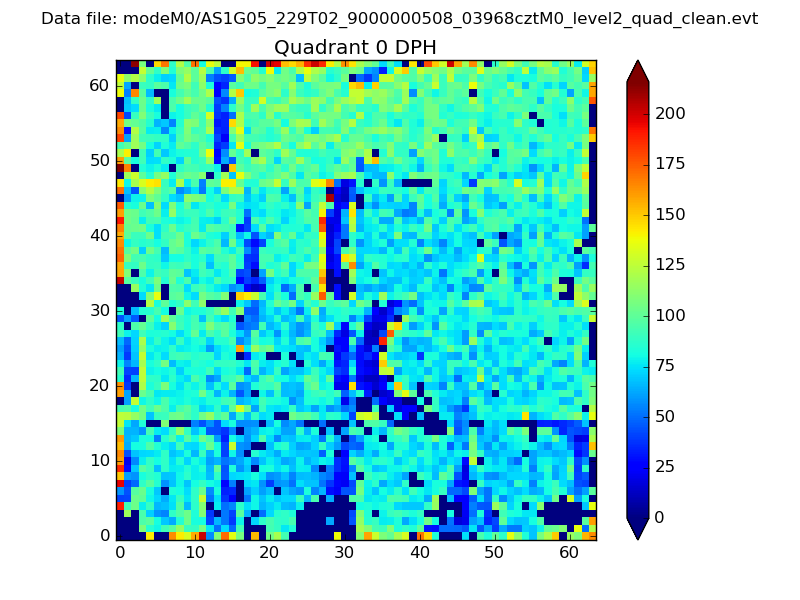 |
 |
Quadrant B |
|---|---|---|---|
| Quadrant D |  |
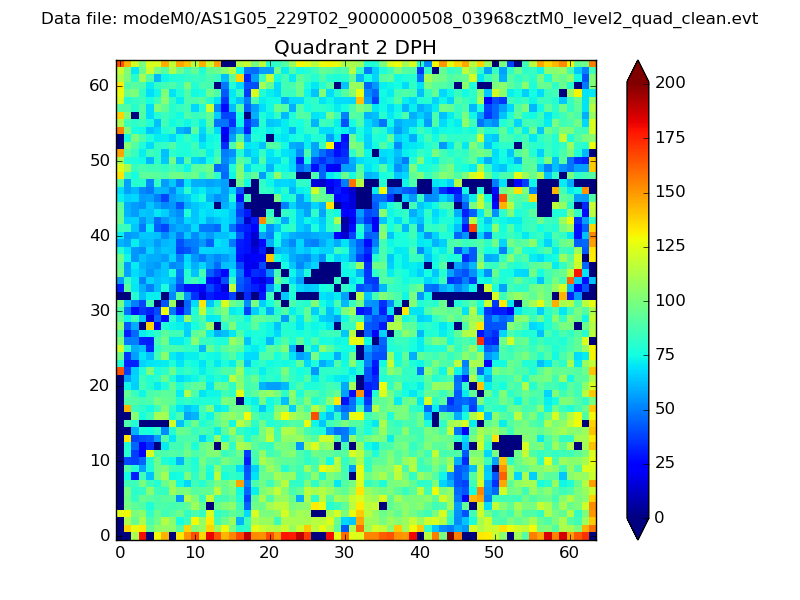 |
Quadrant C |
| Plot type | Count rate plots | Images |
|---|---|---|
| Comparison with Poisson distribution Blue bars denote a histogram of data divided into 1 sec bins. Red curve is a Poisson curve with rate = median count rate of data. |
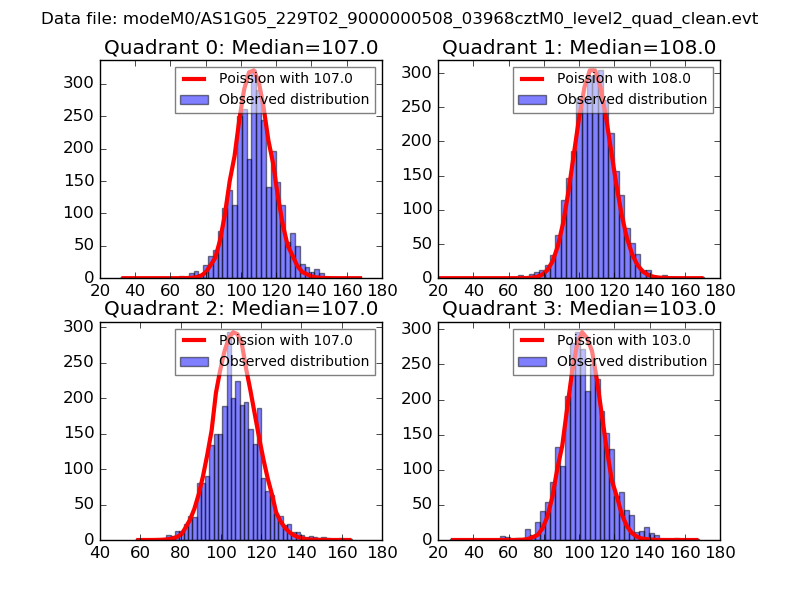 |
 |
| Quadrant-wise count rates Data is divided into 100 sec bins |
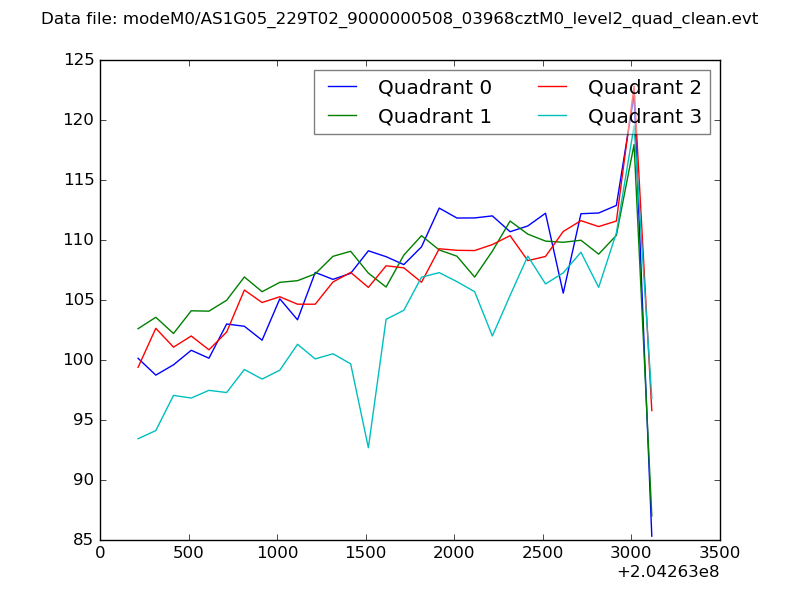 |
|
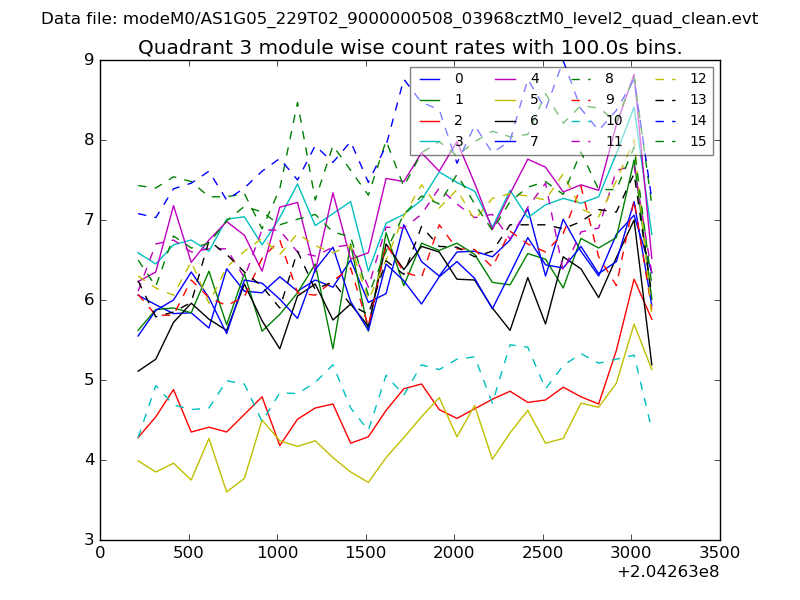
| Module-wise count rates for Quadrant A Data is divided into 100 sec bins |
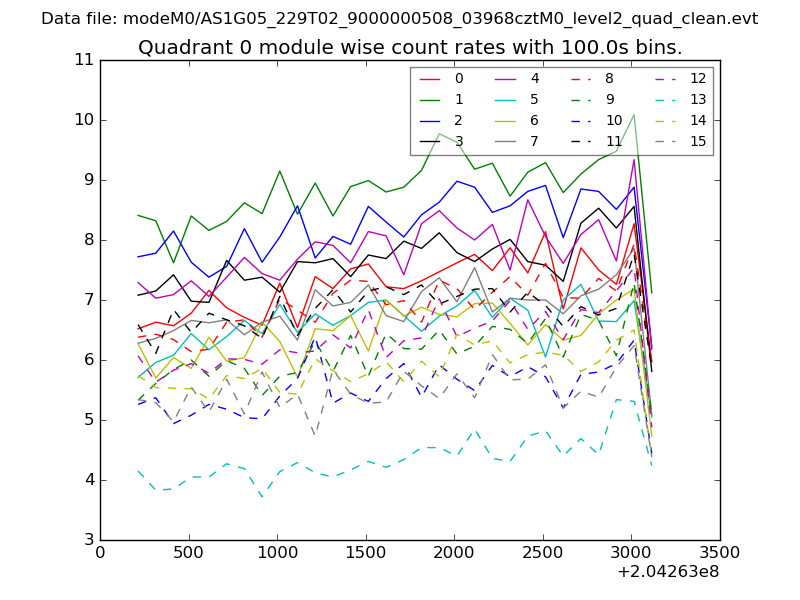 |
 |
| Module-wise count rates for Quadrant B Data is divided into 100 sec bins |
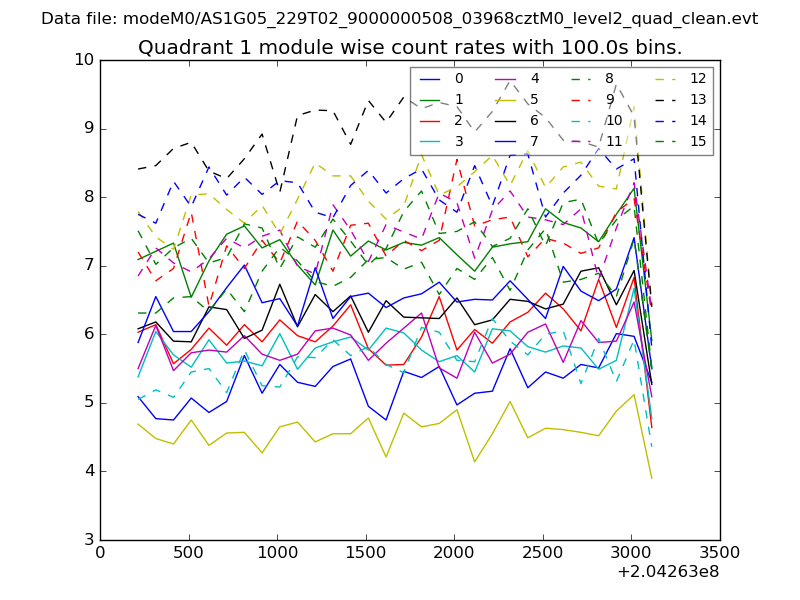 |
 |
| Module-wise count rates for Quadrant C Data is divided into 100 sec bins |
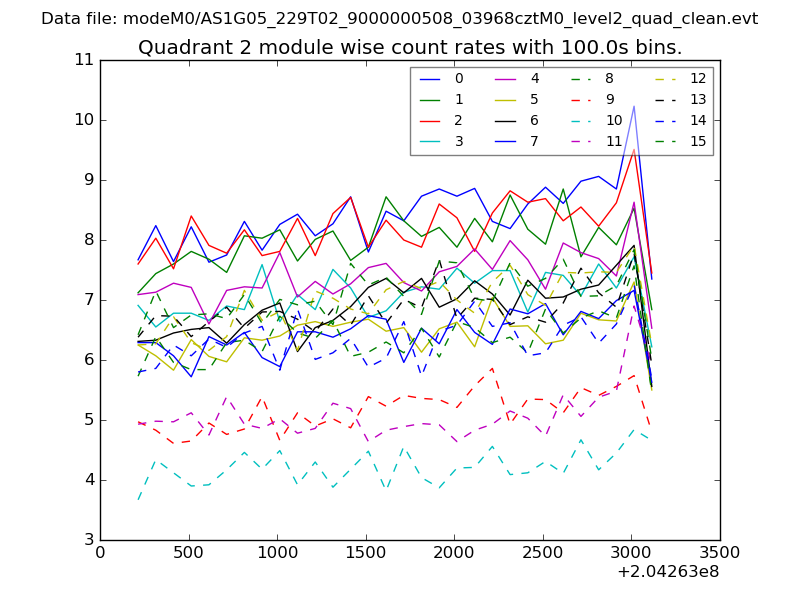 |
 |
| Module-wise count rates for Quadrant D Data is divided into 100 sec bins |
 |
 |
| Parameter | Plot |
|---|---|
| CZT HV Monitor | 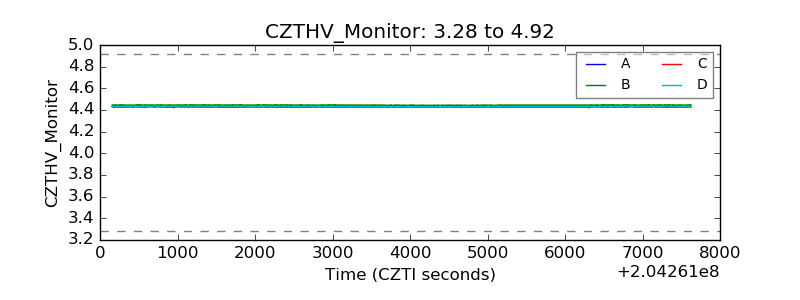 |
| D_VDD | 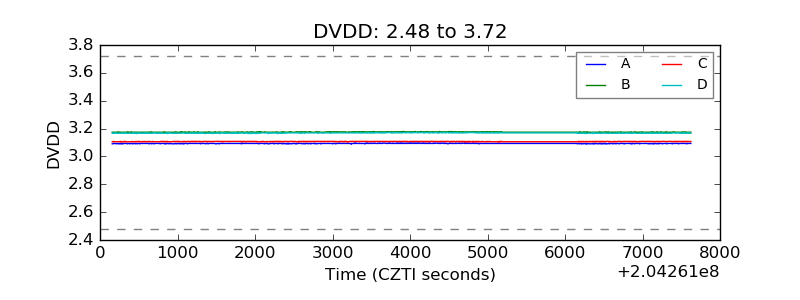 |
| Temperature 1 | 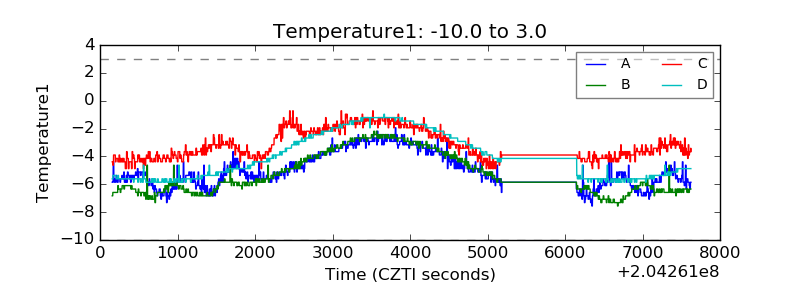 |
| Veto HV Monitor | 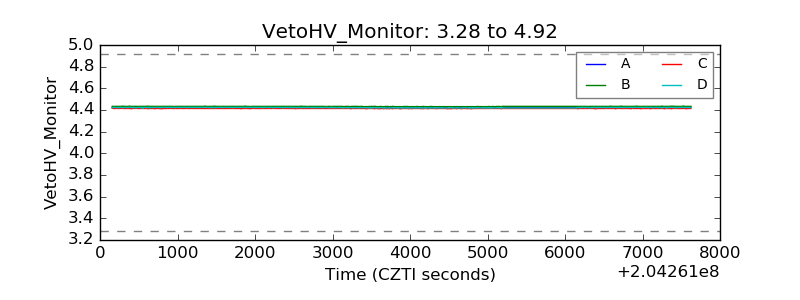 |
| Veto LLD | 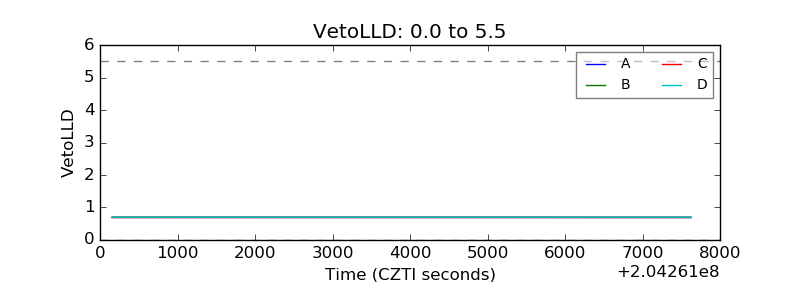 |
| Alpha Counter | 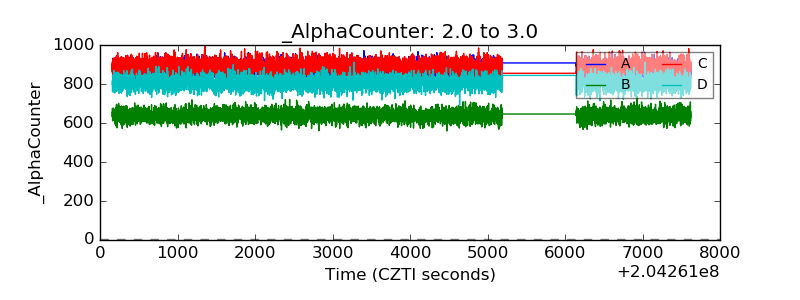 |
| _CPM_Rate | 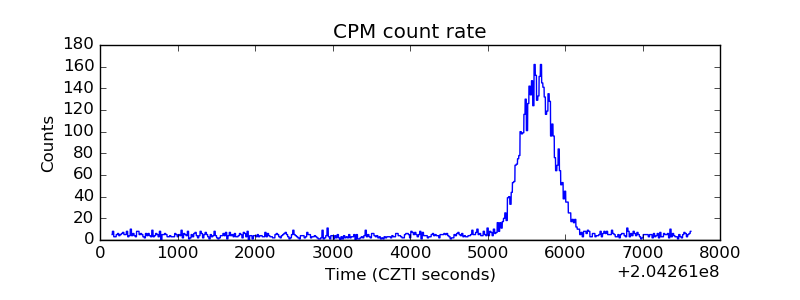 |
| CZT Counter | 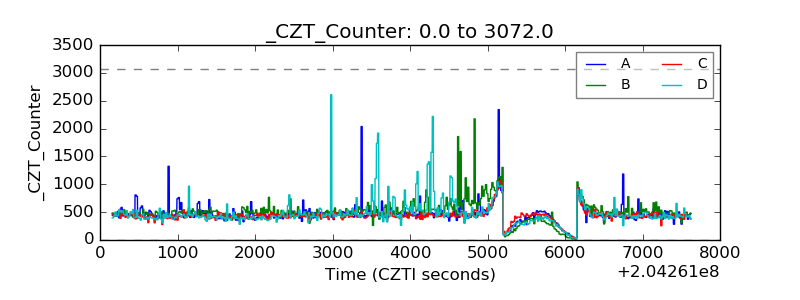 |
| +2.5 Volts monitor |  |
| +5 Volts monitor |  |
| _ROLL_ROT |  |
| _Roll_DEC | 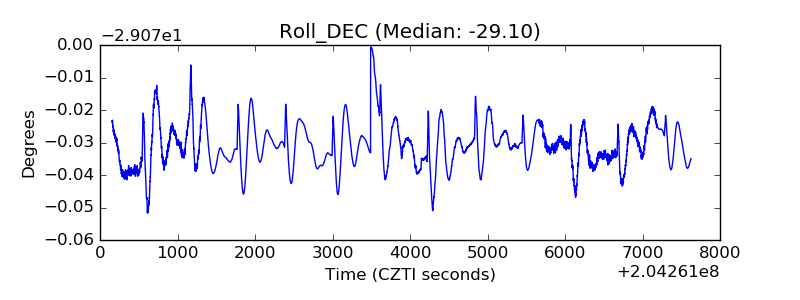 |
| _Roll_RA | 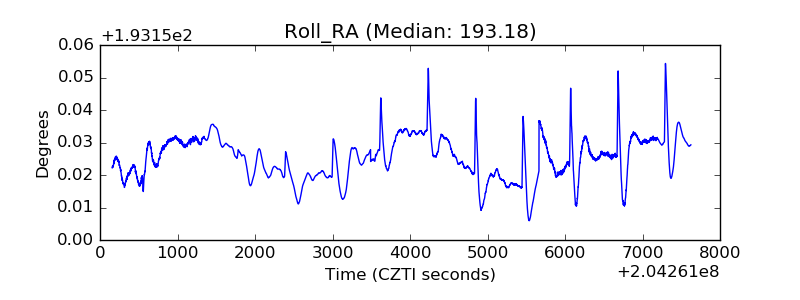 |
| Veto Counter | 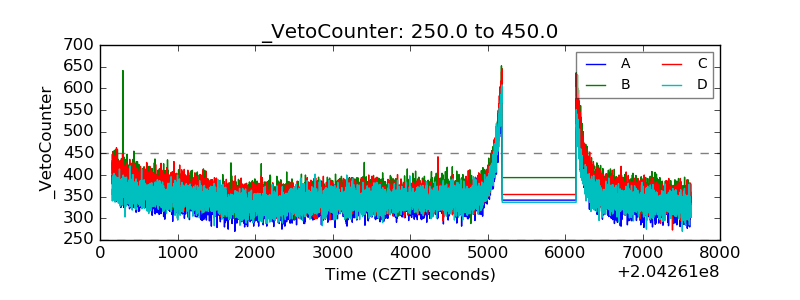 |