| Param | Original file | Final file |
|---|---|---|
| Filename | modeM0/AS1G05_229T02_9000000508_03969cztM0_level2.evt | modeM0/AS1G05_229T02_9000000508_03969cztM0_level2_quad_clean.evt |
| Size (bytes) | 482,497,920 | 66,070,080 |
| Size | 460.1 MB | 63.0 MB |
| Events in quadrant A | 3,600,750 | 380,219 |
| Events in quadrant B | 3,890,968 | 380,051 |
| Events in quadrant C | 3,270,847 | 379,337 |
| Events in quadrant D | 3,366,838 | 365,940 |
| Mode M9 | |||
|---|---|---|---|
| Quadrant | BADHDUFLAG | Total packets | Discarded packets |
| A | 0 | 5 | 0 |
| B | 0 | 5 | 0 |
| C | 0 | 5 | 0 |
| D | 0 | 5 | 0 |
| Mode SS | |||
|---|---|---|---|
| Quadrant | BADHDUFLAG | Total packets | Discarded packets |
| A | 0 | 144 | 0 |
| B | 0 | 144 | 0 |
| C | 0 | 144 | 0 |
| D | 0 | 144 | 0 |
| Mode M0 | |||
|---|---|---|---|
| Quadrant | BADHDUFLAG | Total packets | Discarded packets |
| A | 0 | 15551 | 2 |
| B | 0 | 15961 | 1 |
| C | 0 | 14826 | 1 |
| D | 0 | 15162 | 1 |
| Quadrant | Total seconds | Saturated seconds | Saturation percentage |
|---|---|---|---|
| A | 7106 | 197 | 2.772305% |
| B | 7106 | 201 | 2.828596% |
| C | 7106 | 147 | 2.068674% |
| D | 7106 | 143 | 2.012384% |
Noise dominated data is calculated using 1-second bins in cleaned event files. If a bin has >2000 counts, and if more than 50% of those come from <1% of pixels, then it is considered to be noise-dominated and hence unusable.
| Quadrant | # 1 sec bins | Bins with >0 counts | Bins with >2000 counts | High rate bins dominated by noise | Noise dominated (total time) | Noise dominated (detector-on time) | Marked lightcurve |
|---|---|---|---|---|---|---|---|
| A | 7596 | 7107 | 31 | 31 | 0.41% | 0.44% |  |
| B | 7596 | 7107 | 22 | 22 | 0.29% | 0.31% |  |
| C | 7596 | 7107 | 3 | 3 | 0.04% | 0.04% | 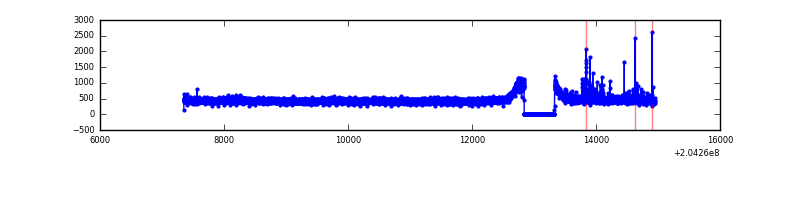 |
| D | 7596 | 7107 | 11 | 11 | 0.14% | 0.15% | 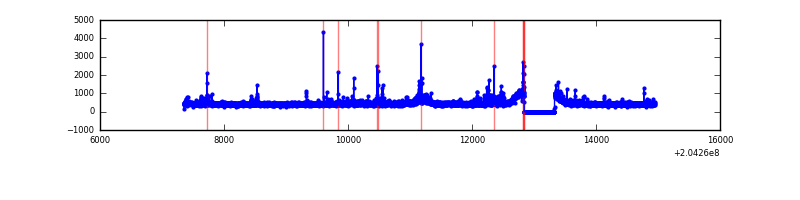 |
Top three noisy pixels from each quadrant. If the there are fewer than three noisy pixels in the level2.evt file, extra rows are filled as -1
| Pixel properties | Quadrant properties | ||||||
|---|---|---|---|---|---|---|---|
| Quadrant | DetID | PixID | Counts | Sigma | Mean | Median | Sigma |
| A | 0 | 118 | 210032 | 1199.49 | 839 | 821 | 174.4 |
| A | 0 | 50 | 57684 | 326.02 | 839 | 821 | 174.4 |
| A | 12 | 247 | 48319 | 272.32 | 839 | 821 | 174.4 |
| B | 3 | 0 | 203846 | 1222.08 | 851 | 828 | 166.1 |
| B | 15 | 204 | 141232 | 845.17 | 851 | 828 | 166.1 |
| B | 4 | 81 | 70746 | 420.87 | 851 | 828 | 166.1 |
| C | 9 | 144 | 62411 | 317.96 | 819 | 821 | 193.7 |
| C | 13 | 61 | 6869 | 31.22 | 819 | 821 | 193.7 |
| C | 10 | 65 | 6809 | 30.91 | 819 | 821 | 193.7 |
| D | 4 | 95 | 57087 | 283.13 | 812 | 787 | 198.8 |
| D | 13 | 239 | 52150 | 258.3 | 812 | 787 | 198.8 |
| D | 2 | 118 | 48463 | 239.76 | 812 | 787 | 198.8 |
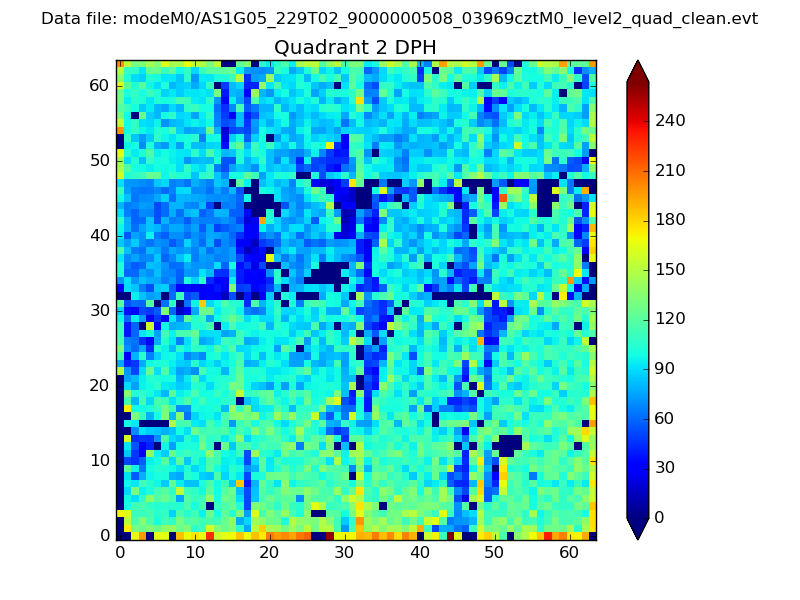
Histogram calculated using DETX and DETY for each event in the final _common_clean file
| Quadrant A | 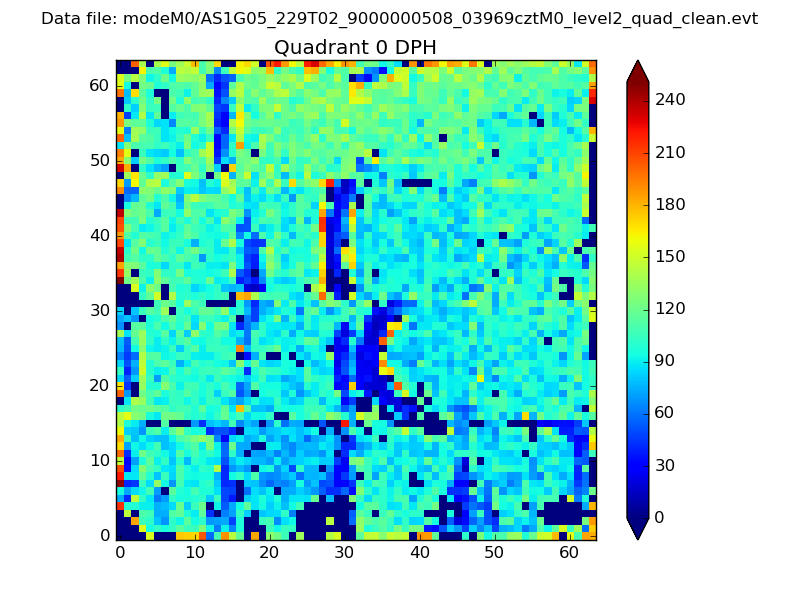 |
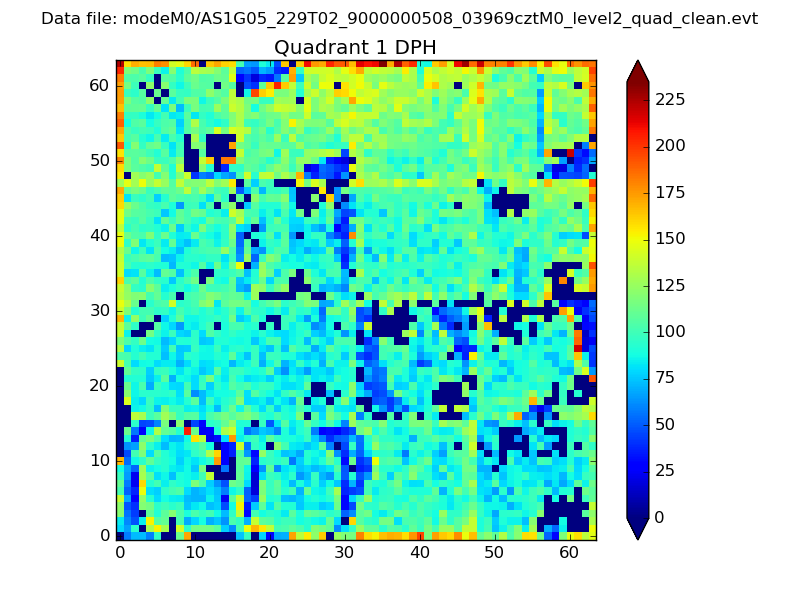 |
Quadrant B |
|---|---|---|---|
| Quadrant D | 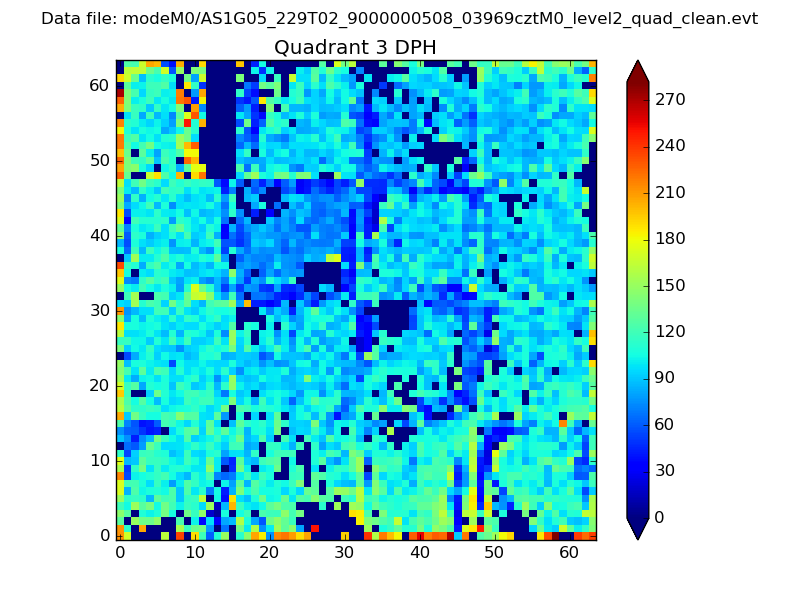 |
 |
Quadrant C |
| Plot type | Count rate plots | Images |
|---|---|---|
| Comparison with Poisson distribution Blue bars denote a histogram of data divided into 1 sec bins. Red curve is a Poisson curve with rate = median count rate of data. |
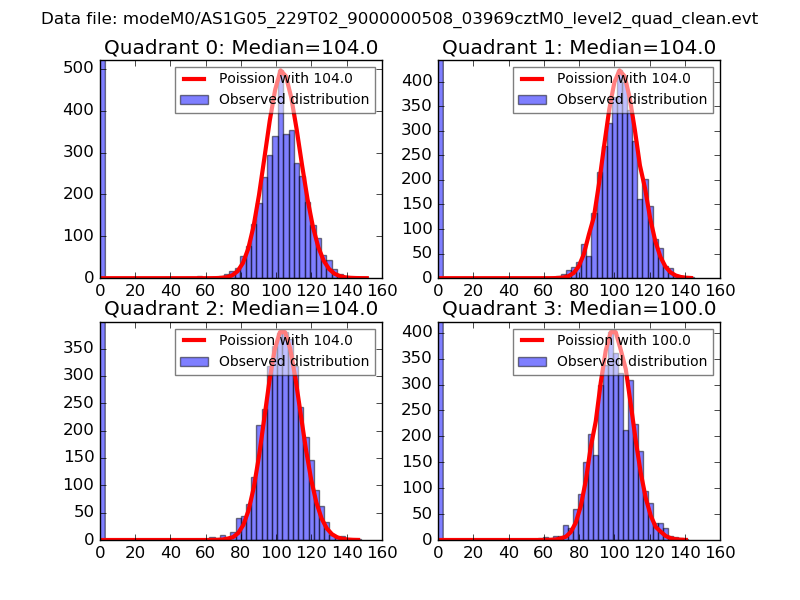 |
 |
| Quadrant-wise count rates Data is divided into 100 sec bins |
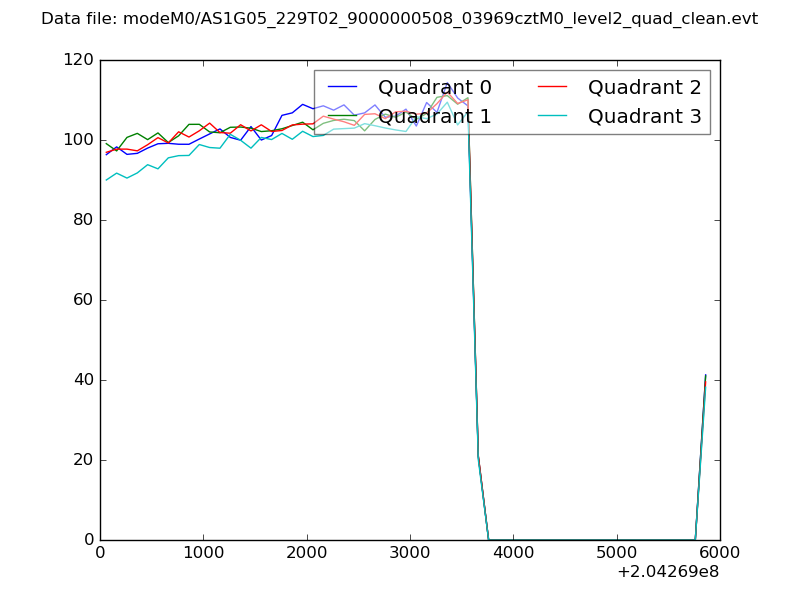 |
|
| Module-wise count rates for Quadrant A Data is divided into 100 sec bins |
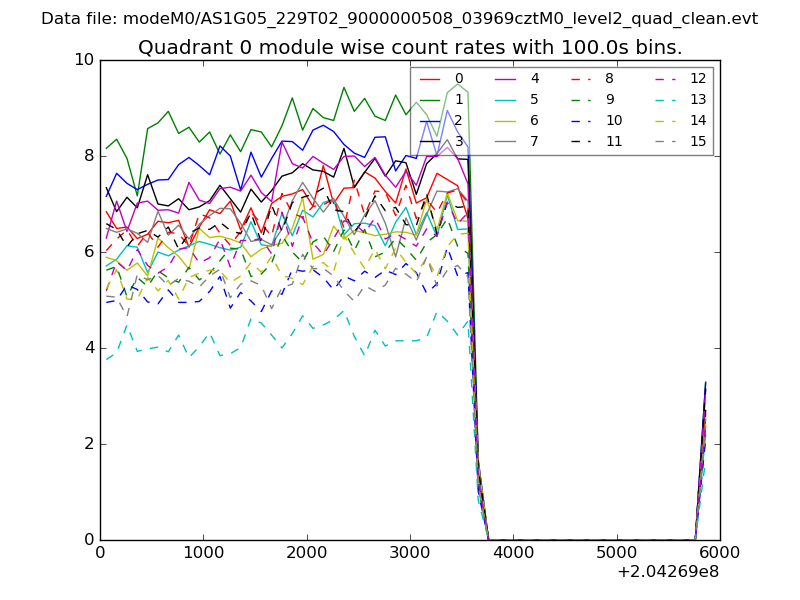 |
 |
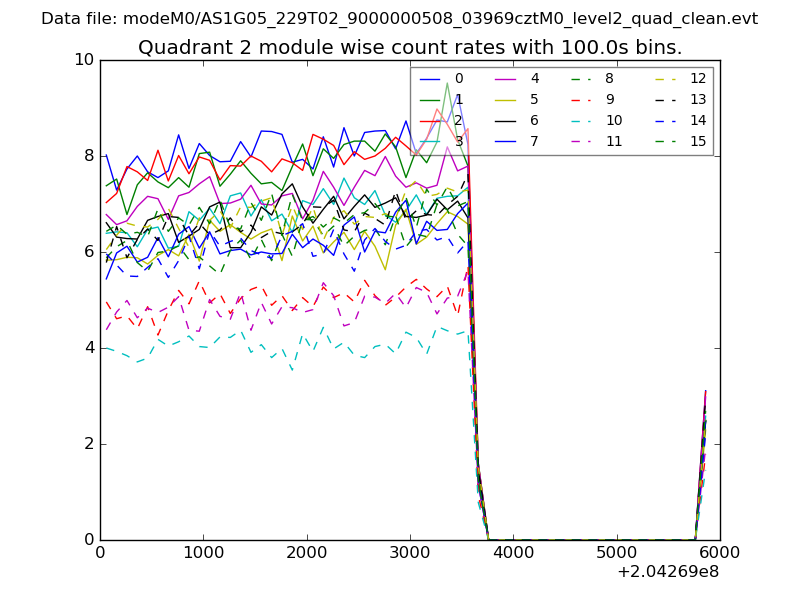
| Module-wise count rates for Quadrant B Data is divided into 100 sec bins |
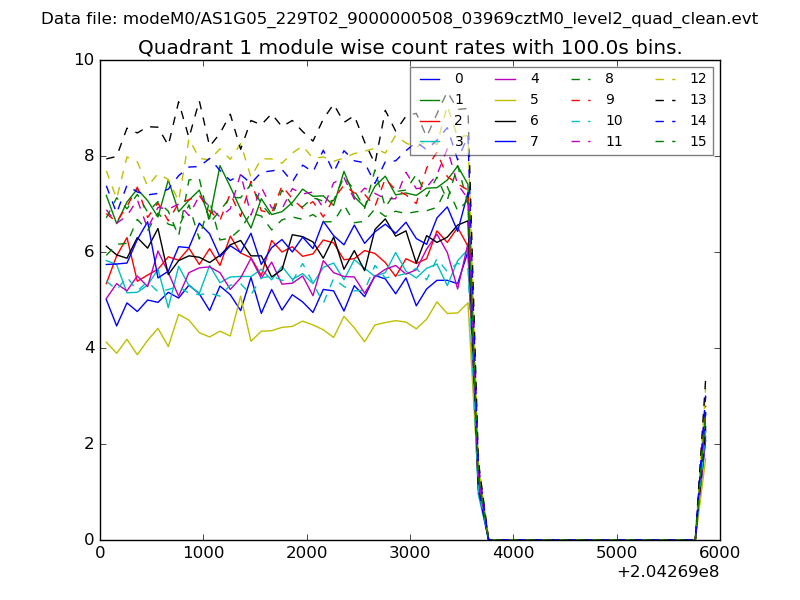 |
 |
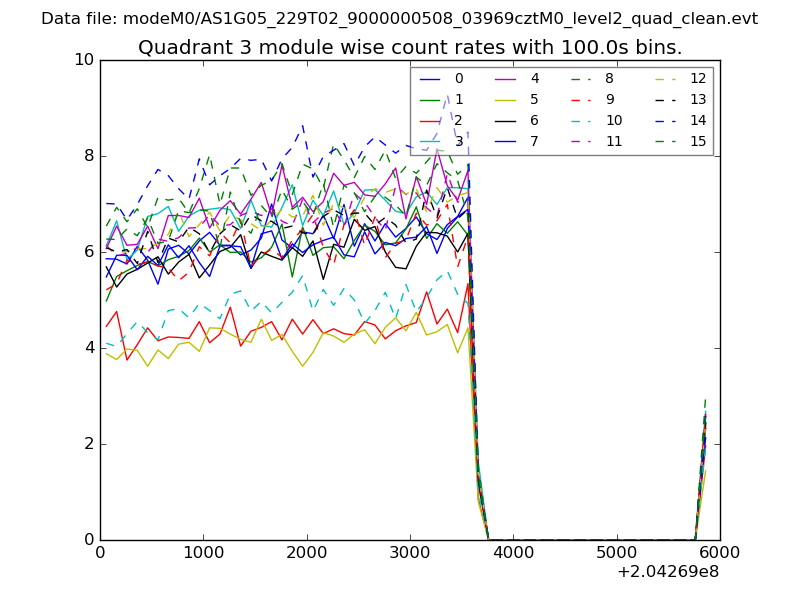
| Module-wise count rates for Quadrant C Data is divided into 100 sec bins |
 |
 |
| Module-wise count rates for Quadrant D Data is divided into 100 sec bins |
 |
 |
| Parameter | Plot |
|---|---|
| CZT HV Monitor | 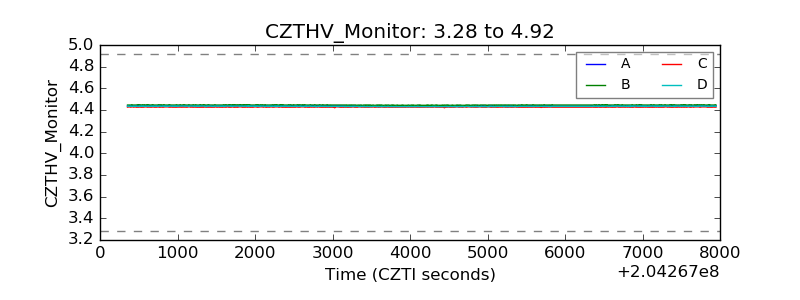 |
| D_VDD |  |
| Temperature 1 | 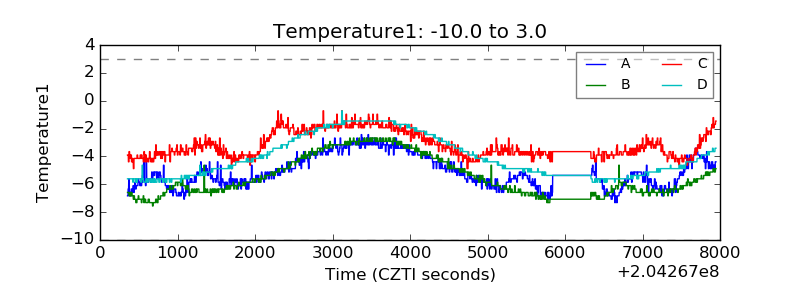 |
| Veto HV Monitor | 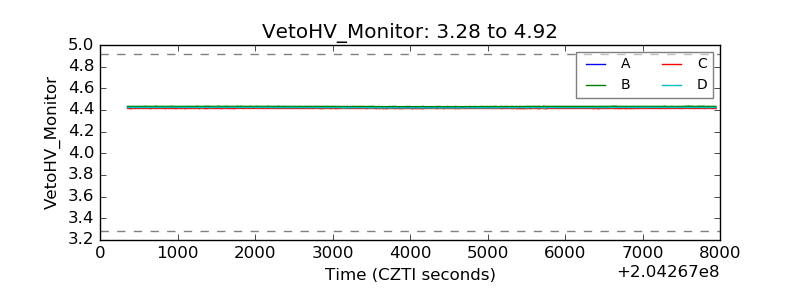 |
| Veto LLD | 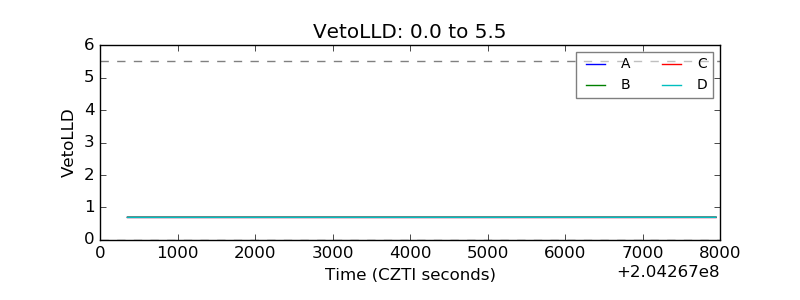 |
| Alpha Counter | 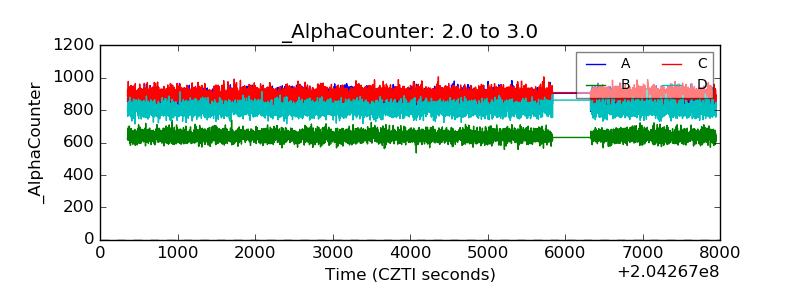 |
| _CPM_Rate | 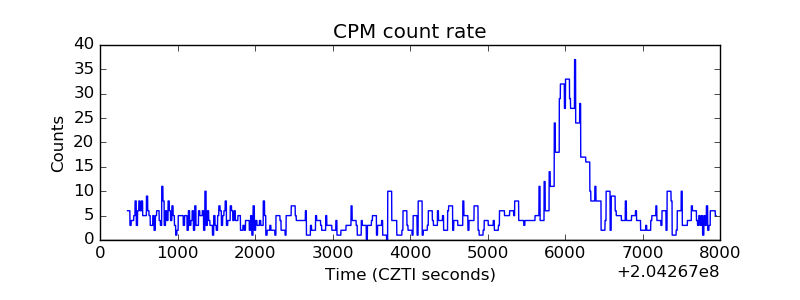 |
| CZT Counter | 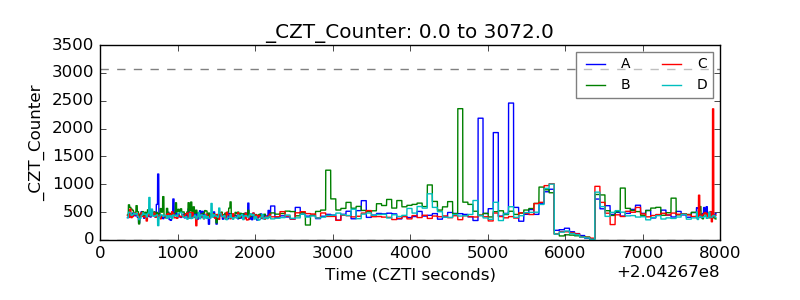 |
| +2.5 Volts monitor |  |
| +5 Volts monitor |  |
| _ROLL_ROT | 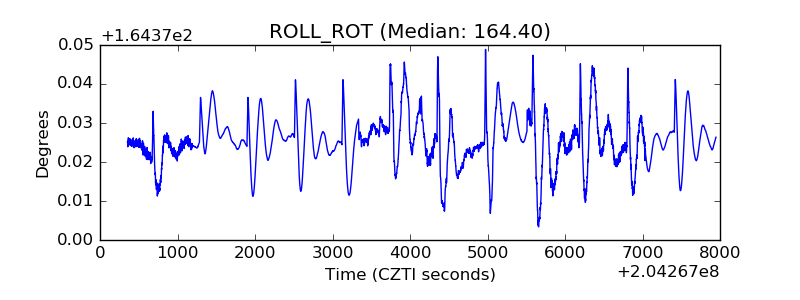 |
| _Roll_DEC | 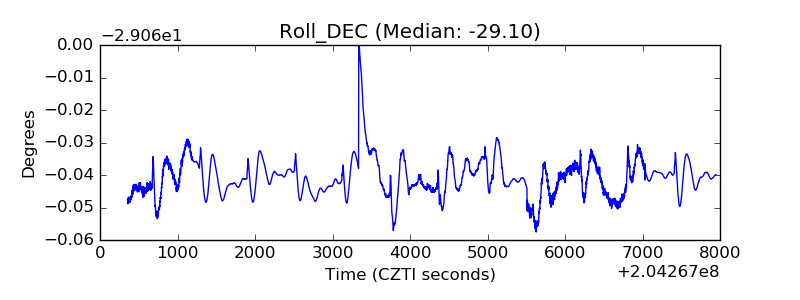 |
| _Roll_RA | 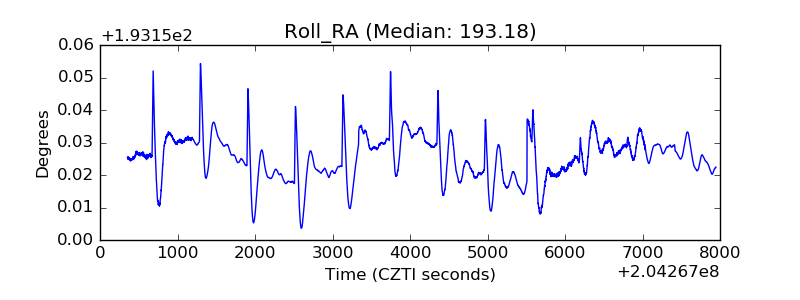 |
| Veto Counter | 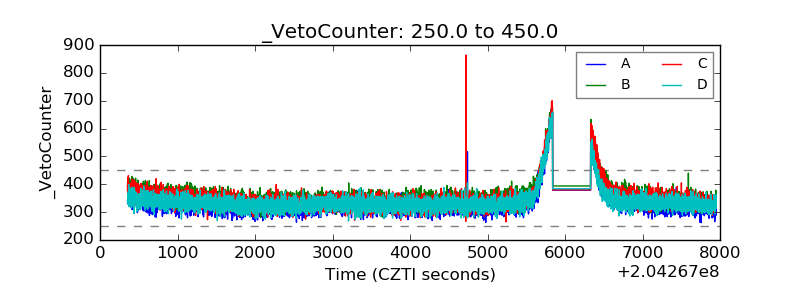 |