| Param | Original file | Final file |
|---|---|---|
| Filename | modeM0/AS1G05_229T02_9000000508_03971cztM0_level2.evt | modeM0/AS1G05_229T02_9000000508_03971cztM0_level2_quad_clean.evt |
| Size (bytes) | 560,718,720 | 78,399,360 |
| Size | 534.7 MB | 74.8 MB |
| Events in quadrant A | 4,177,164 | 458,994 |
| Events in quadrant B | 4,362,193 | 460,622 |
| Events in quadrant C | 3,842,199 | 455,112 |
| Events in quadrant D | 4,052,419 | 439,404 |
| Mode M9 | |||
|---|---|---|---|
| Quadrant | BADHDUFLAG | Total packets | Discarded packets |
| A | 0 | 3 | 0 |
| B | 0 | 3 | 0 |
| C | 0 | 3 | 0 |
| D | 0 | 3 | 0 |
| Mode SS | |||
|---|---|---|---|
| Quadrant | BADHDUFLAG | Total packets | Discarded packets |
| A | 0 | 164 | 0 |
| B | 0 | 164 | 0 |
| C | 0 | 164 | 0 |
| D | 0 | 164 | 0 |
| Mode M0 | |||
|---|---|---|---|
| Quadrant | BADHDUFLAG | Total packets | Discarded packets |
| A | 0 | 17900 | 6 |
| B | 0 | 18053 | 5 |
| C | 0 | 17041 | 10 |
| D | 0 | 17798 | 5 |
| Quadrant | Total seconds | Saturated seconds | Saturation percentage |
|---|---|---|---|
| A | 8066 | 513 | 6.360030% |
| B | 8066 | 473 | 5.864121% |
| C | 8064 | 335 | 4.154266% |
| D | 8066 | 419 | 5.194644% |
Noise dominated data is calculated using 1-second bins in cleaned event files. If a bin has >2000 counts, and if more than 50% of those come from <1% of pixels, then it is considered to be noise-dominated and hence unusable.
| Quadrant | # 1 sec bins | Bins with >0 counts | Bins with >2000 counts | High rate bins dominated by noise | Noise dominated (total time) | Noise dominated (detector-on time) | Marked lightcurve |
|---|---|---|---|---|---|---|---|
| A | 8247 | 8070 | 30 | 30 | 0.36% | 0.37% | 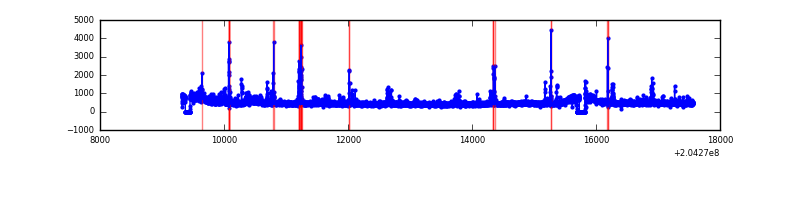 |
| B | 8247 | 8070 | 8 | 8 | 0.10% | 0.10% | 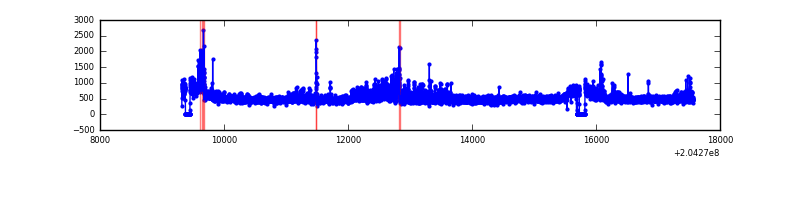 |
| C | 8247 | 8070 | 5 | 5 | 0.06% | 0.06% | 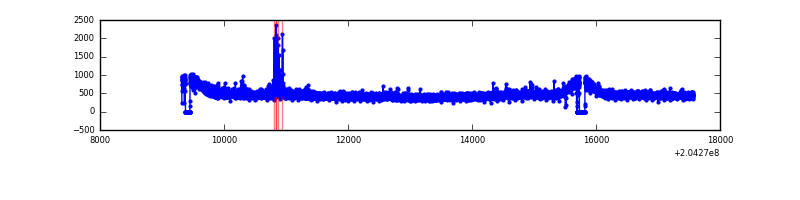 |
| D | 8247 | 8070 | 63 | 63 | 0.76% | 0.78% | 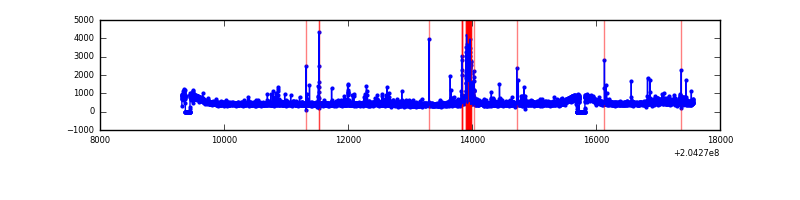 |
Top three noisy pixels from each quadrant. If the there are fewer than three noisy pixels in the level2.evt file, extra rows are filled as -1
| Pixel properties | Quadrant properties | ||||||
|---|---|---|---|---|---|---|---|
| Quadrant | DetID | PixID | Counts | Sigma | Mean | Median | Sigma |
| A | 0 | 118 | 224130 | 1108.11 | 970 | 945 | 201.4 |
| A | 0 | 50 | 94196 | 462.99 | 970 | 945 | 201.4 |
| A | 15 | 236 | 71987 | 352.72 | 970 | 945 | 201.4 |
| B | 15 | 204 | 253152 | 1333.48 | 978 | 954 | 189.1 |
| B | 4 | 81 | 93596 | 489.84 | 978 | 954 | 189.1 |
| B | 14 | 167 | 70595 | 368.22 | 978 | 954 | 189.1 |
| C | 9 | 144 | 84797 | 376.89 | 950 | 951 | 222.5 |
| C | 8 | 128 | 21921 | 94.26 | 950 | 951 | 222.5 |
| C | 8 | 112 | 9298 | 37.52 | 950 | 951 | 222.5 |
| D | 2 | 232 | 211660 | 911.01 | 945 | 911 | 231.3 |
| D | 2 | 63 | 105587 | 452.48 | 945 | 911 | 231.3 |
| D | 13 | 239 | 47213 | 200.15 | 945 | 911 | 231.3 |
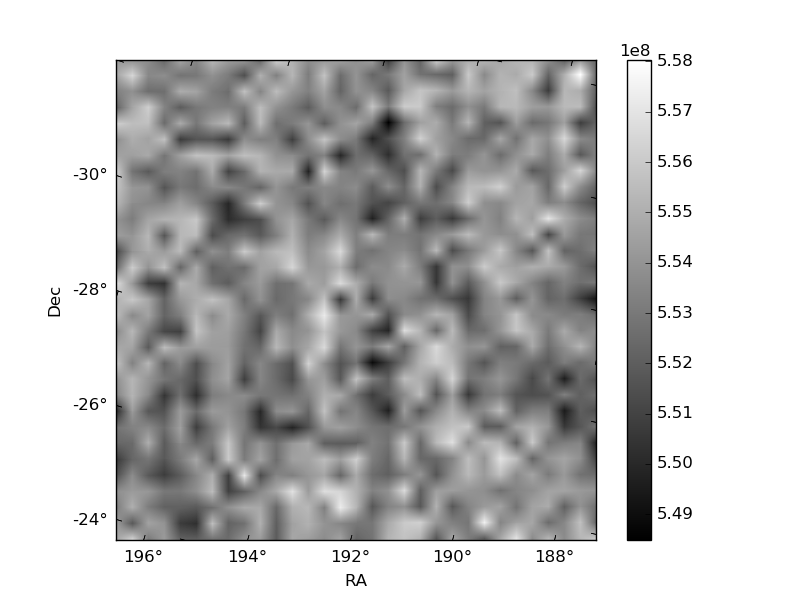
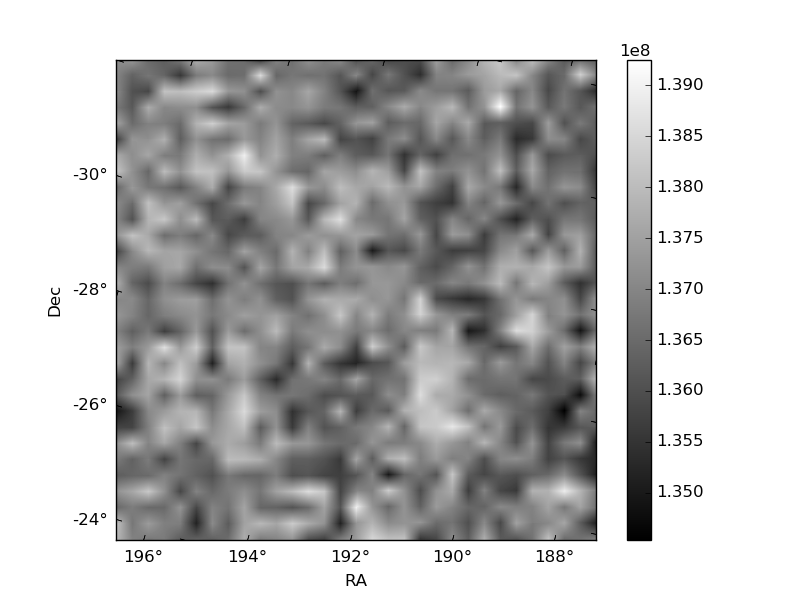
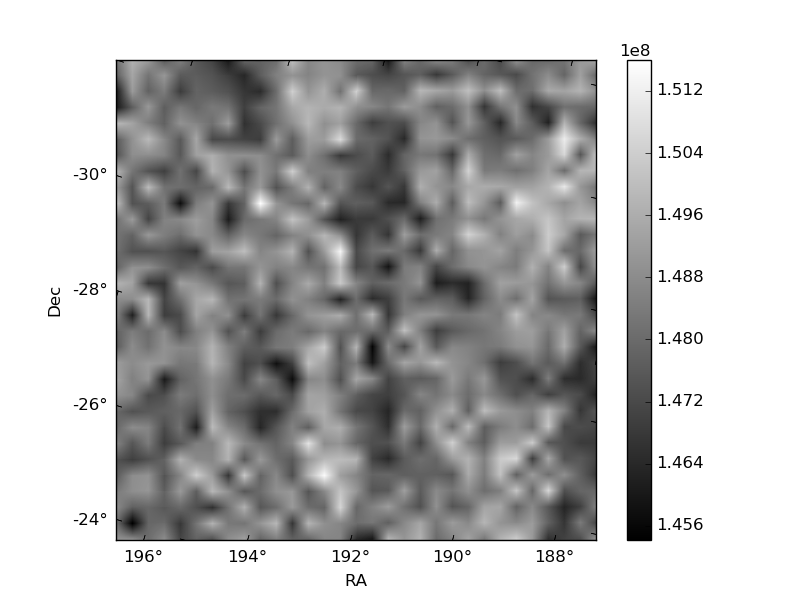
Histogram calculated using DETX and DETY for each event in the final _common_clean file
| Quadrant A | 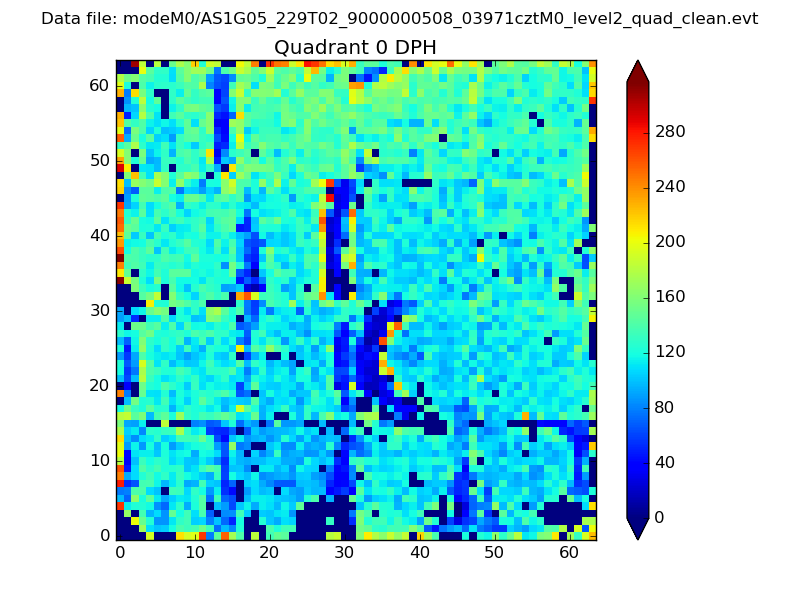 |
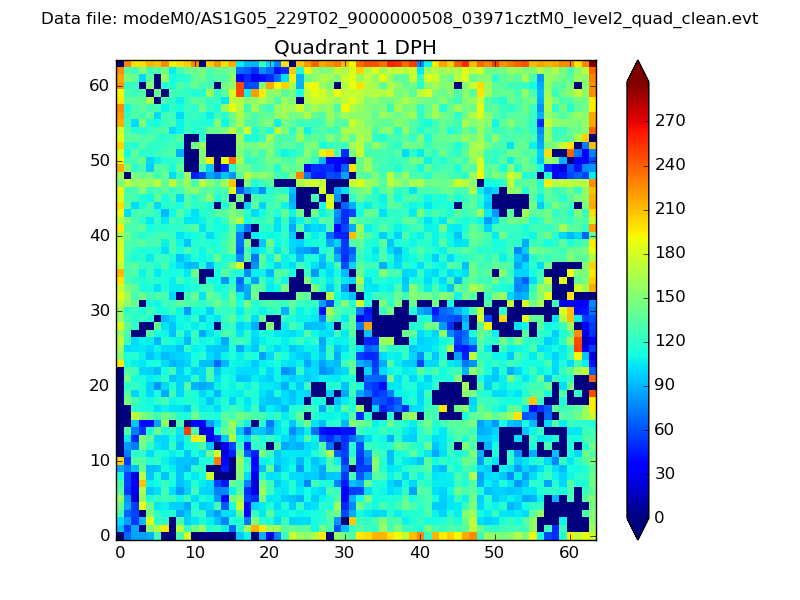 |
Quadrant B |
|---|---|---|---|
| Quadrant D | 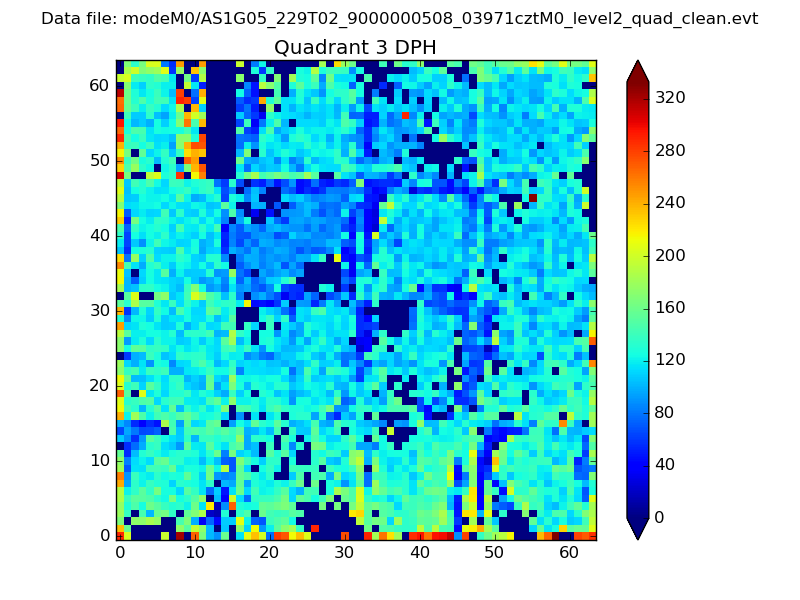 |
 |
Quadrant C |
| Plot type | Count rate plots | Images |
|---|---|---|
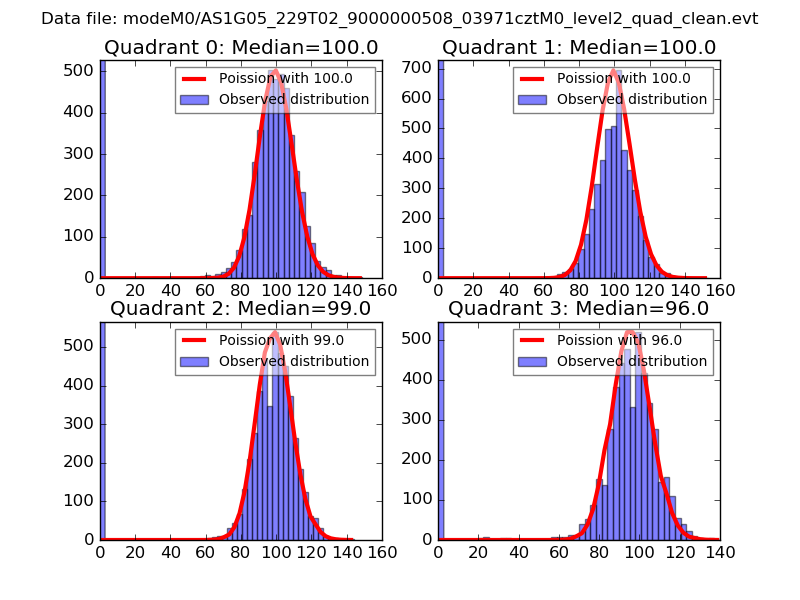
| Comparison with Poisson distribution Blue bars denote a histogram of data divided into 1 sec bins. Red curve is a Poisson curve with rate = median count rate of data. |
 |
 |
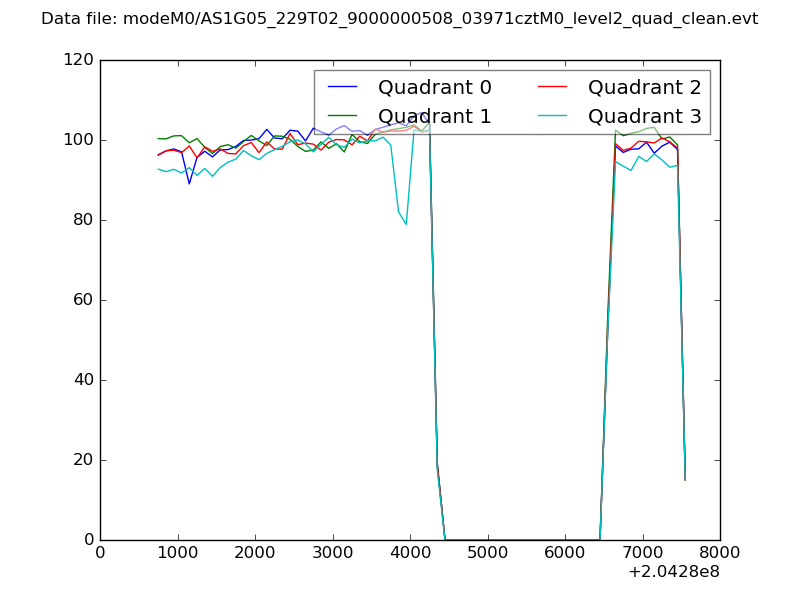
| Quadrant-wise count rates Data is divided into 100 sec bins |
 |
|
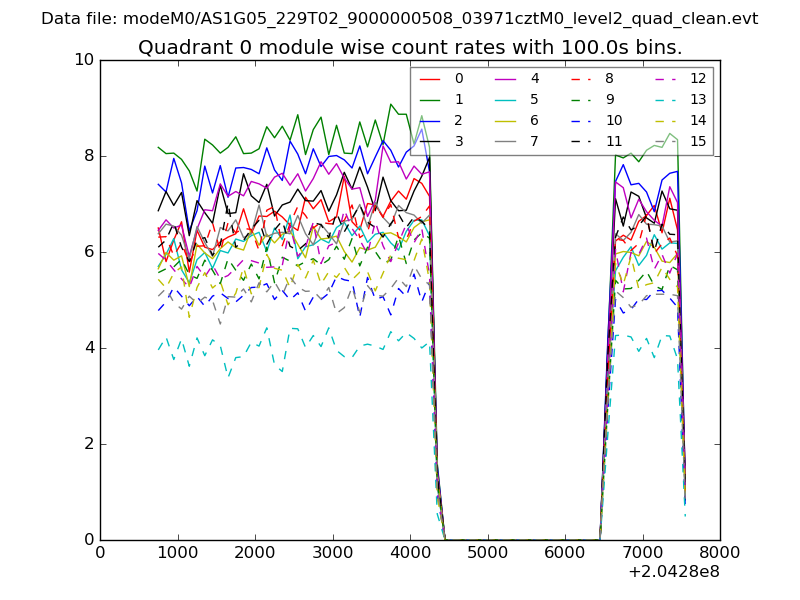
| Module-wise count rates for Quadrant A Data is divided into 100 sec bins |
 |
 |
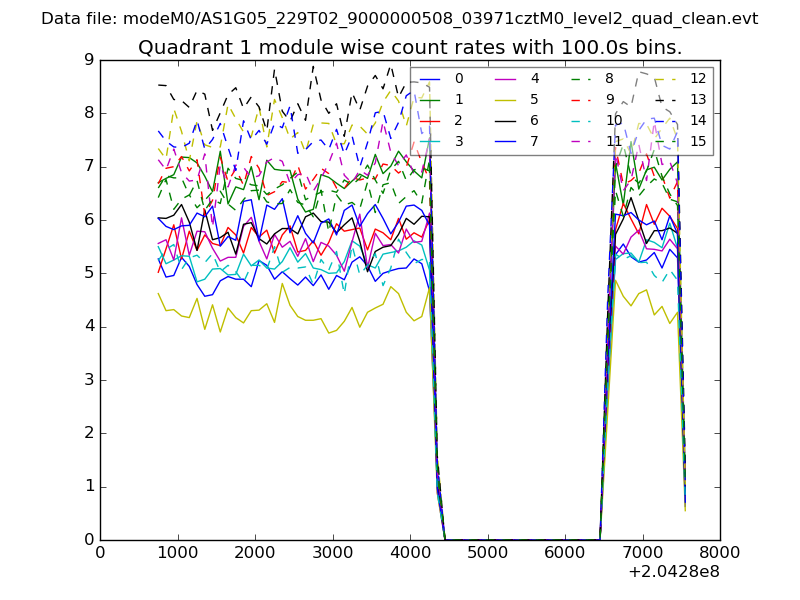
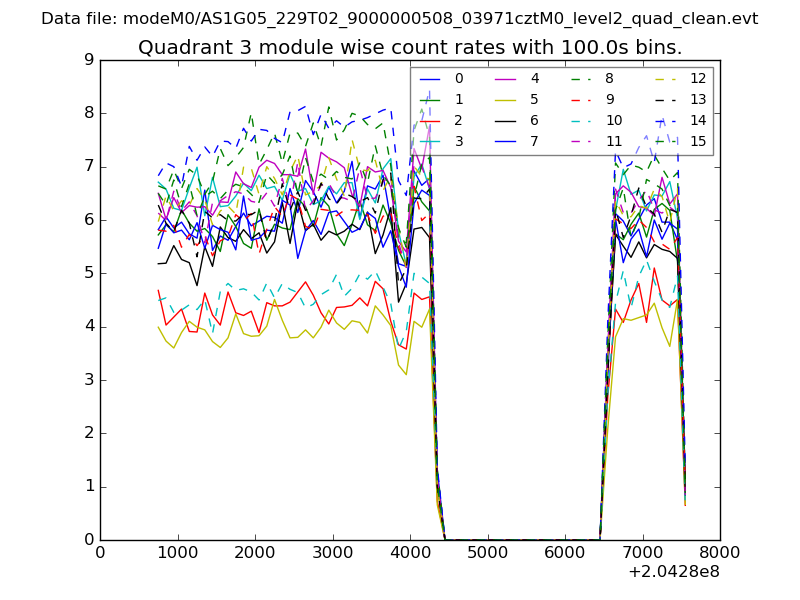
| Module-wise count rates for Quadrant B Data is divided into 100 sec bins |
 |
 |
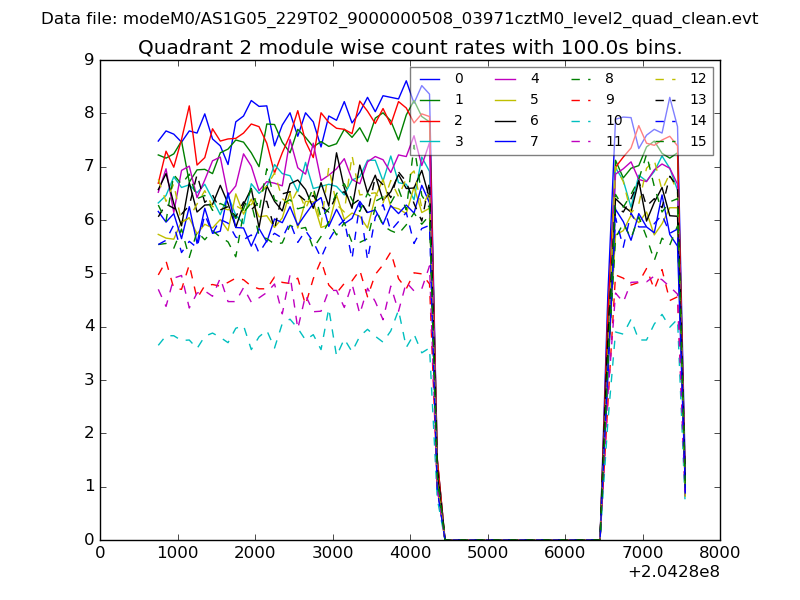
| Module-wise count rates for Quadrant C Data is divided into 100 sec bins |
 |
 |
| Module-wise count rates for Quadrant D Data is divided into 100 sec bins |
 |
 |
| Parameter | Plot |
|---|---|
| CZT HV Monitor | 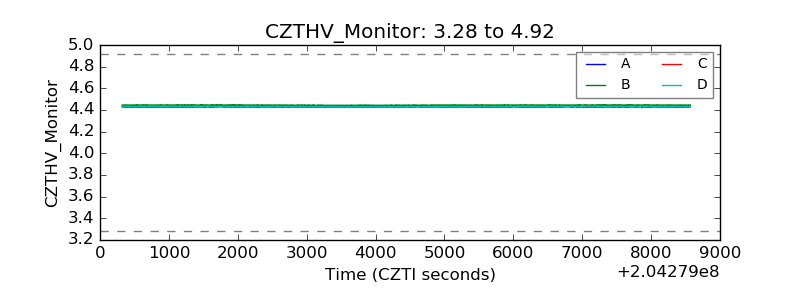 |
| D_VDD | 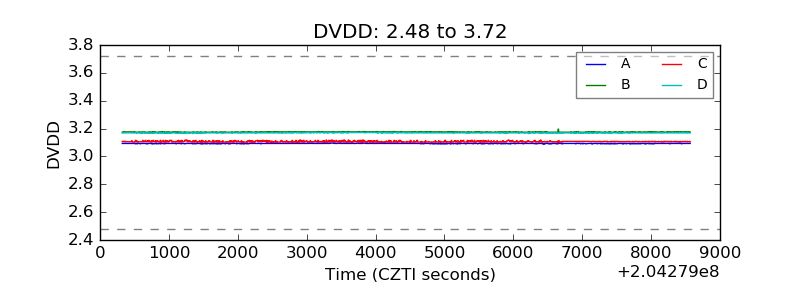 |
| Temperature 1 | 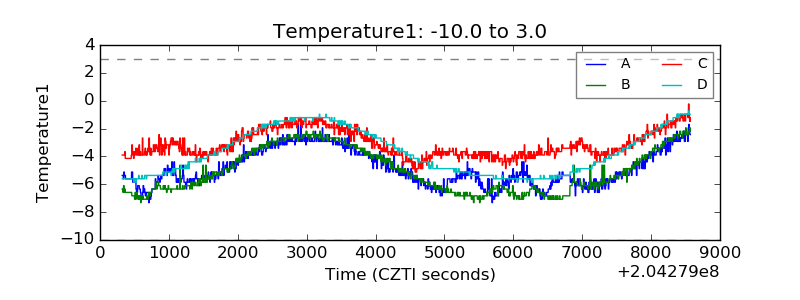 |
| Veto HV Monitor | 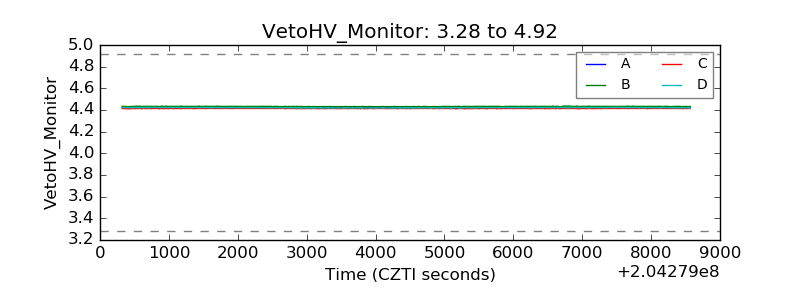 |
| Veto LLD | 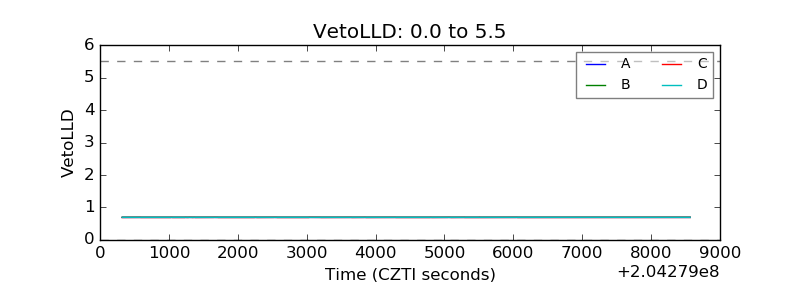 |
| Alpha Counter | 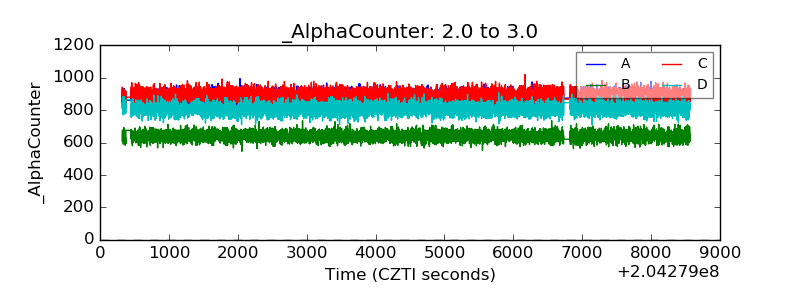 |
| _CPM_Rate | 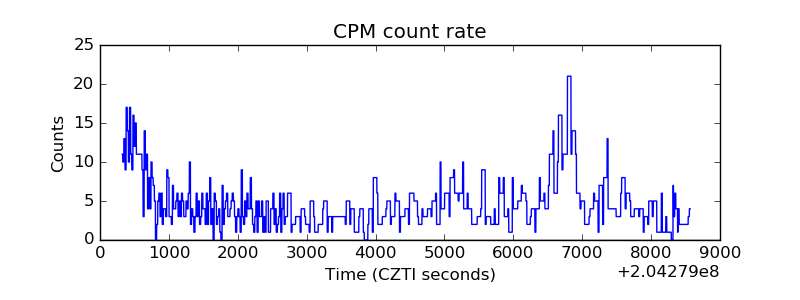 |
| CZT Counter | 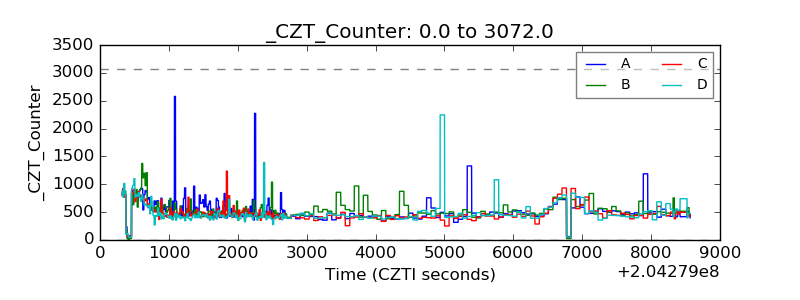 |
| +2.5 Volts monitor |  |
| +5 Volts monitor |  |
| _ROLL_ROT | 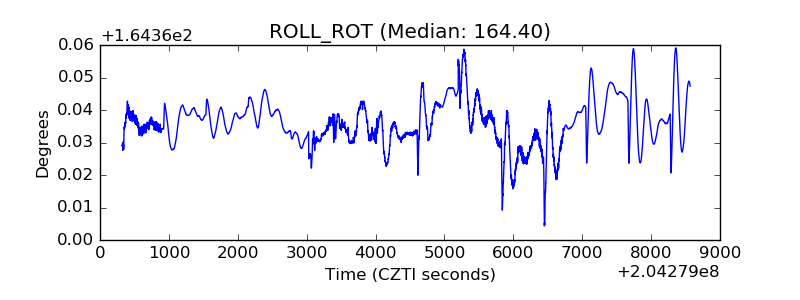 |
| _Roll_DEC | 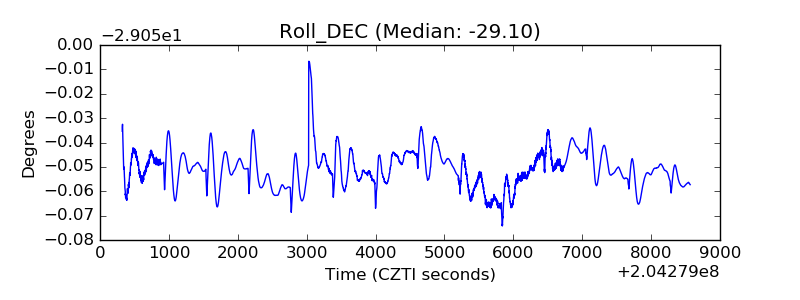 |
| _Roll_RA |  |
| Veto Counter | 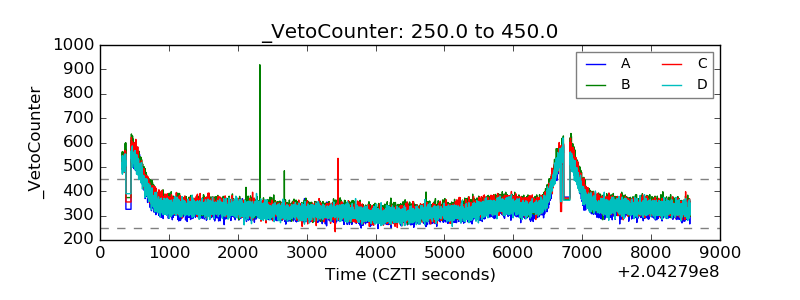 |