| Param | Original file | Final file |
|---|---|---|
| Filename | modeM0/AS1G05_229T02_9000000508_03974cztM0_level2.evt | modeM0/AS1G05_229T02_9000000508_03974cztM0_level2_quad_clean.evt |
| Size (bytes) | 195,984,000 | 45,077,760 |
| Size | 186.9 MB | 43.0 MB |
| Events in quadrant A | 1,421,549 | 293,357 |
| Events in quadrant B | 1,640,327 | 290,688 |
| Events in quadrant C | 1,199,392 | 289,775 |
| Events in quadrant D | 1,471,432 | 280,666 |
| Mode SS | |||
|---|---|---|---|
| Quadrant | BADHDUFLAG | Total packets | Discarded packets |
| A | 0 | 60 | 0 |
| B | 0 | 60 | 0 |
| C | 0 | 60 | 0 |
| D | 0 | 60 | 0 |
| Mode M0 | |||
|---|---|---|---|
| Quadrant | BADHDUFLAG | Total packets | Discarded packets |
| A | 0 | 6309 | 0 |
| B | 0 | 6765 | 0 |
| C | 0 | 5896 | 0 |
| D | 0 | 6434 | 0 |
| Quadrant | Total seconds | Saturated seconds | Saturation percentage |
|---|---|---|---|
| A | 2945 | 24 | 0.814941% |
| B | 2945 | 7 | 0.237691% |
| C | 2945 | 2 | 0.067912% |
| D | 2945 | 14 | 0.475382% |
Noise dominated data is calculated using 1-second bins in cleaned event files. If a bin has >2000 counts, and if more than 50% of those come from <1% of pixels, then it is considered to be noise-dominated and hence unusable.
| Quadrant | # 1 sec bins | Bins with >0 counts | Bins with >2000 counts | High rate bins dominated by noise | Noise dominated (total time) | Noise dominated (detector-on time) | Marked lightcurve |
|---|---|---|---|---|---|---|---|
| A | 2945 | 2945 | 16 | 16 | 0.54% | 0.54% | 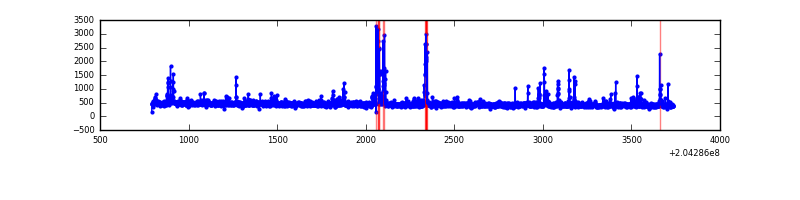 |
| B | 2945 | 2945 | 2 | 2 | 0.07% | 0.07% | 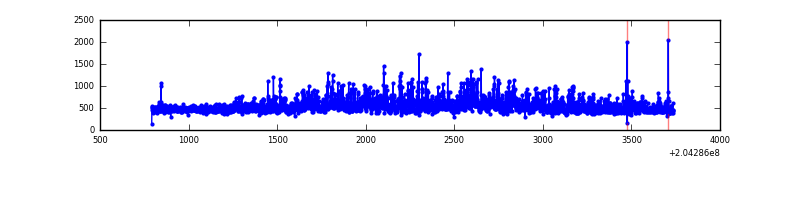 |
| C | 2945 | 2945 | 0 | 0 | 0.00% | 0.00% | 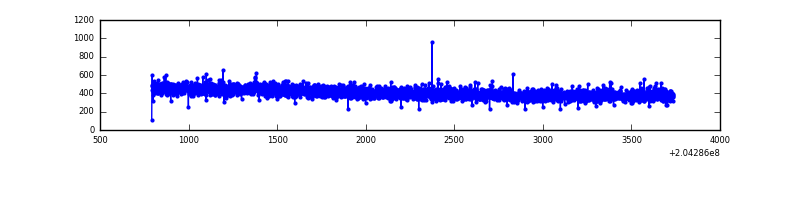 |
| D | 2945 | 2945 | 15 | 15 | 0.51% | 0.51% | 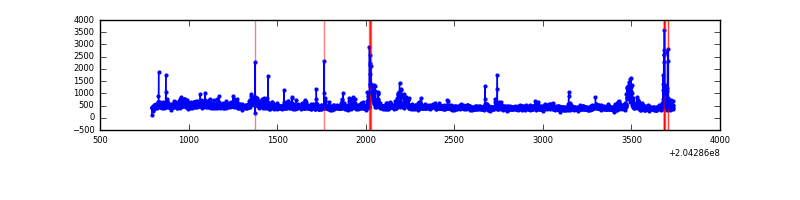 |
Top three noisy pixels from each quadrant. If the there are fewer than three noisy pixels in the level2.evt file, extra rows are filled as -1
| Pixel properties | Quadrant properties | ||||||
|---|---|---|---|---|---|---|---|
| Quadrant | DetID | PixID | Counts | Sigma | Mean | Median | Sigma |
| A | 0 | 118 | 80672 | 1196.44 | 319 | 313 | 67.2 |
| A | 0 | 50 | 74841 | 1109.62 | 319 | 313 | 67.2 |
| A | 15 | 236 | 16355 | 238.84 | 319 | 313 | 67.2 |
| B | 15 | 204 | 295075 | 4602.69 | 320 | 313 | 64.0 |
| B | 3 | 0 | 27614 | 426.3 | 320 | 313 | 64.0 |
| B | 14 | 167 | 18869 | 289.75 | 320 | 313 | 64.0 |
| C | 14 | 67 | 2964 | 36.57 | 305 | 306 | 72.7 |
| C | 13 | 61 | 2505 | 30.25 | 305 | 306 | 72.7 |
| C | 9 | 144 | 2488 | 30.02 | 305 | 306 | 72.7 |
| D | 2 | 232 | 77491 | 1032.15 | 307 | 298 | 74.8 |
| D | 2 | 63 | 74758 | 995.6 | 307 | 298 | 74.8 |
| D | 1 | 7 | 70870 | 943.62 | 307 | 298 | 74.8 |
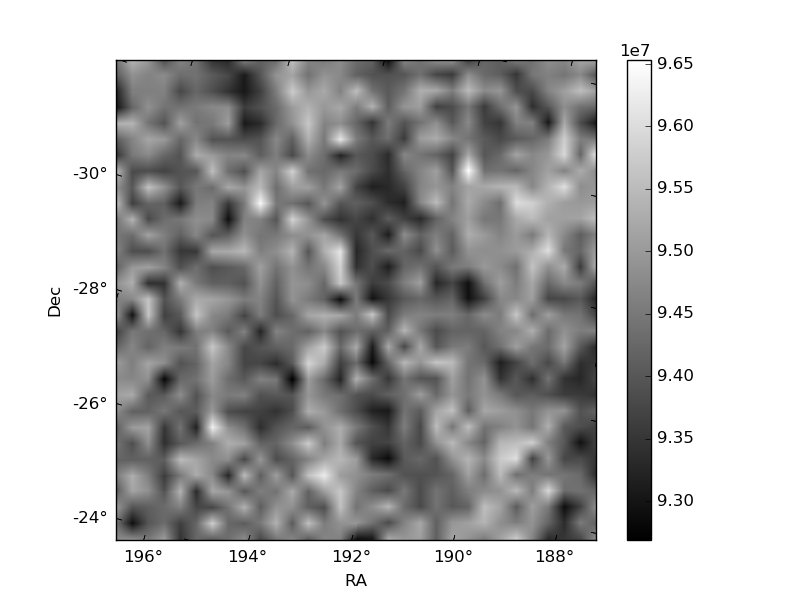
Histogram calculated using DETX and DETY for each event in the final _common_clean file
| Quadrant A | 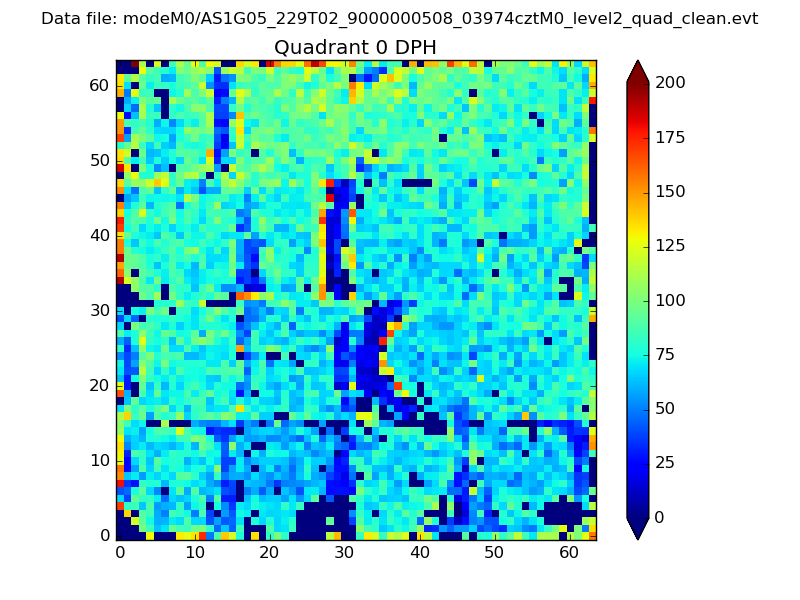 |
 |
Quadrant B |
|---|---|---|---|
| Quadrant D |  |
 |
Quadrant C |
| Plot type | Count rate plots | Images |
|---|---|---|
| Comparison with Poisson distribution Blue bars denote a histogram of data divided into 1 sec bins. Red curve is a Poisson curve with rate = median count rate of data. |
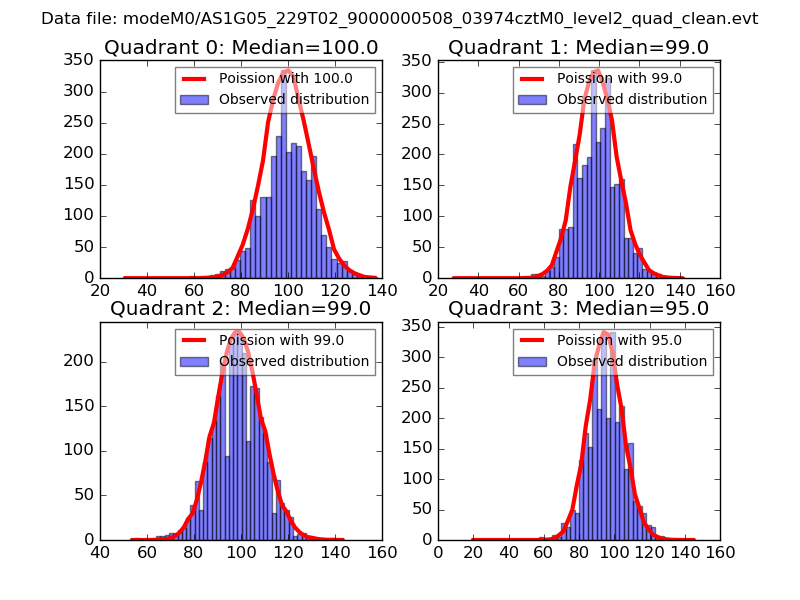 |
 |
| Quadrant-wise count rates Data is divided into 100 sec bins |
 |
|
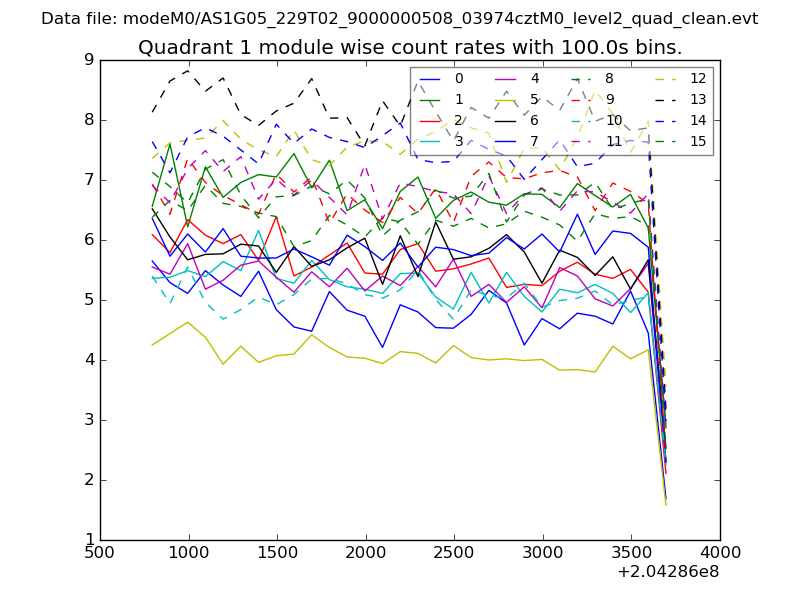
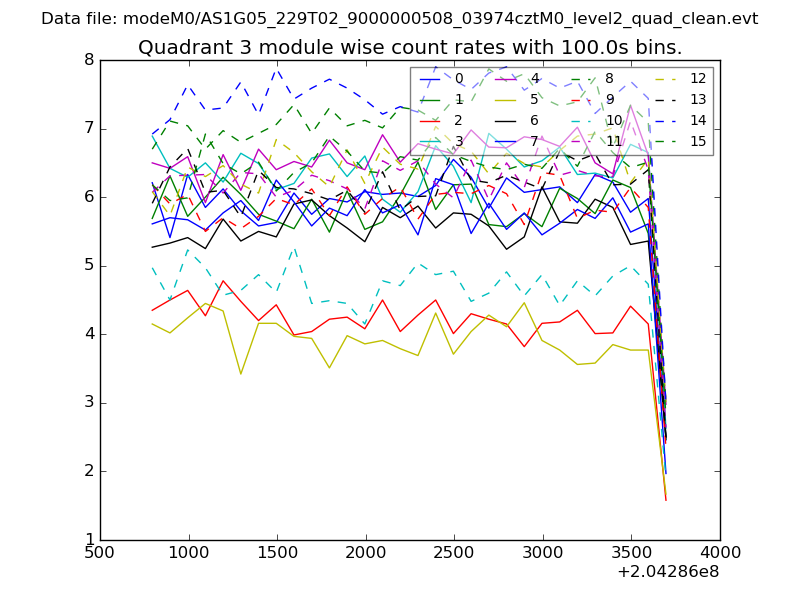
| Module-wise count rates for Quadrant A Data is divided into 100 sec bins |
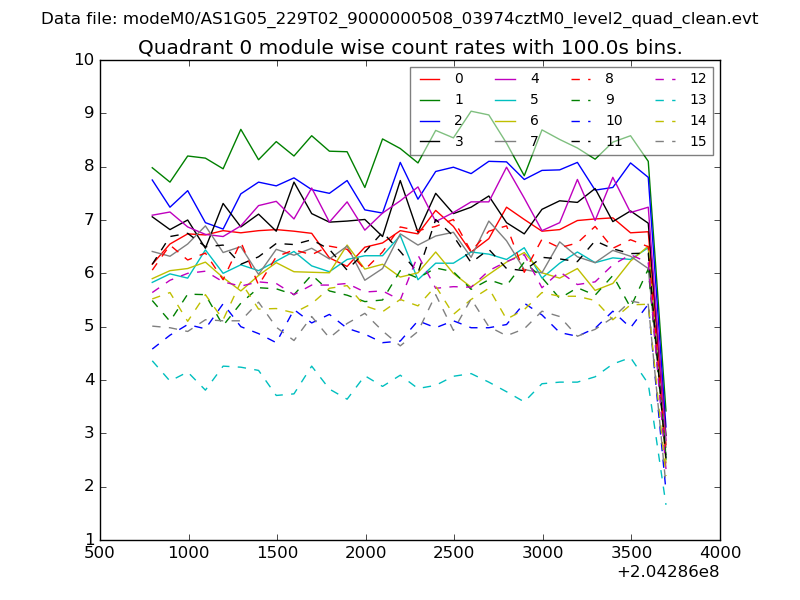 |
 |
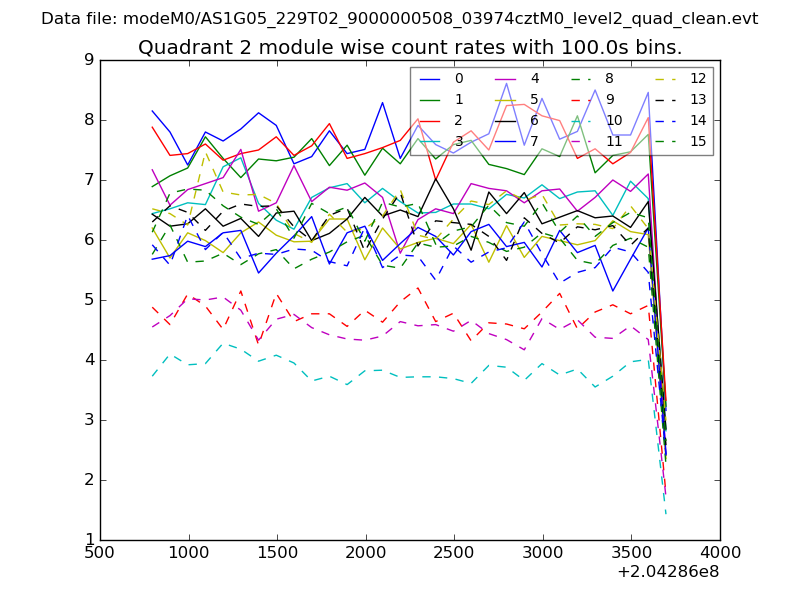
| Module-wise count rates for Quadrant B Data is divided into 100 sec bins |
 |
 |
| Module-wise count rates for Quadrant C Data is divided into 100 sec bins |
 |
 |
| Module-wise count rates for Quadrant D Data is divided into 100 sec bins |
 |
 |
| Parameter | Plot |
|---|---|
| CZT HV Monitor | 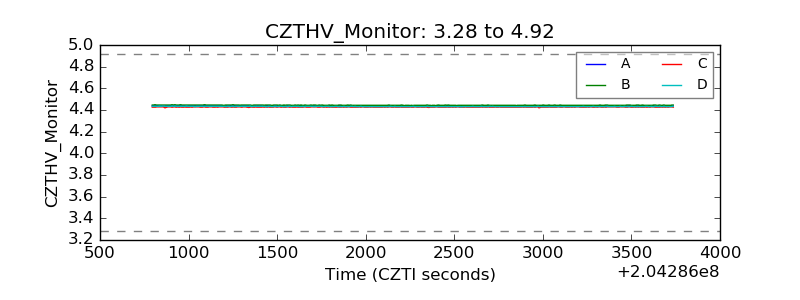 |
| D_VDD | 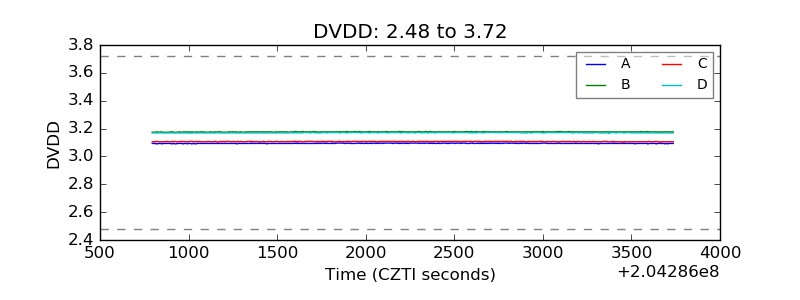 |
| Temperature 1 | 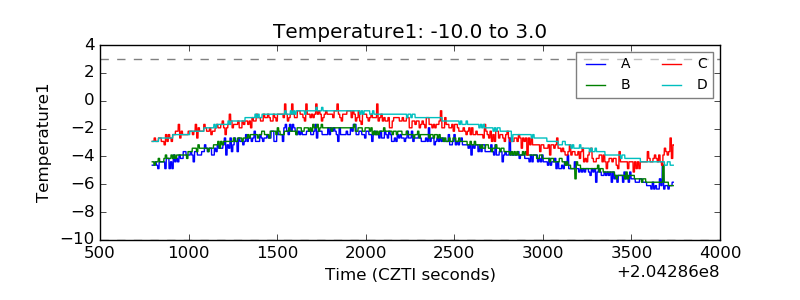 |
| Veto HV Monitor | 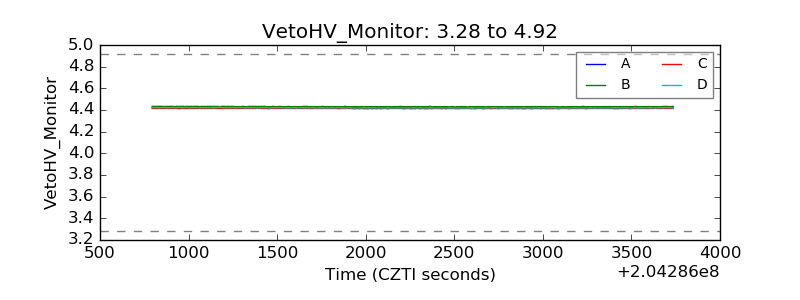 |
| Veto LLD | 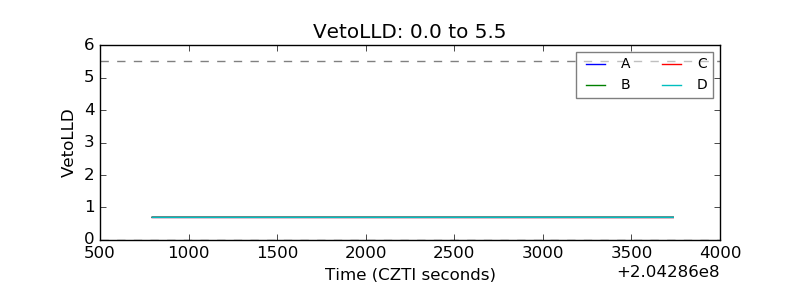 |
| Alpha Counter | 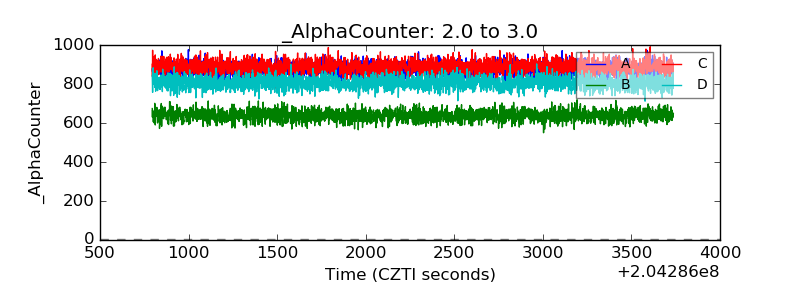 |
| _CPM_Rate | 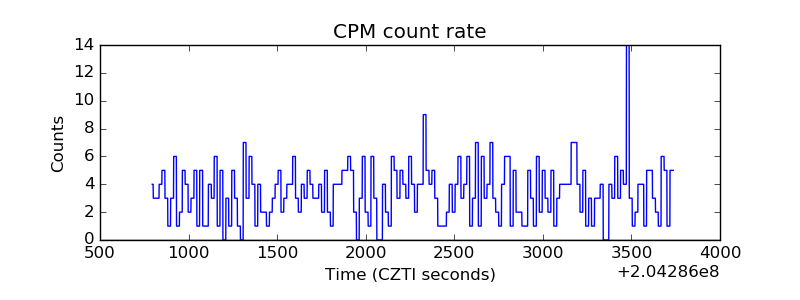 |
| CZT Counter | 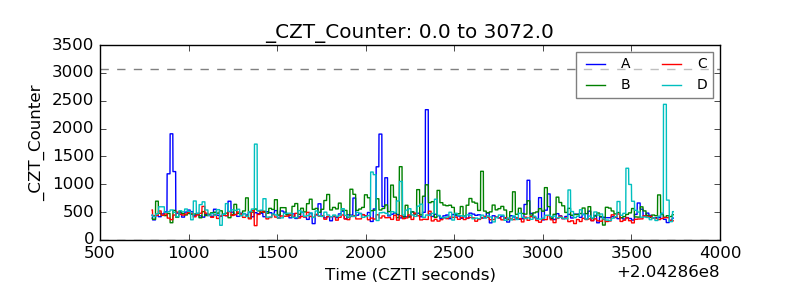 |
| +2.5 Volts monitor |  |
| +5 Volts monitor |  |
| _ROLL_ROT | 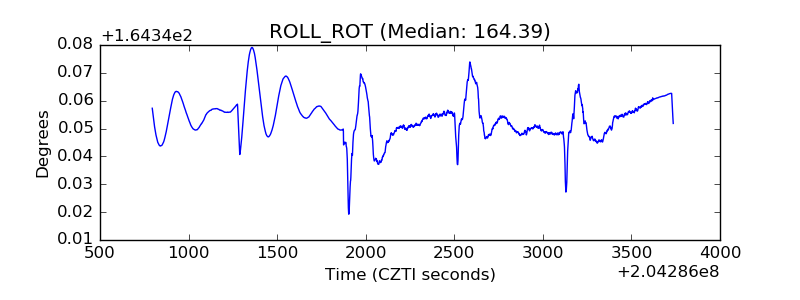 |
| _Roll_DEC | 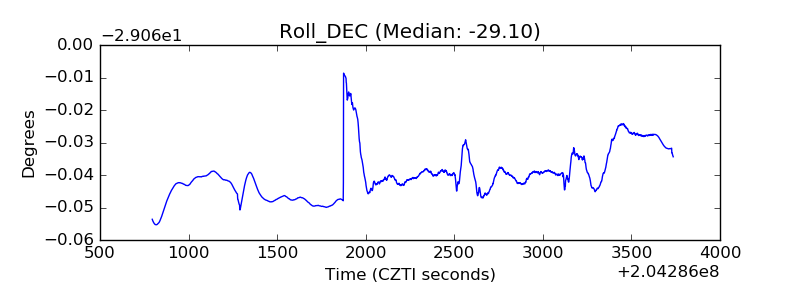 |
| _Roll_RA | 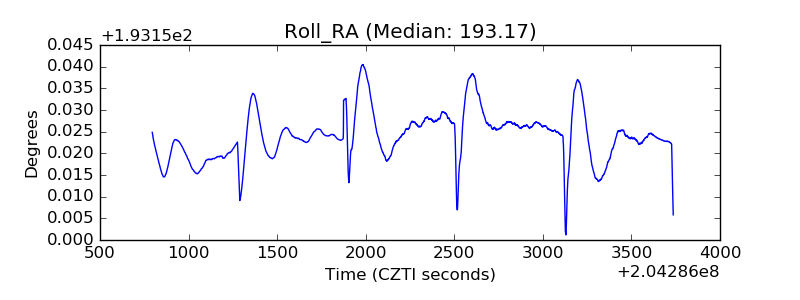 |
| Veto Counter | 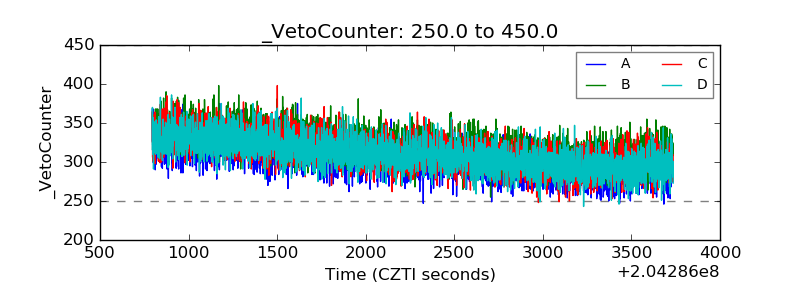 |