| Param | Original file | Final file |
|---|---|---|
| Filename | modeM0/AS1G05_170T01_9000000510cztM0_level2.fits | modeM0/AS1G05_170T01_9000000510cztM0_level2_quad_clean.evt |
| Size (bytes) | 133,485,120 | 153,504,000 |
| Size | 127.3 MB | 146.4 MB |
| Events in quadrant A | 781,928 | 946,076 |
| Events in quadrant B | 752,678 | 919,057 |
| Events in quadrant C | 782,078 | 898,942 |
| Events in quadrant D | 671,682 | 830,871 |
| Mode SS | |||
|---|---|---|---|
| Quadrant | BADHDUFLAG | Total packets | Discarded packets |
| A | 0 | 310 | 0 |
| B | 0 | 310 | 0 |
| C | 0 | 310 | 0 |
| D | 0 | 310 | 0 |
| Mode M9 | |||
|---|---|---|---|
| Quadrant | BADHDUFLAG | Total packets | Discarded packets |
| A | 0 | 18 | 0 |
| B | 0 | 18 | 0 |
| C | 0 | 18 | 0 |
| D | 0 | 18 | 0 |
| Mode M0 | |||
|---|---|---|---|
| Quadrant | BADHDUFLAG | Total packets | Discarded packets |
| A | 0 | 35515 | 0 |
| B | 0 | 40090 | 0 |
| C | 0 | 32050 | 0 |
| D | 0 | 34804 | 0 |
| Quadrant | Total seconds | Saturated seconds | Saturation percentage |
|---|---|---|---|
| A | 15275 | 740 | 4.844517% |
| B | 15269 | 857 | 5.612679% |
| C | 15272 | 185 | 1.211367% |
| D | 15271 | 486 | 3.182503% |
Noise dominated data is calculated using 1-second bins in cleaned event files. If a bin has >2000 counts, and if more than 50% of those come from <1% of pixels, then it is considered to be noise-dominated and hence unusable.
| Quadrant | # 1 sec bins | Bins with >0 counts | Bins with >2000 counts | High rate bins dominated by noise | Noise dominated (total time) | Noise dominated (detector-on time) | Marked lightcurve |
|---|---|---|---|---|---|---|---|
| A | 17016 | 15274 | 0 | 0 | 0.00% | 0.00% | 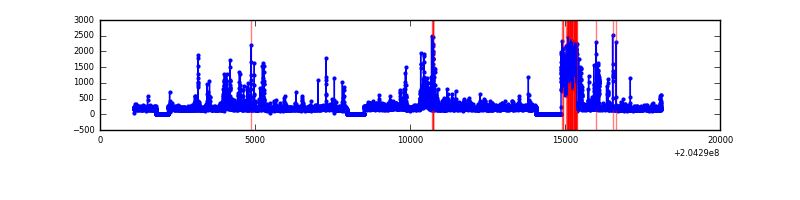 |
| B | 17016 | 15276 | 0 | 0 | 0.00% | 0.00% | 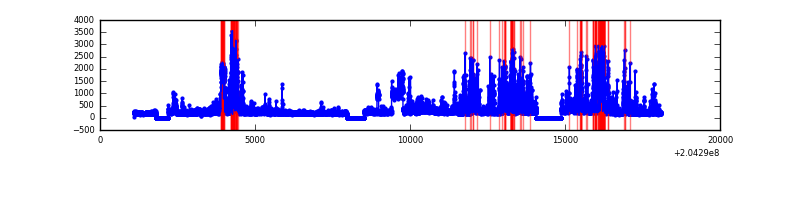 |
| C | 17016 | 15276 | 0 | 0 | 0.00% | 0.00% | 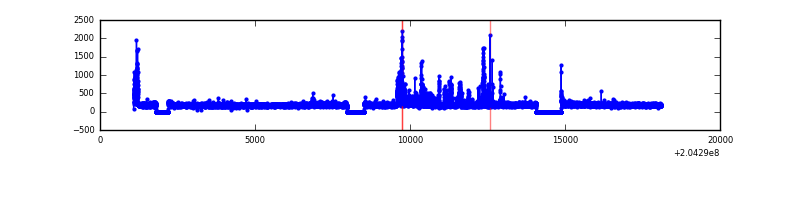 |
| D | 17016 | 15275 | 0 | 0 | 0.00% | 0.00% | 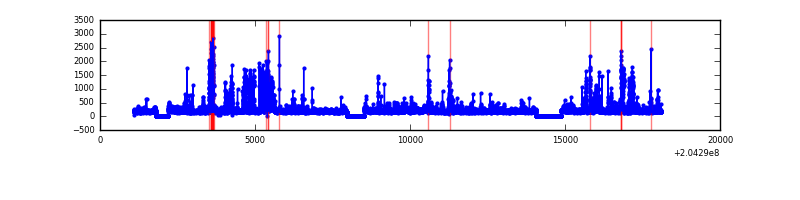 |
Top three noisy pixels from each quadrant. If the there are fewer than three noisy pixels in the level2.evt file, extra rows are filled as -1
| Pixel properties | Quadrant properties | ||||||
|---|---|---|---|---|---|---|---|
| Quadrant | DetID | PixID | Counts | Sigma | Mean | Median | Sigma |
| A | 0 | 29 | 765 | 10.38 | 203 | 189 | 55.5 |
| A | 14 | 188 | 750 | 10.11 | 203 | 189 | 55.5 |
| A | 14 | 204 | 670 | 8.67 | 203 | 189 | 55.5 |
| B | 2 | 9 | 717 | 12.41 | 198 | 188 | 42.6 |
| B | 14 | 254 | 562 | 8.77 | 198 | 188 | 42.6 |
| B | 12 | 226 | 532 | 8.07 | 198 | 188 | 42.6 |
| C | 1 | 80 | 565 | 6.52 | 206 | 190 | 57.5 |
| C | 12 | 241 | 564 | 6.5 | 206 | 190 | 57.5 |
| C | 7 | 111 | 558 | 6.4 | 206 | 190 | 57.5 |
| D | 11 | 82 | 618 | 8.43 | 191 | 173 | 52.8 |
| D | 1 | 19 | 523 | 6.63 | 191 | 173 | 52.8 |
| D | 3 | 31 | 512 | 6.42 | 191 | 173 | 52.8 |
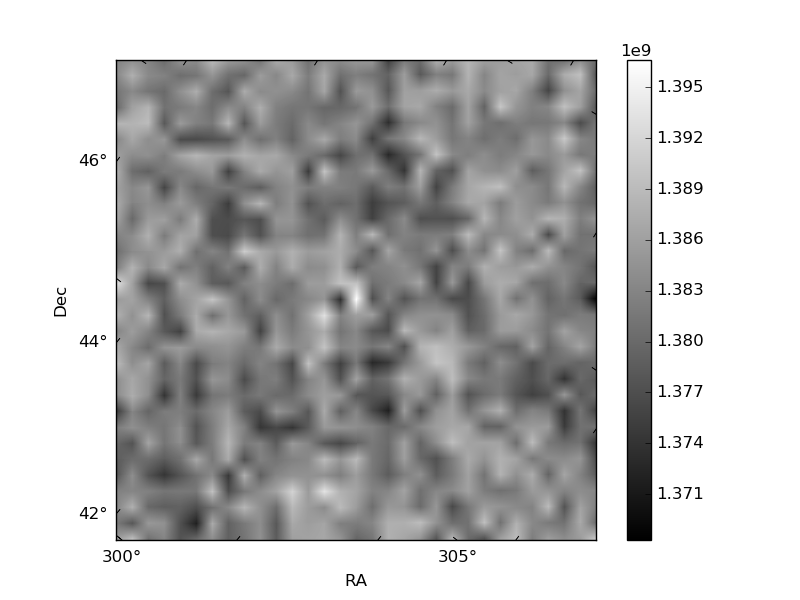
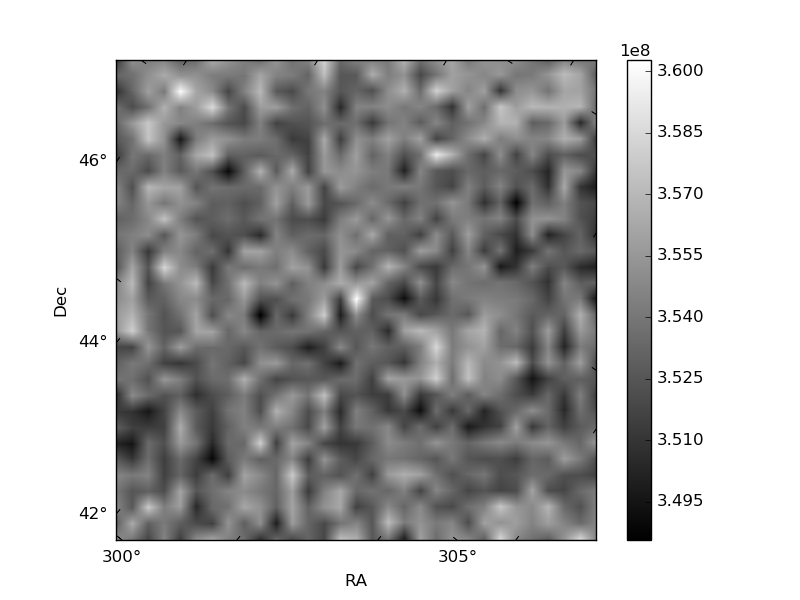
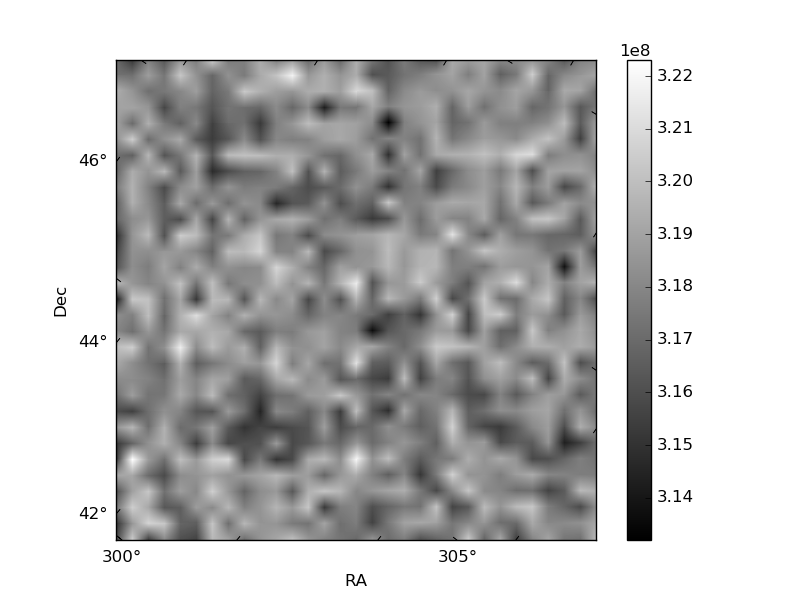
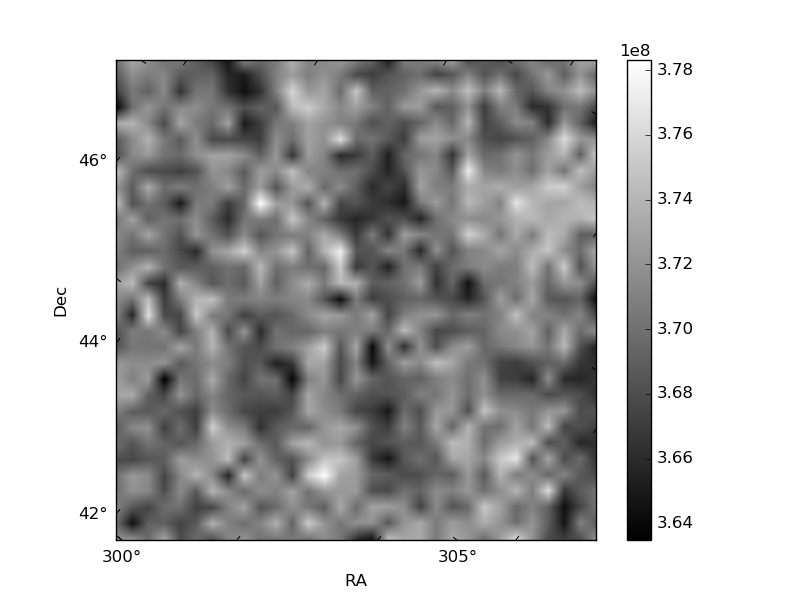
Histogram calculated using DETX and DETY for each event in the final _common_clean file
| Quadrant A | 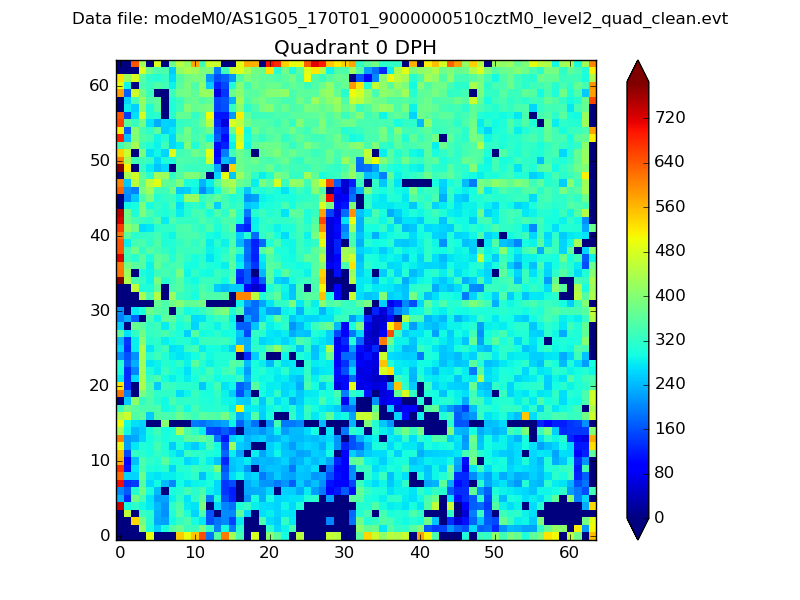 |
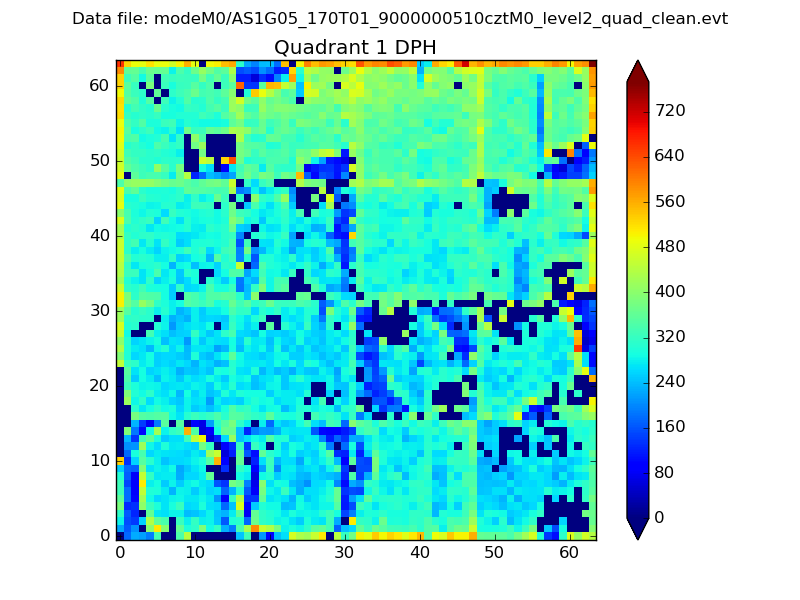 |
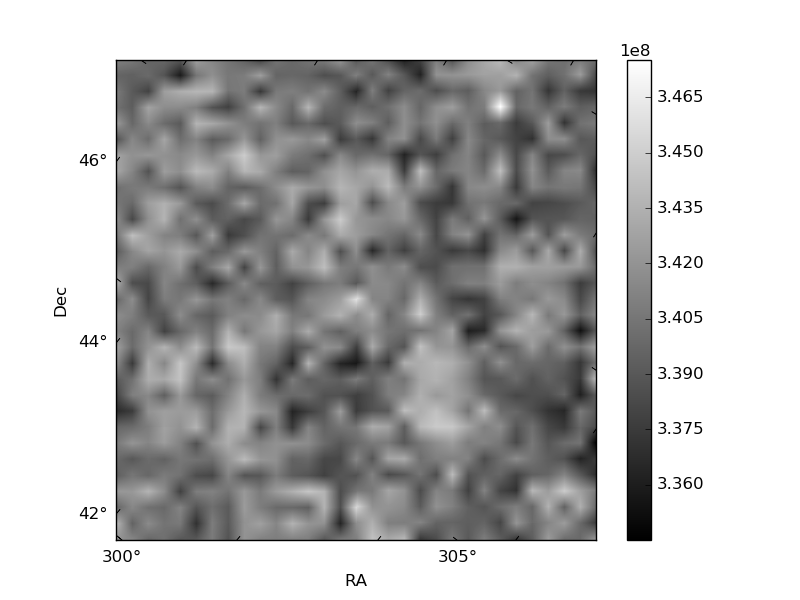
Quadrant B |
|---|---|---|---|
| Quadrant D | 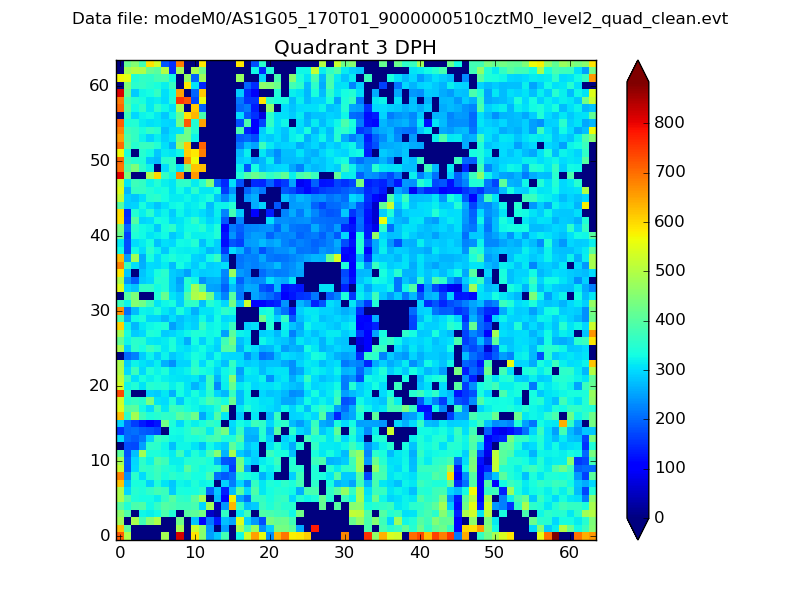 |
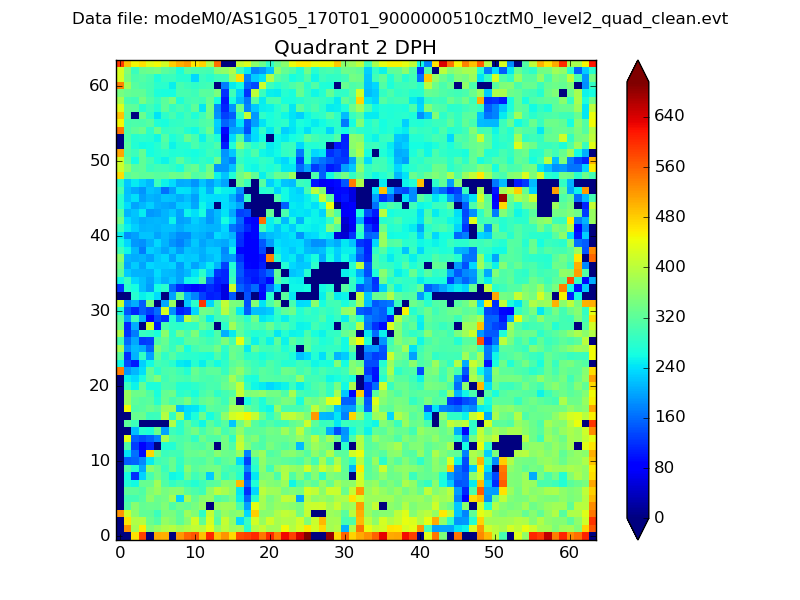 |
Quadrant C |
| Plot type | Count rate plots | Images |
|---|---|---|
| Comparison with Poisson distribution Blue bars denote a histogram of data divided into 1 sec bins. Red curve is a Poisson curve with rate = median count rate of data. |
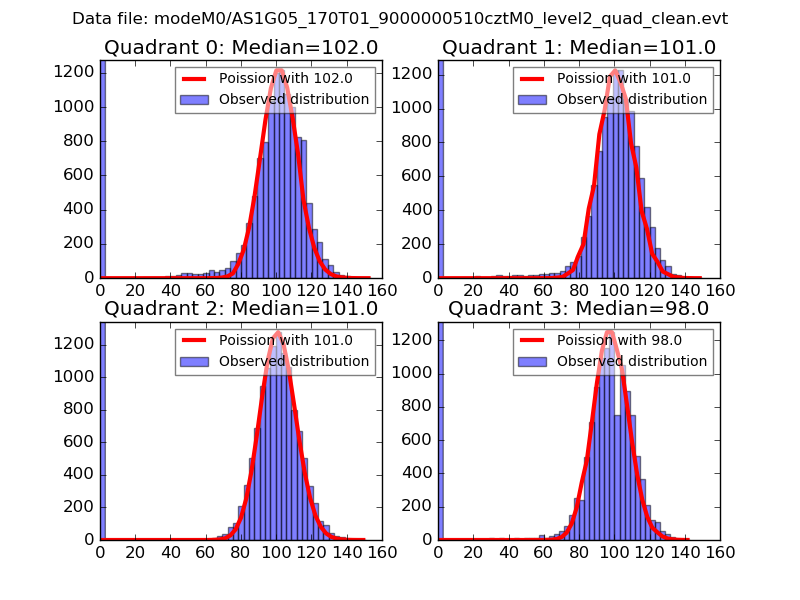 |
 |
| Quadrant-wise count rates Data is divided into 100 sec bins |
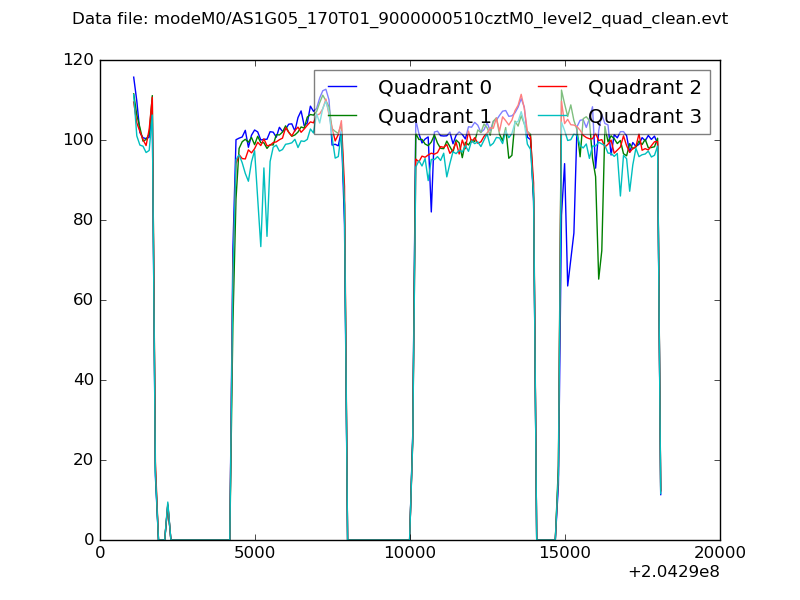 |
|
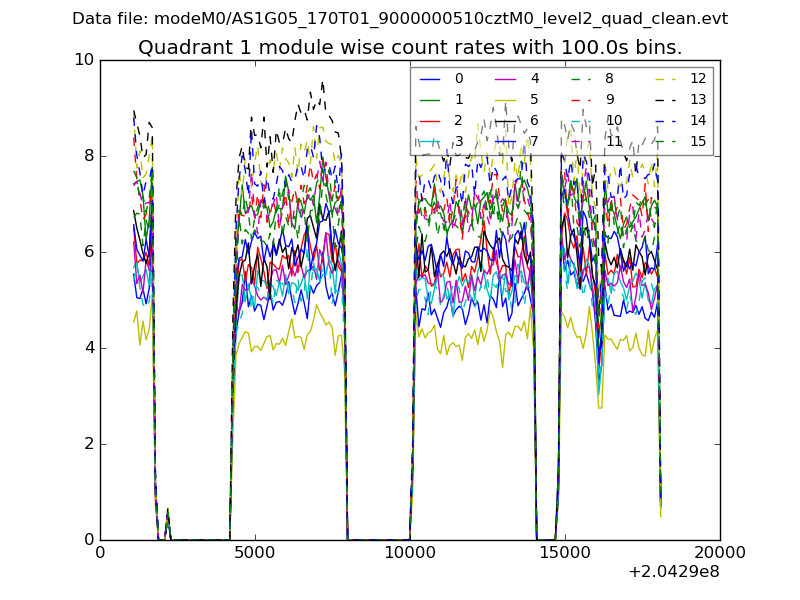
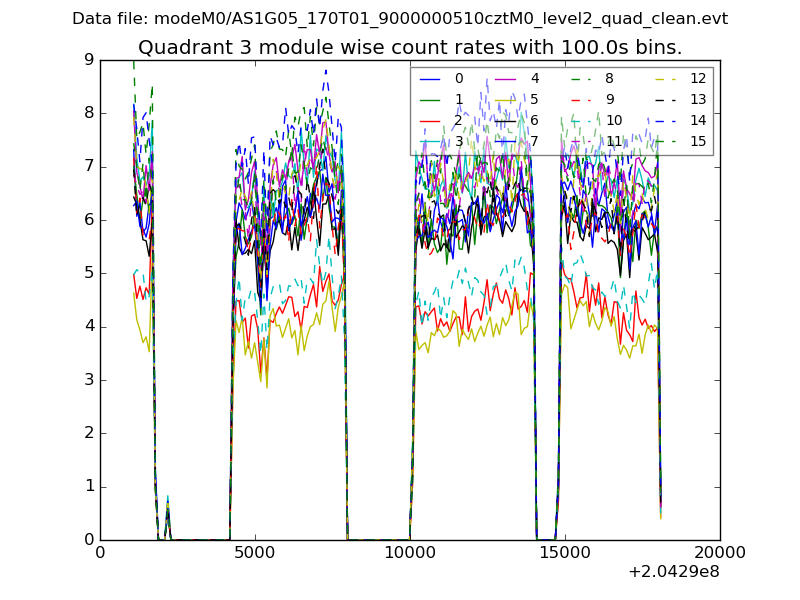
| Module-wise count rates for Quadrant A Data is divided into 100 sec bins |
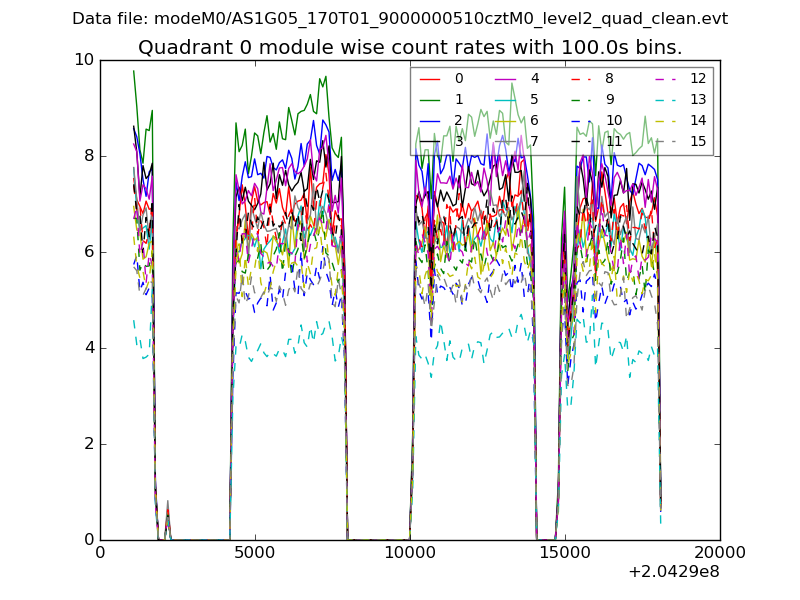 |
 |
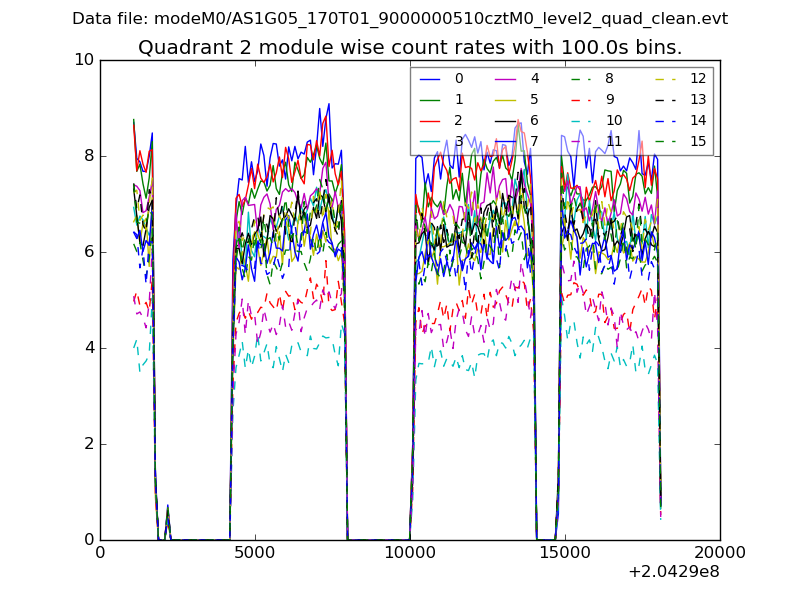
| Module-wise count rates for Quadrant B Data is divided into 100 sec bins |
 |
 |
| Module-wise count rates for Quadrant C Data is divided into 100 sec bins |
 |
 |
| Module-wise count rates for Quadrant D Data is divided into 100 sec bins |
 |
 |
| Parameter | Plot |
|---|---|
| CZT HV Monitor | 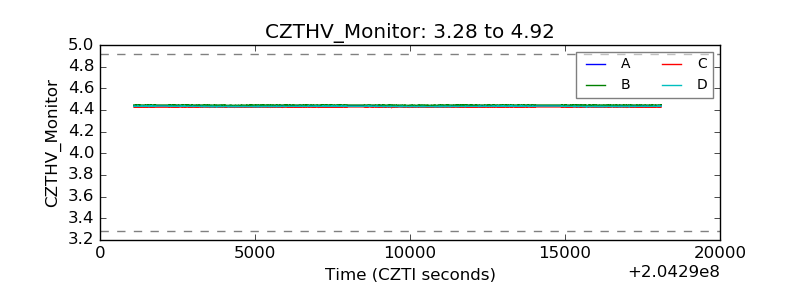 |
| D_VDD | 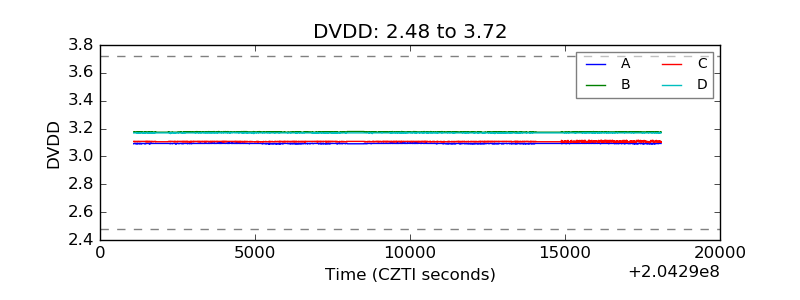 |
| Temperature 1 | 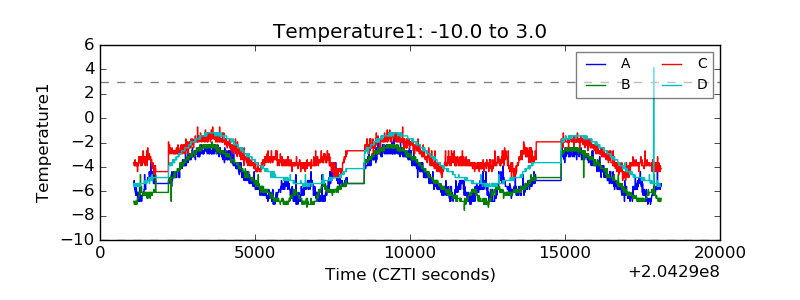 |
| Veto HV Monitor | 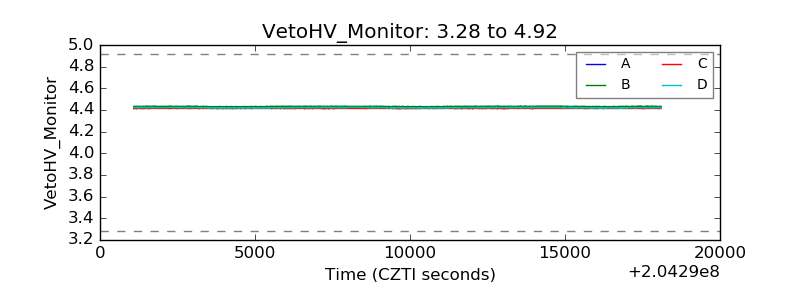 |
| Veto LLD | 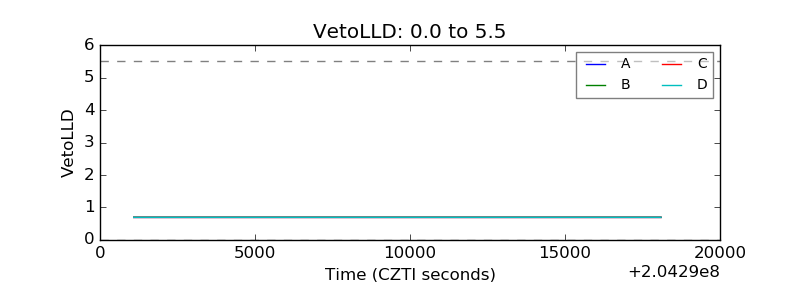 |
| Alpha Counter | 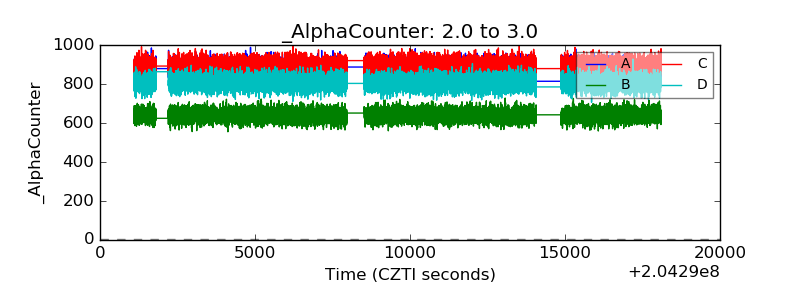 |
| _CPM_Rate | 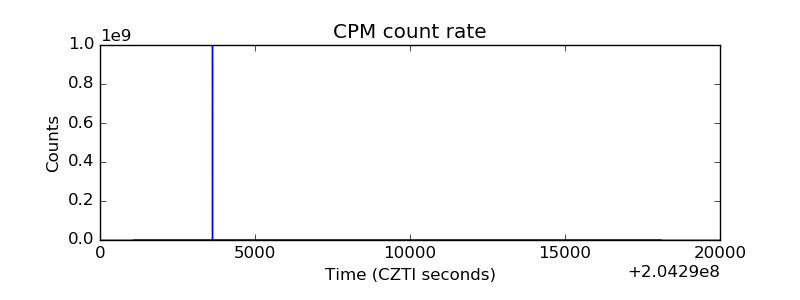 |
| CZT Counter | 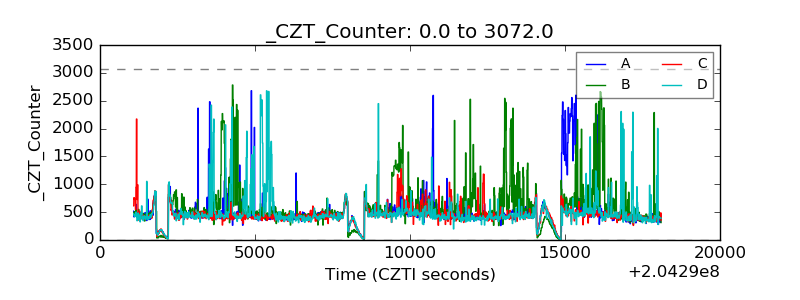 |
| +2.5 Volts monitor | 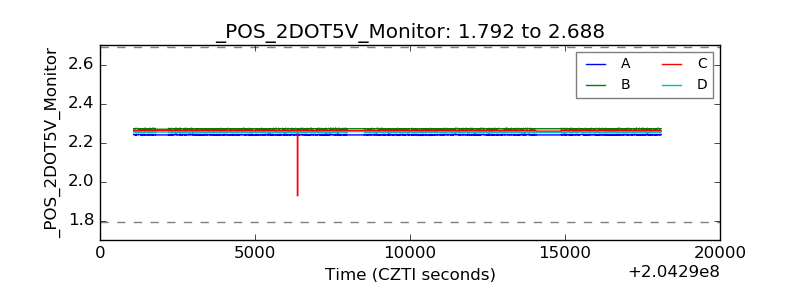 |
| +5 Volts monitor | 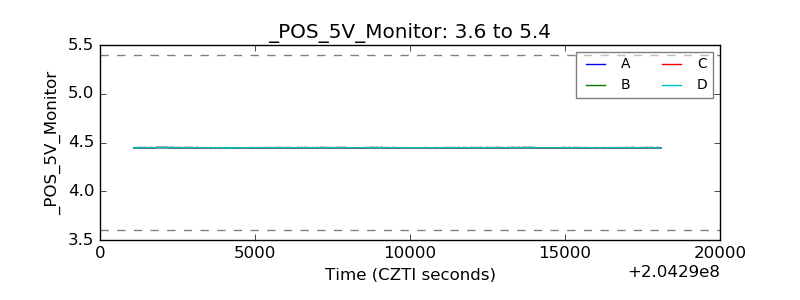 |
| _ROLL_ROT | 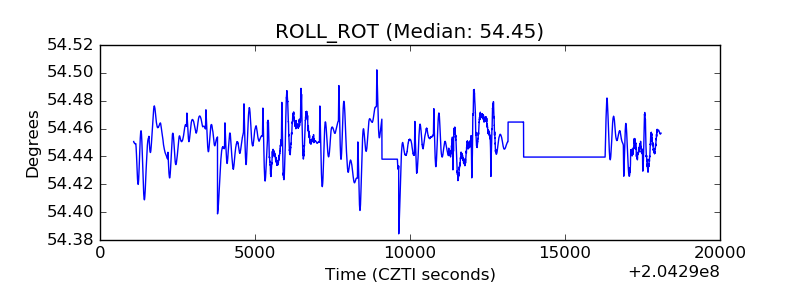 |
| _Roll_DEC | 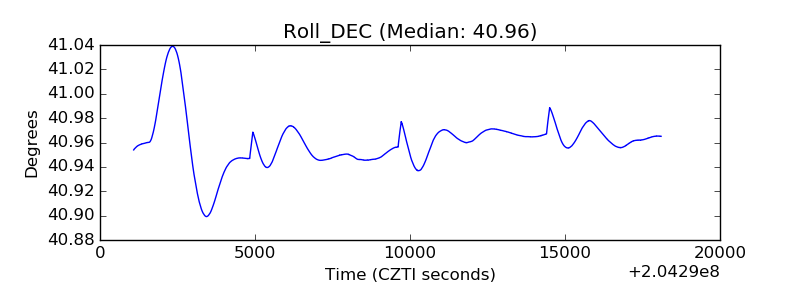 |
| _Roll_RA | 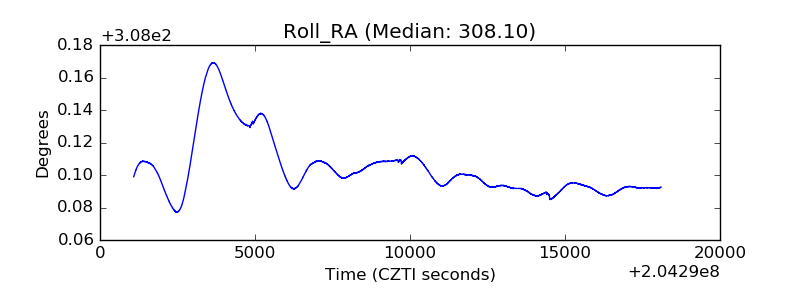 |
| Veto Counter | 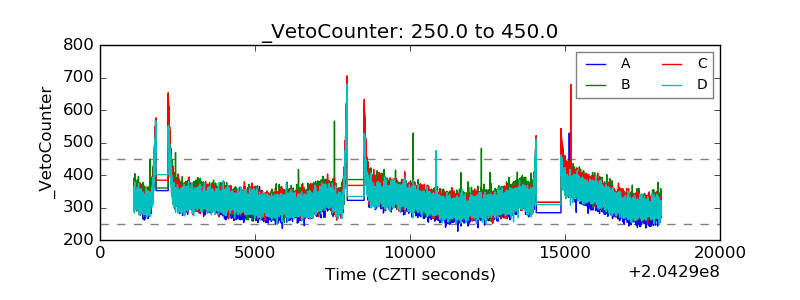 |