| Param | Original file | Final file |
|---|---|---|
| Filename | modeM0/AS1G05_170T01_9000000510_03974cztM0_level2.evt | modeM0/AS1G05_170T01_9000000510_03974cztM0_level2_quad_clean.evt |
| Size (bytes) | 1,025,484,480 | 142,580,160 |
| Size | 978.0 MB | 136.0 MB |
| Events in quadrant A | 7,627,904 | 867,173 |
| Events in quadrant B | 9,166,889 | 845,519 |
| Events in quadrant C | 6,345,591 | 851,081 |
| Events in quadrant D | 7,005,895 | 823,773 |
| Mode SS | |||
|---|---|---|---|
| Quadrant | BADHDUFLAG | Total packets | Discarded packets |
| A | 0 | 274 | 0 |
| B | 0 | 274 | 0 |
| C | 0 | 274 | 0 |
| D | 0 | 274 | 0 |
| Mode M9 | |||
|---|---|---|---|
| Quadrant | BADHDUFLAG | Total packets | Discarded packets |
| A | 0 | 18 | 0 |
| B | 0 | 18 | 0 |
| C | 0 | 18 | 0 |
| D | 0 | 18 | 0 |
| Mode M0 | |||
|---|---|---|---|
| Quadrant | BADHDUFLAG | Total packets | Discarded packets |
| A | 0 | 31801 | 5 |
| B | 0 | 36035 | 44 |
| C | 0 | 28444 | 10 |
| D | 0 | 30534 | 14 |
| Quadrant | Total seconds | Saturated seconds | Saturation percentage |
|---|---|---|---|
| A | 13467 | 731 | 5.428083% |
| B | 13461 | 840 | 6.240250% |
| C | 13464 | 185 | 1.374034% |
| D | 13463 | 424 | 3.149372% |
Noise dominated data is calculated using 1-second bins in cleaned event files. If a bin has >2000 counts, and if more than 50% of those come from <1% of pixels, then it is considered to be noise-dominated and hence unusable.
| Quadrant | # 1 sec bins | Bins with >0 counts | Bins with >2000 counts | High rate bins dominated by noise | Noise dominated (total time) | Noise dominated (detector-on time) | Marked lightcurve |
|---|---|---|---|---|---|---|---|
| A | 15208 | 13471 | 321 | 321 | 2.11% | 2.38% | 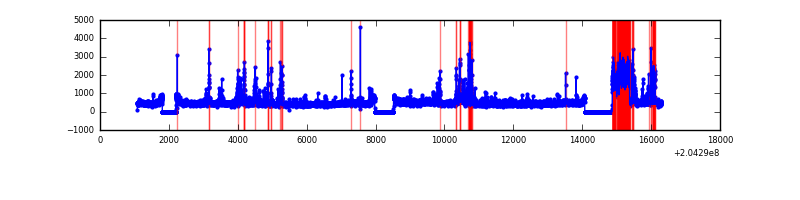 |
| B | 15208 | 13471 | 417 | 417 | 2.74% | 3.10% | 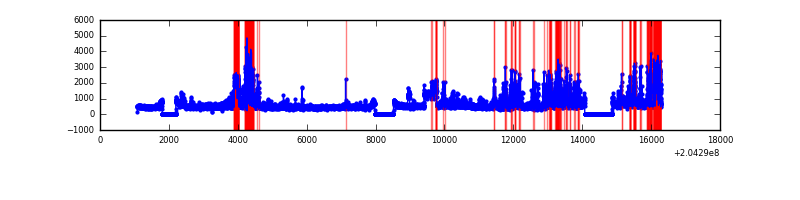 |
| C | 15208 | 13471 | 10 | 10 | 0.07% | 0.07% | 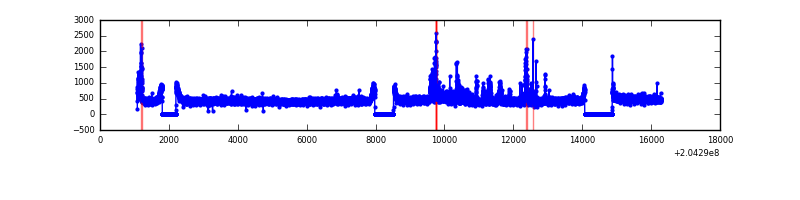 |
| D | 15208 | 13470 | 191 | 191 | 1.26% | 1.42% | 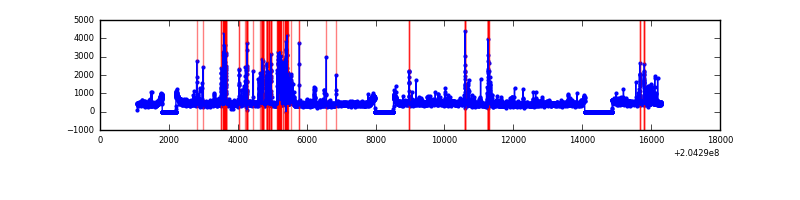 |
Top three noisy pixels from each quadrant. If the there are fewer than three noisy pixels in the level2.evt file, extra rows are filled as -1
| Pixel properties | Quadrant properties | ||||||
|---|---|---|---|---|---|---|---|
| Quadrant | DetID | PixID | Counts | Sigma | Mean | Median | Sigma |
| A | 15 | 236 | 900174 | 2817.65 | 1550 | 1517 | 318.9 |
| A | 0 | 50 | 471996 | 1475.14 | 1550 | 1517 | 318.9 |
| A | 0 | 118 | 127810 | 395.98 | 1550 | 1517 | 318.9 |
| B | 14 | 167 | 1792694 | 5954.89 | 1561 | 1526 | 300.8 |
| B | 3 | 0 | 760733 | 2524.05 | 1561 | 1526 | 300.8 |
| B | 15 | 204 | 322233 | 1066.22 | 1561 | 1526 | 300.8 |
| C | 9 | 144 | 409015 | 1145.34 | 1515 | 1518 | 355.8 |
| C | 13 | 61 | 12746 | 31.56 | 1515 | 1518 | 355.8 |
| C | 8 | 128 | 7643 | 17.22 | 1515 | 1518 | 355.8 |
| D | 2 | 232 | 925883 | 2533.45 | 1506 | 1457 | 364.9 |
| D | 2 | 32 | 107959 | 291.87 | 1506 | 1457 | 364.9 |
| D | 12 | 233 | 71376 | 191.62 | 1506 | 1457 | 364.9 |
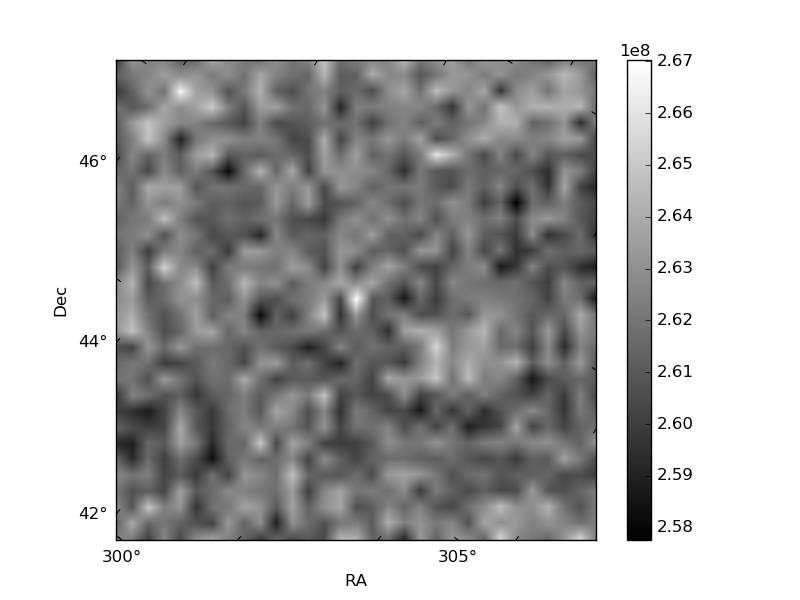
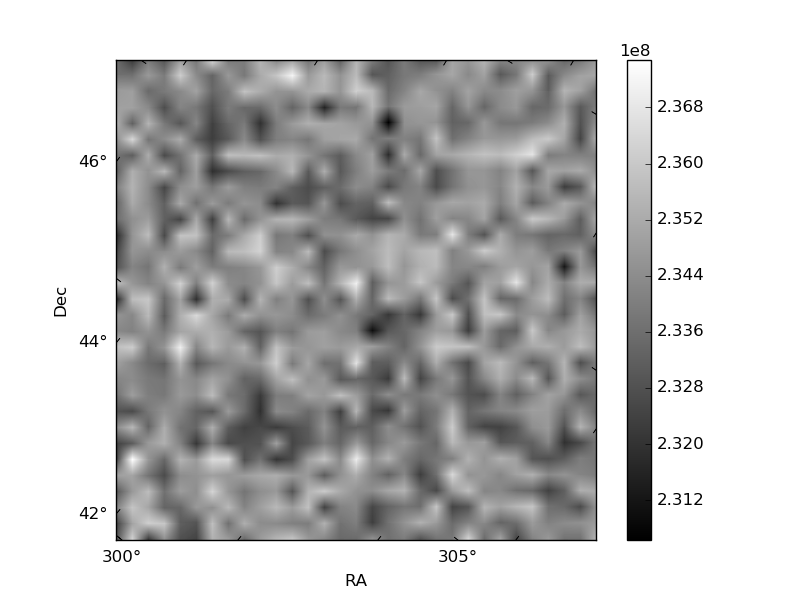
Histogram calculated using DETX and DETY for each event in the final _common_clean file
| Quadrant A |  |
 |
Quadrant B |
|---|---|---|---|
| Quadrant D |  |
 |
Quadrant C |
| Plot type | Count rate plots | Images |
|---|---|---|
| Comparison with Poisson distribution Blue bars denote a histogram of data divided into 1 sec bins. Red curve is a Poisson curve with rate = median count rate of data. |
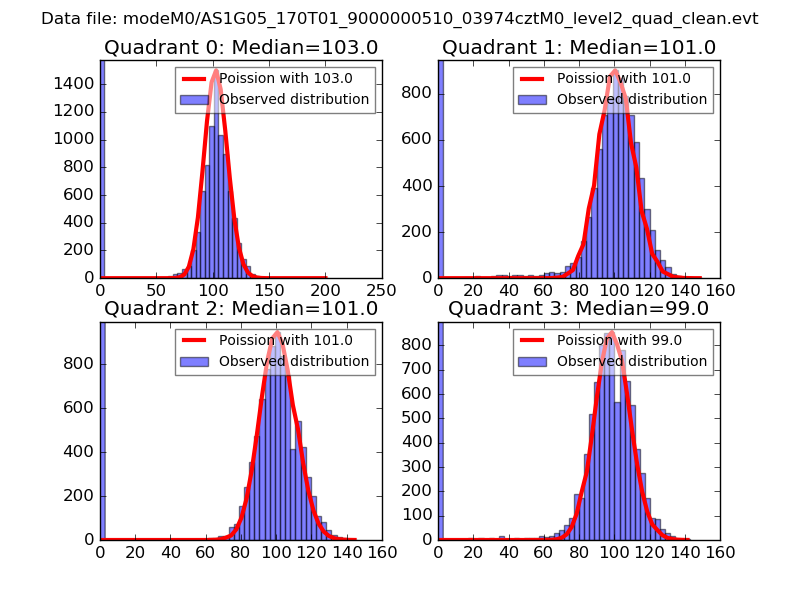 |
 |
| Quadrant-wise count rates Data is divided into 100 sec bins |
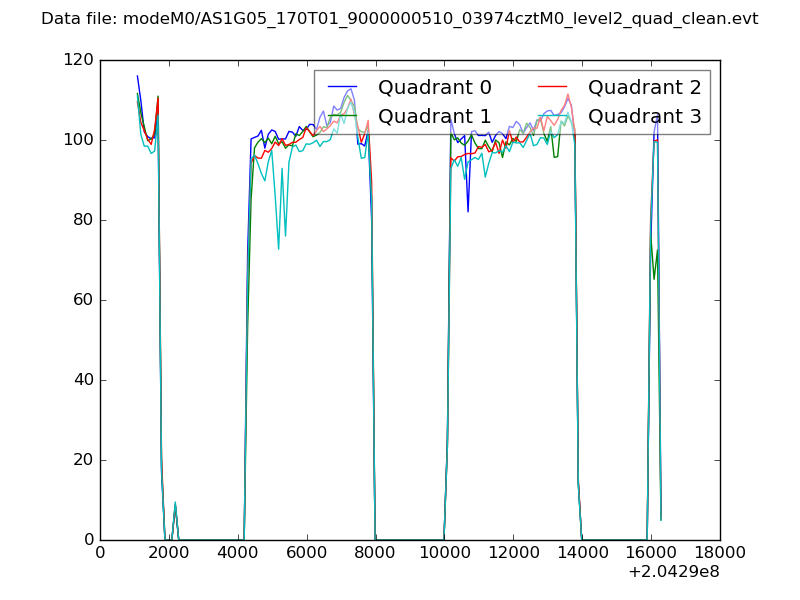 |
|
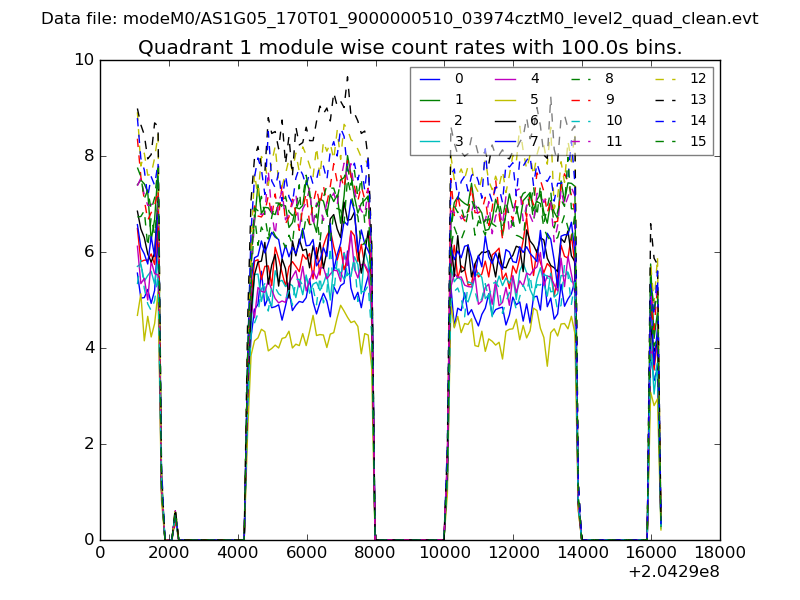
| Module-wise count rates for Quadrant A Data is divided into 100 sec bins |
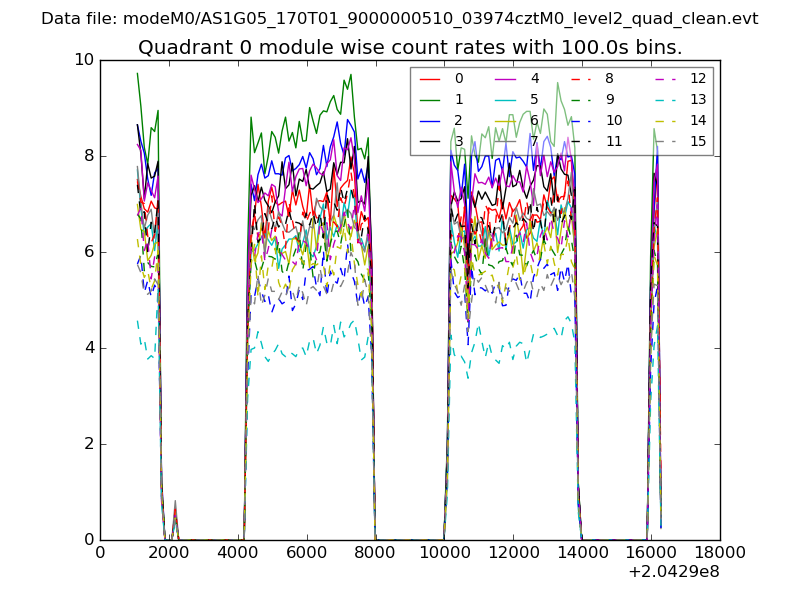 |
 |
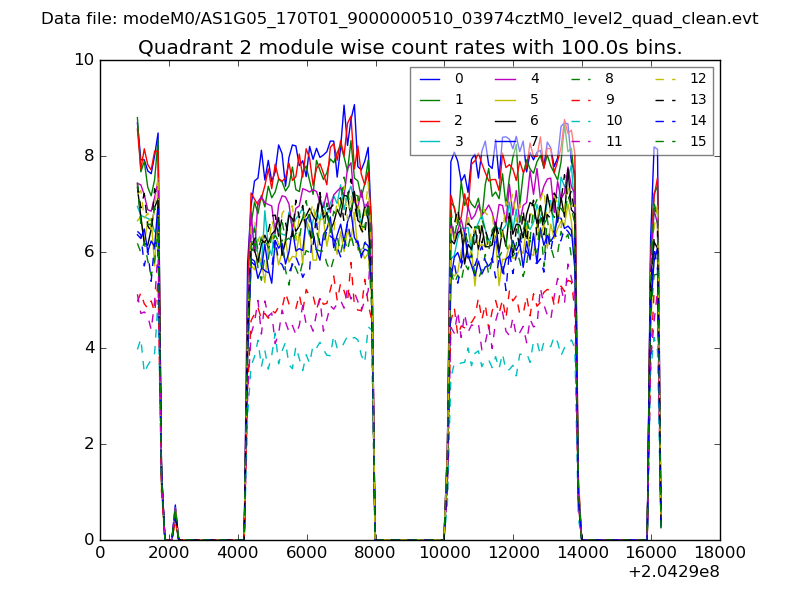
| Module-wise count rates for Quadrant B Data is divided into 100 sec bins |
 |
 |
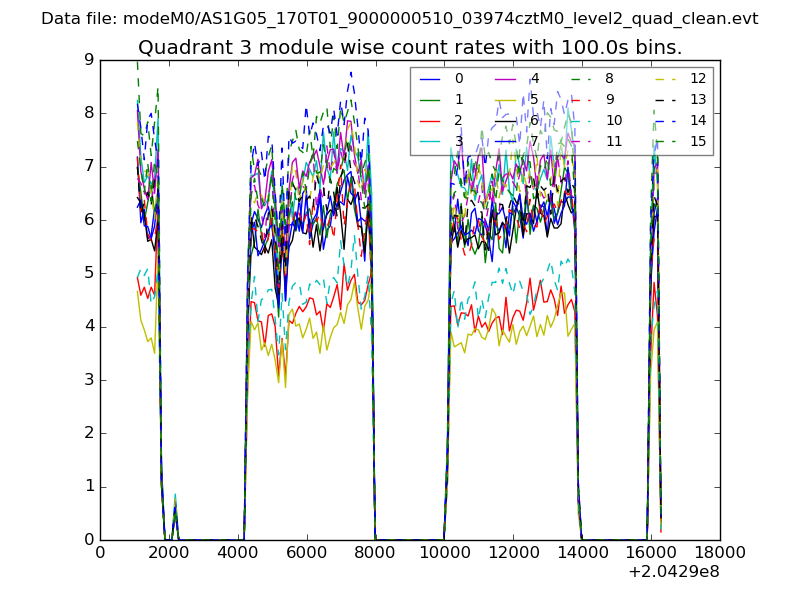
| Module-wise count rates for Quadrant C Data is divided into 100 sec bins |
 |
 |
| Module-wise count rates for Quadrant D Data is divided into 100 sec bins |
 |
 |
| Parameter | Plot |
|---|---|
| CZT HV Monitor | 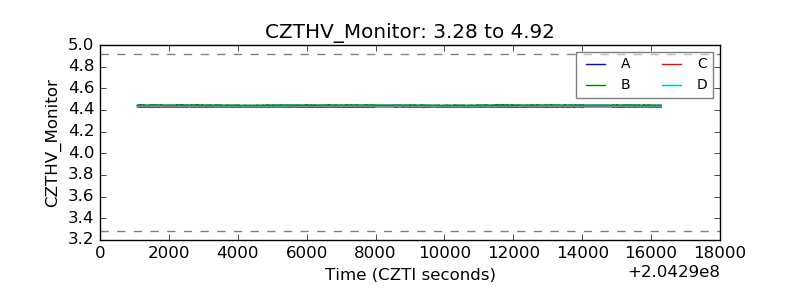 |
| D_VDD | 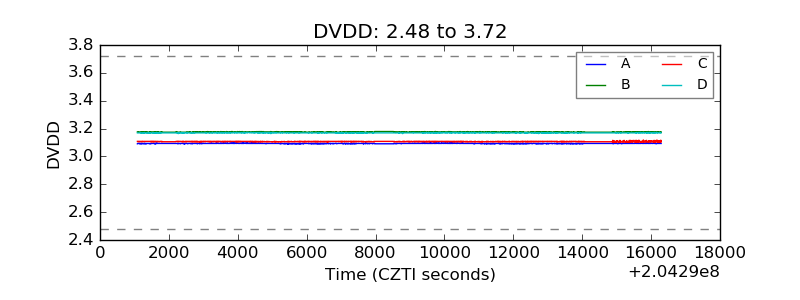 |
| Temperature 1 | 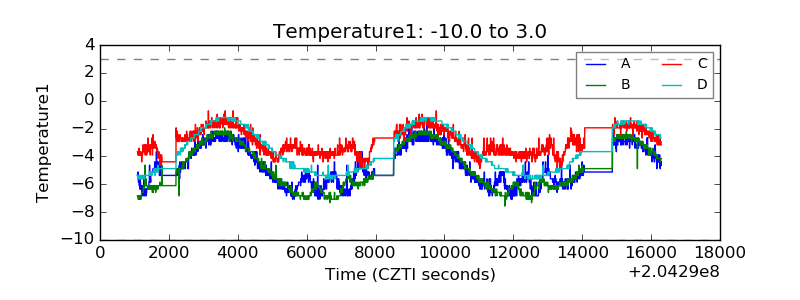 |
| Veto HV Monitor | 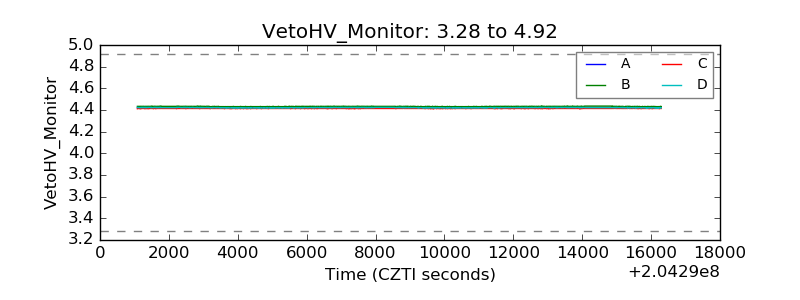 |
| Veto LLD | 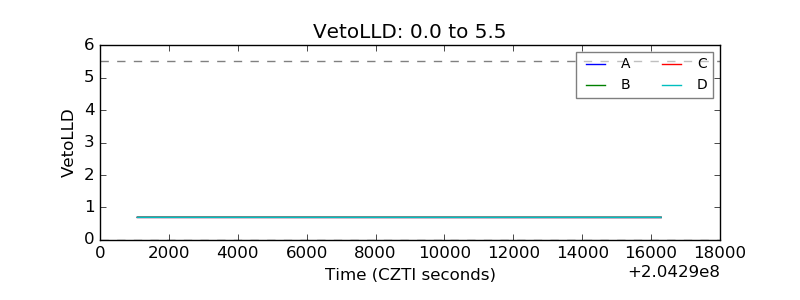 |
| Alpha Counter | 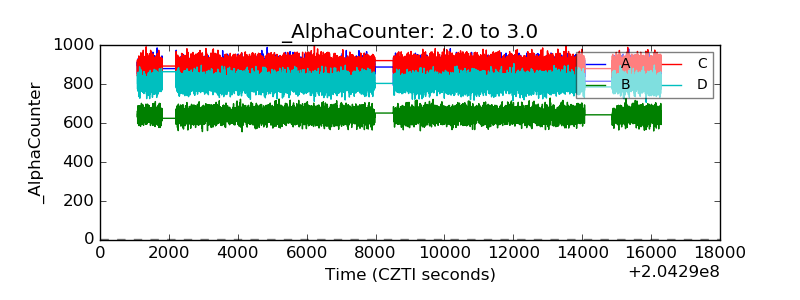 |
| _CPM_Rate | 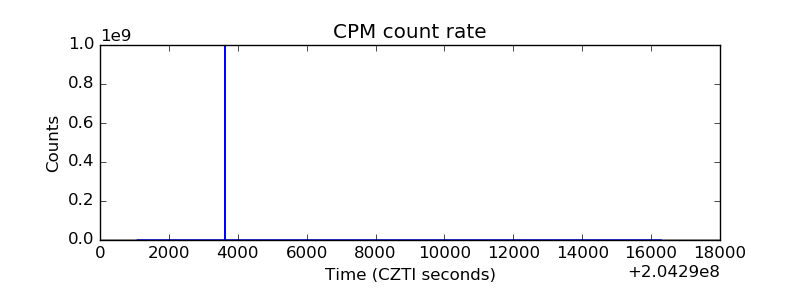 |
| CZT Counter | 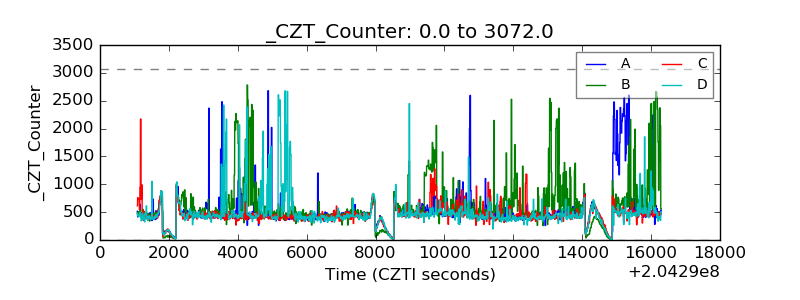 |
| +2.5 Volts monitor |  |
| +5 Volts monitor |  |
| _ROLL_ROT | 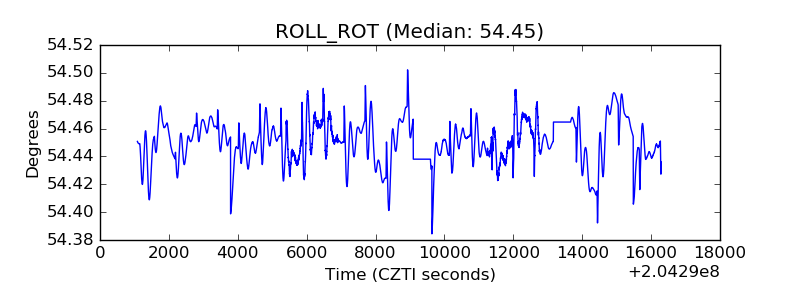 |
| _Roll_DEC | 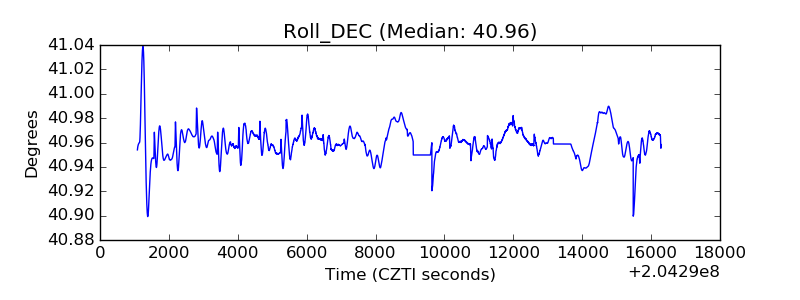 |
| _Roll_RA | 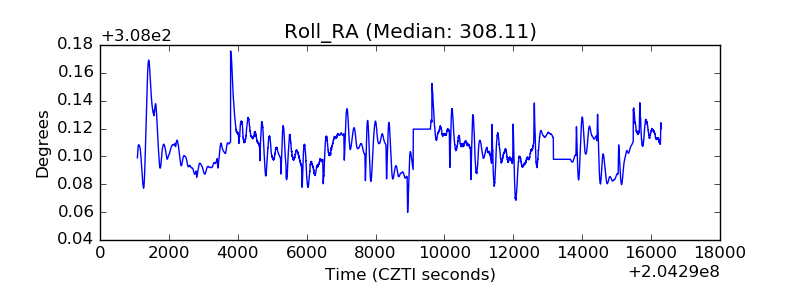 |
| Veto Counter | 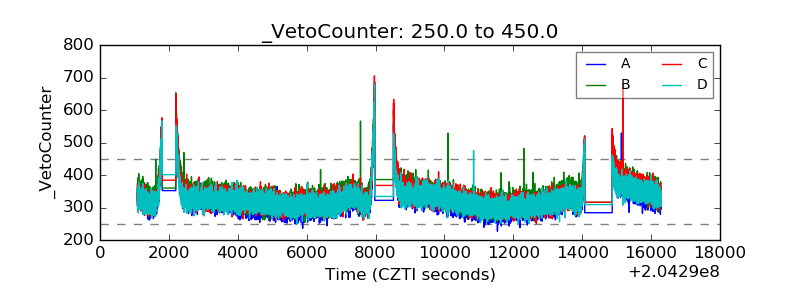 |