| Param | Original file | Final file |
|---|---|---|
| Filename | modeM0/AS1G05_170T01_9000000510_03975cztM0_level2.evt | modeM0/AS1G05_170T01_9000000510_03975cztM0_level2_quad_clean.evt |
| Size (bytes) | 298,751,040 | 38,848,320 |
| Size | 284.9 MB | 37.0 MB |
| Events in quadrant A | 2,535,658 | 234,990 |
| Events in quadrant B | 2,664,822 | 226,236 |
| Events in quadrant C | 1,639,354 | 231,757 |
| Events in quadrant D | 1,959,217 | 225,415 |
| Mode SS | |||
|---|---|---|---|
| Quadrant | BADHDUFLAG | Total packets | Discarded packets |
| A | 0 | 74 | 0 |
| B | 0 | 74 | 0 |
| C | 0 | 74 | 0 |
| D | 0 | 74 | 0 |
| Mode M9 | |||
|---|---|---|---|
| Quadrant | BADHDUFLAG | Total packets | Discarded packets |
| A | 0 | 8 | 0 |
| B | 0 | 8 | 0 |
| C | 0 | 8 | 0 |
| D | 0 | 8 | 0 |
| Mode M0 | |||
|---|---|---|---|
| Quadrant | BADHDUFLAG | Total packets | Discarded packets |
| A | 0 | 10164 | 1 |
| B | 0 | 10453 | 1 |
| C | 0 | 7390 | 1 |
| D | 0 | 8408 | 1 |
| Quadrant | Total seconds | Saturated seconds | Saturation percentage |
|---|---|---|---|
| A | 3639 | 461 | 12.668315% |
| B | 3639 | 315 | 8.656224% |
| C | 3639 | 23 | 0.632042% |
| D | 3639 | 99 | 2.720528% |
Noise dominated data is calculated using 1-second bins in cleaned event files. If a bin has >2000 counts, and if more than 50% of those come from <1% of pixels, then it is considered to be noise-dominated and hence unusable.
| Quadrant | # 1 sec bins | Bins with >0 counts | Bins with >2000 counts | High rate bins dominated by noise | Noise dominated (total time) | Noise dominated (detector-on time) | Marked lightcurve |
|---|---|---|---|---|---|---|---|
| A | 4439 | 3640 | 275 | 275 | 6.20% | 7.55% | 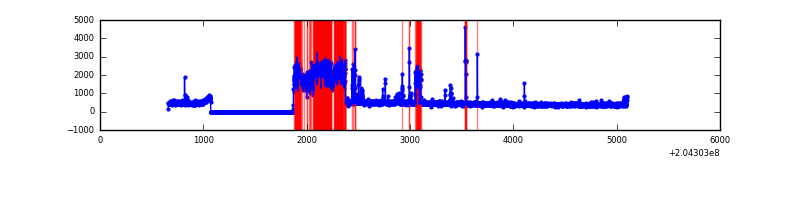 |
| B | 4439 | 3640 | 188 | 188 | 4.24% | 5.16% | 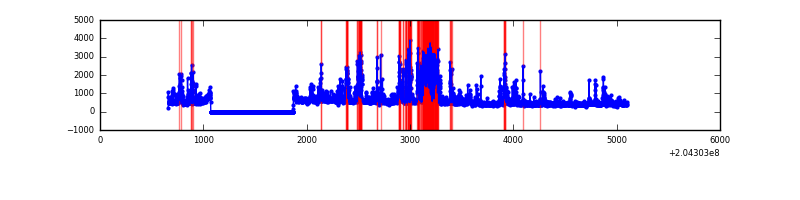 |
| C | 4439 | 3640 | 0 | 0 | 0.00% | 0.00% | 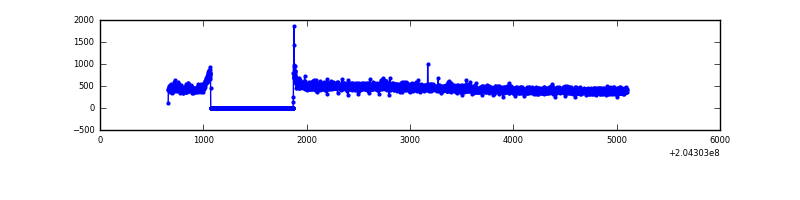 |
| D | 4439 | 3640 | 62 | 62 | 1.40% | 1.70% | 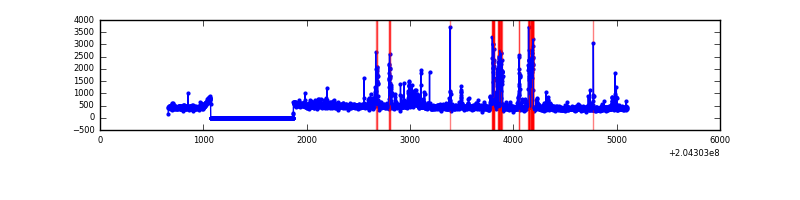 |
Top three noisy pixels from each quadrant. If the there are fewer than three noisy pixels in the level2.evt file, extra rows are filled as -1
| Pixel properties | Quadrant properties | ||||||
|---|---|---|---|---|---|---|---|
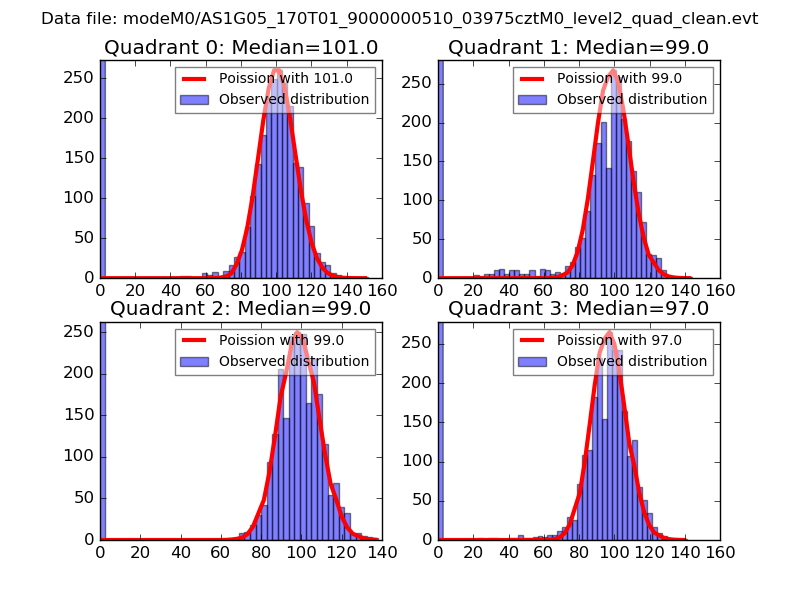
| Quadrant | DetID | PixID | Counts | Sigma | Mean | Median | Sigma |
| A | 15 | 236 | 770229 | 9209.03 | 401 | 391 | 83.6 |
| A | 0 | 50 | 131977 | 1574.07 | 401 | 391 | 83.6 |
| A | 0 | 118 | 45254 | 536.66 | 401 | 391 | 83.6 |
| B | 14 | 167 | 850745 | 10487.81 | 411 | 403 | 81.1 |
| B | 4 | 81 | 72674 | 891.36 | 411 | 403 | 81.1 |
| B | 3 | 0 | 69609 | 853.56 | 411 | 403 | 81.1 |
| C | 8 | 128 | 13034 | 130.29 | 409 | 410 | 96.9 |
| C | 9 | 144 | 9610 | 94.95 | 409 | 410 | 96.9 |
| C | 10 | 65 | 7799 | 76.26 | 409 | 410 | 96.9 |
| D | 2 | 232 | 282532 | 2837.26 | 407 | 394 | 99.4 |
| D | 12 | 233 | 44848 | 447.04 | 407 | 394 | 99.4 |
| D | 2 | 63 | 34435 | 342.32 | 407 | 394 | 99.4 |
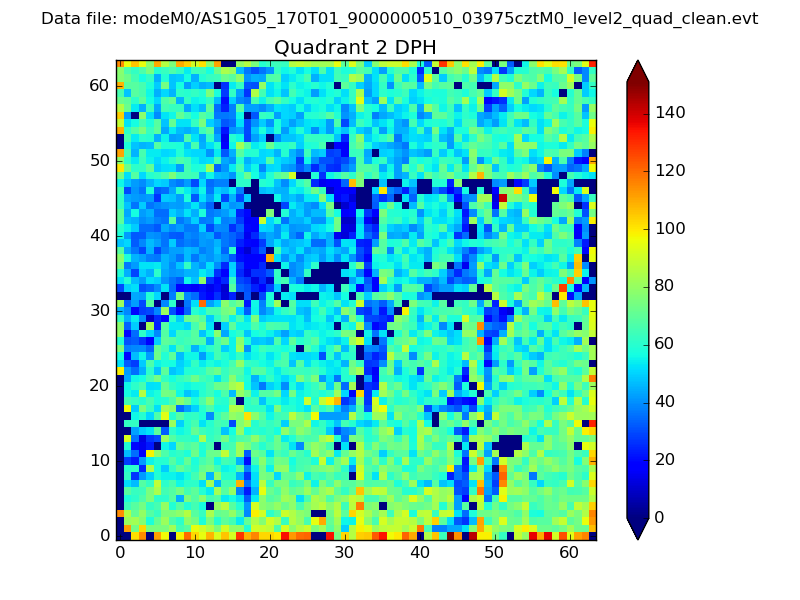
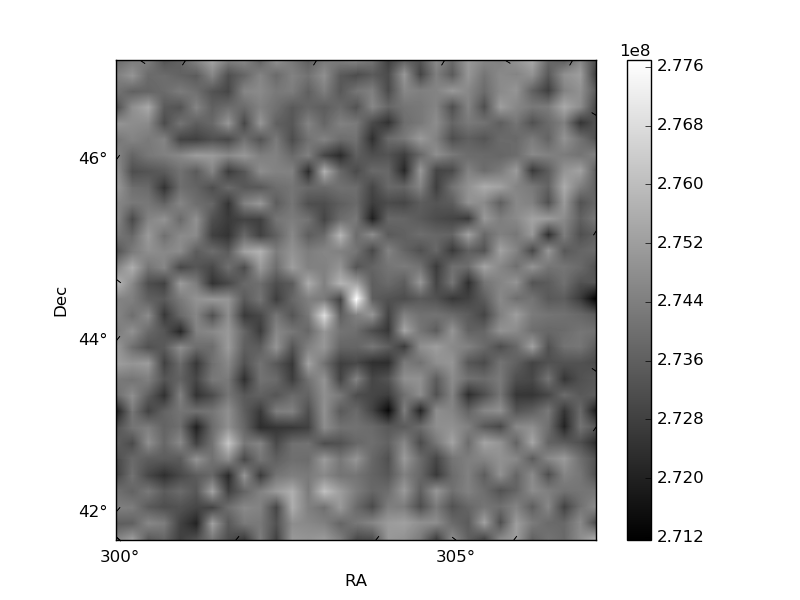
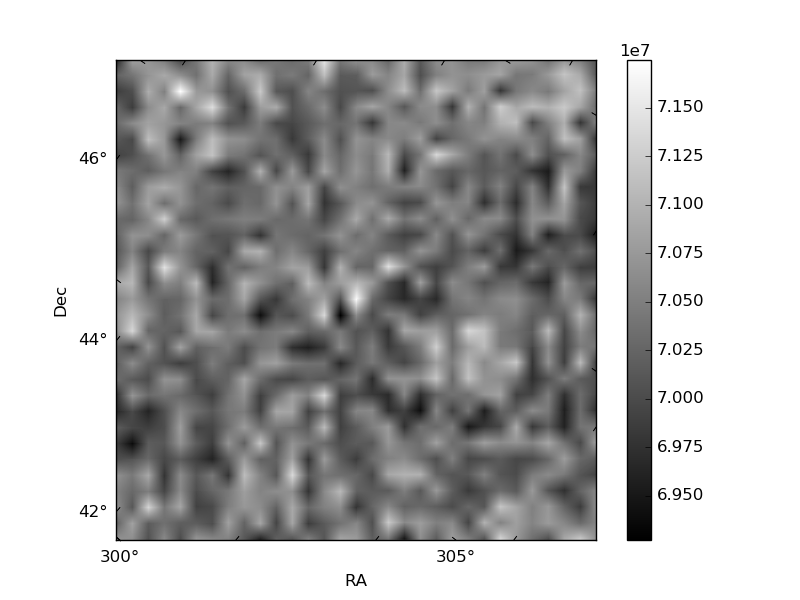
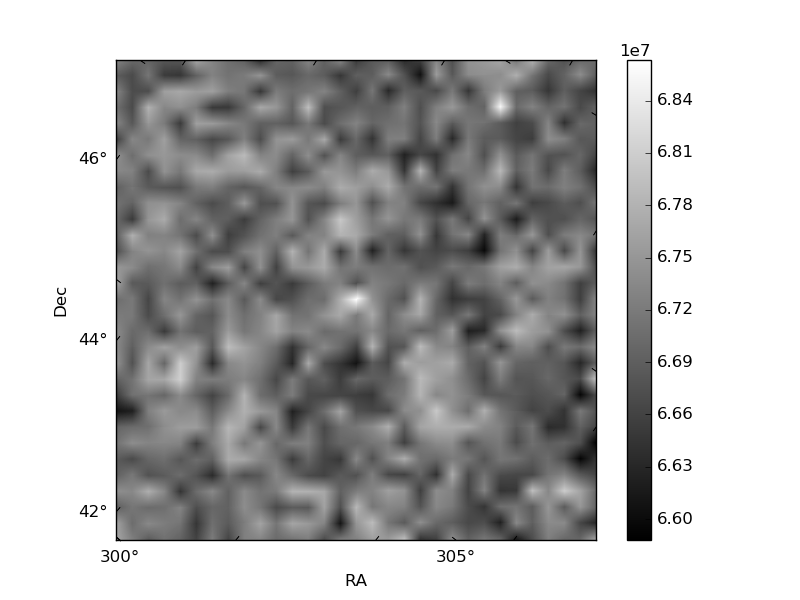
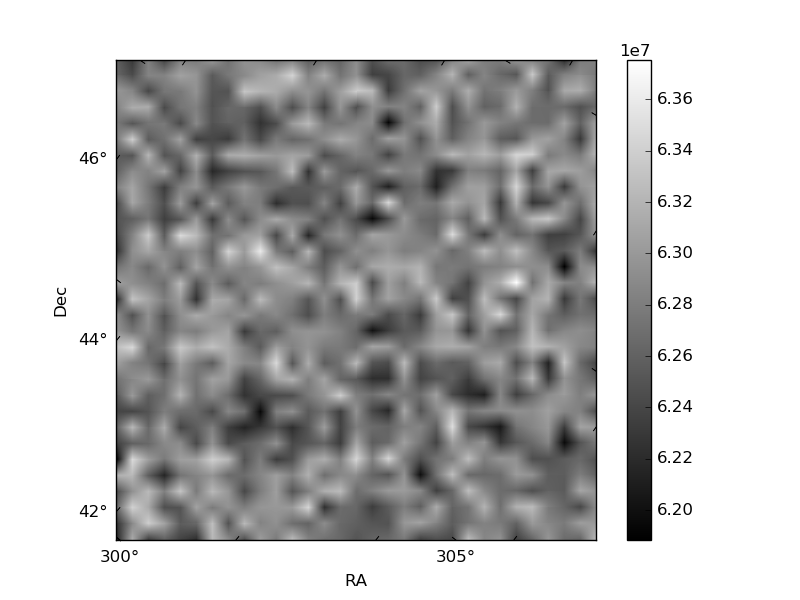
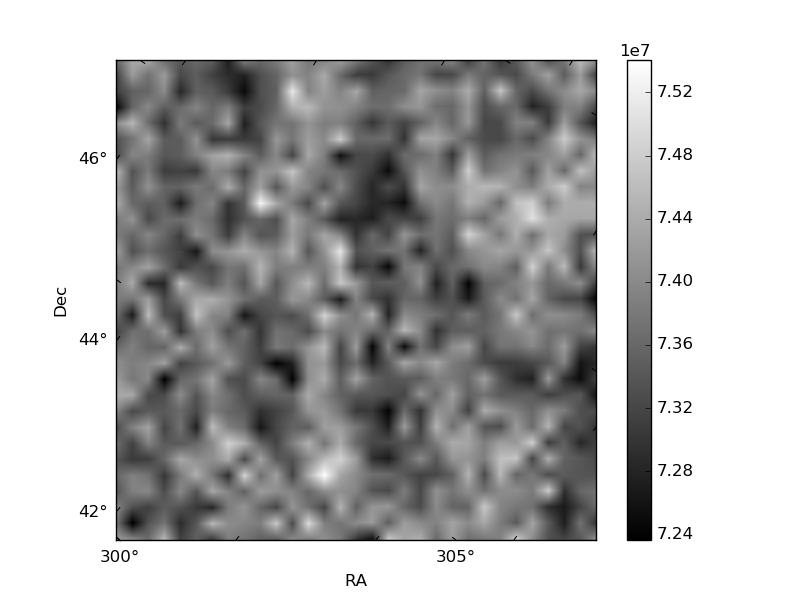
Histogram calculated using DETX and DETY for each event in the final _common_clean file
| Quadrant A | 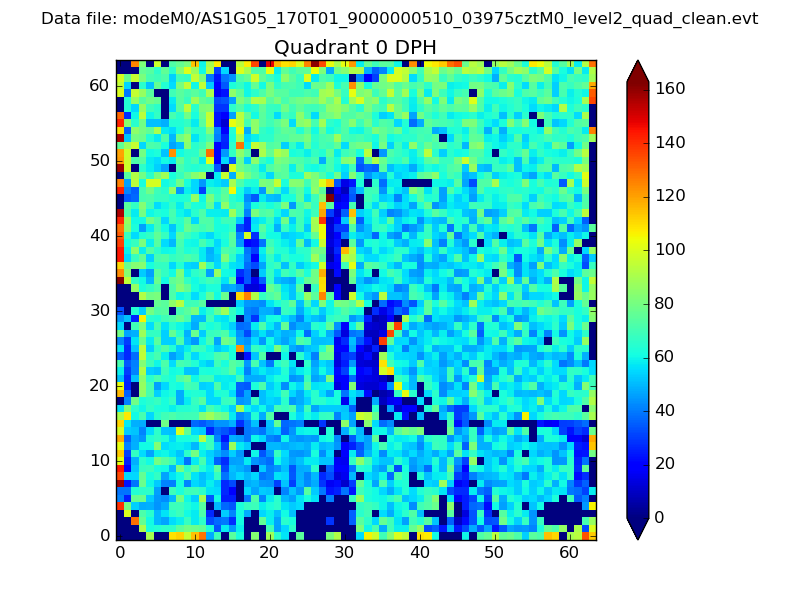 |
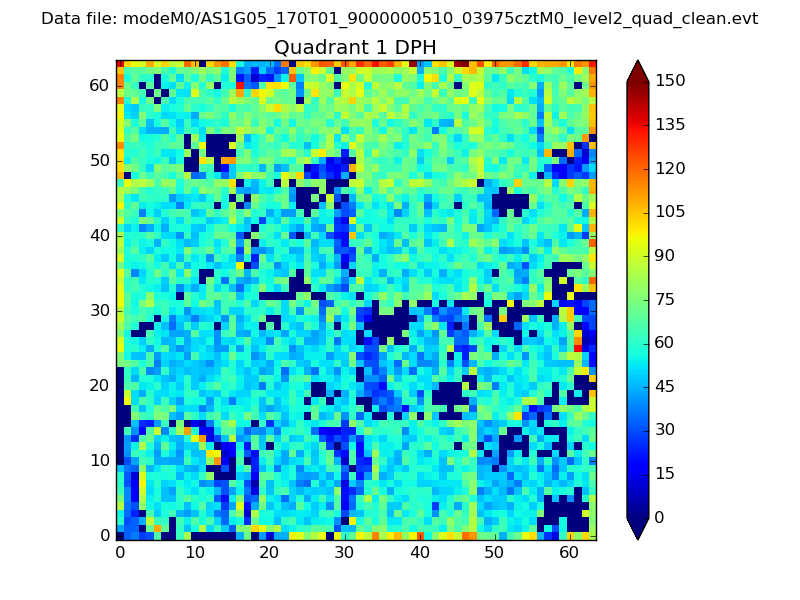 |
Quadrant B |
|---|---|---|---|
| Quadrant D | 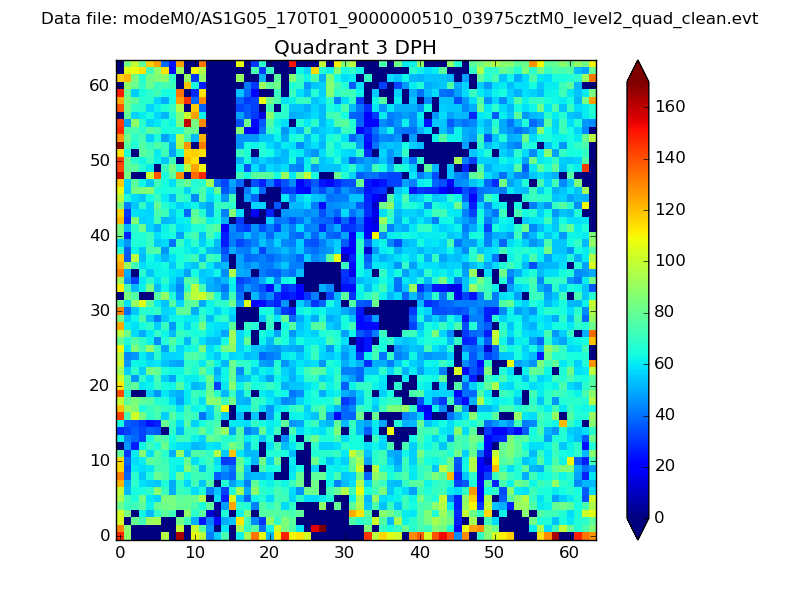 |
 |
Quadrant C |
| Plot type | Count rate plots | Images |
|---|---|---|
| Comparison with Poisson distribution Blue bars denote a histogram of data divided into 1 sec bins. Red curve is a Poisson curve with rate = median count rate of data. |
 |
 |
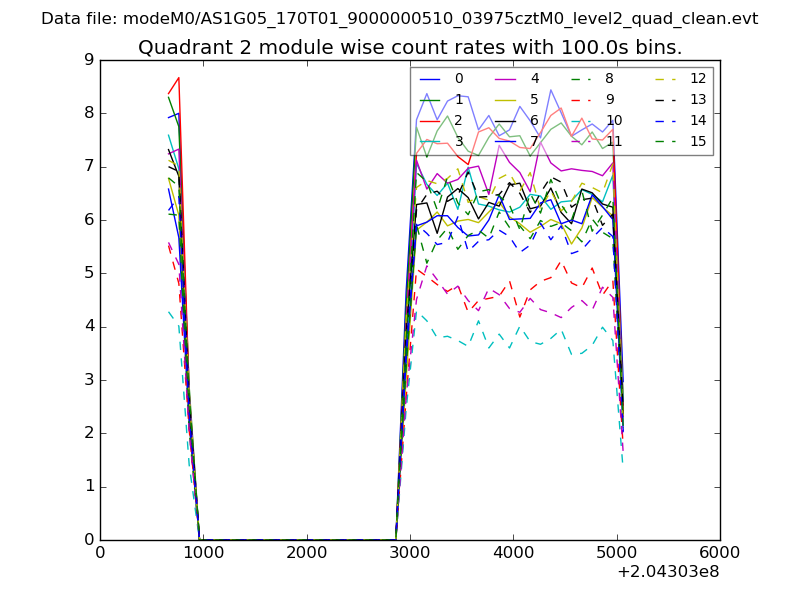
| Quadrant-wise count rates Data is divided into 100 sec bins |
 |
|
| Module-wise count rates for Quadrant A Data is divided into 100 sec bins |
 |
 |
| Module-wise count rates for Quadrant B Data is divided into 100 sec bins |
 |
 |
| Module-wise count rates for Quadrant C Data is divided into 100 sec bins |
 |
 |
| Module-wise count rates for Quadrant D Data is divided into 100 sec bins |
 |
 |
| Parameter | Plot |
|---|---|
| CZT HV Monitor | 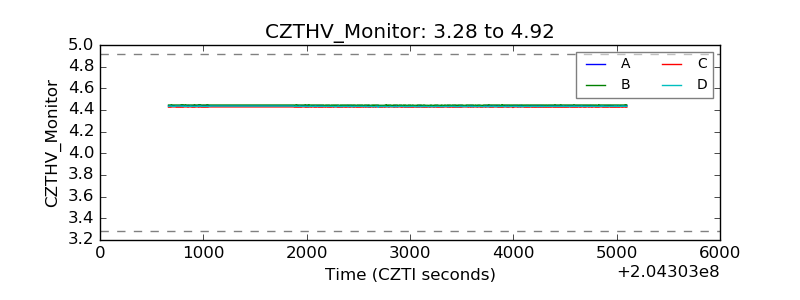 |
| D_VDD | 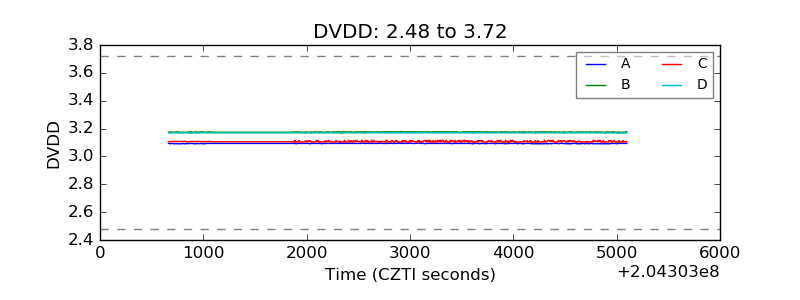 |
| Temperature 1 | 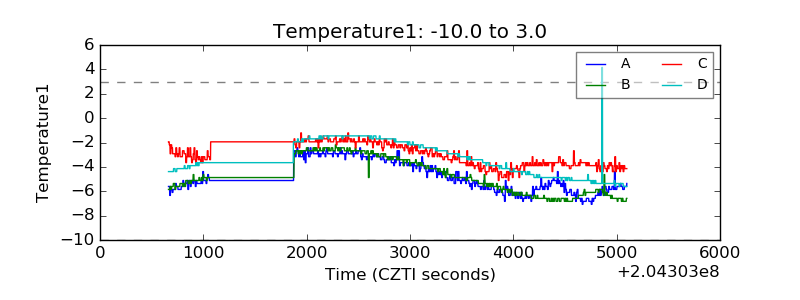 |
| Veto HV Monitor | 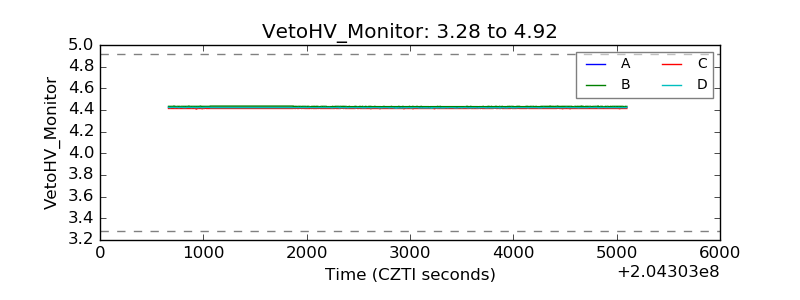 |
| Veto LLD | 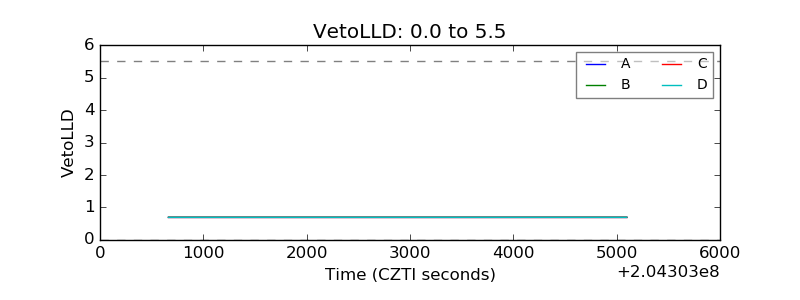 |
| Alpha Counter | 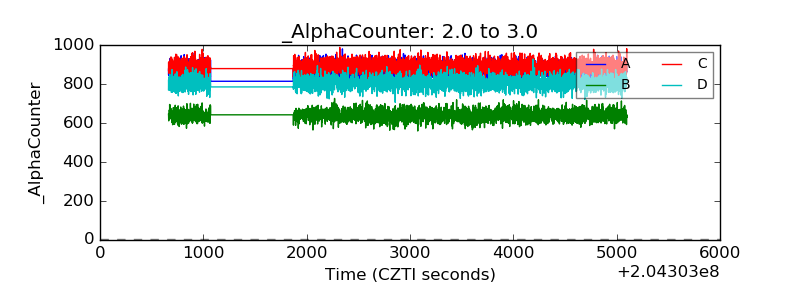 |
| _CPM_Rate | 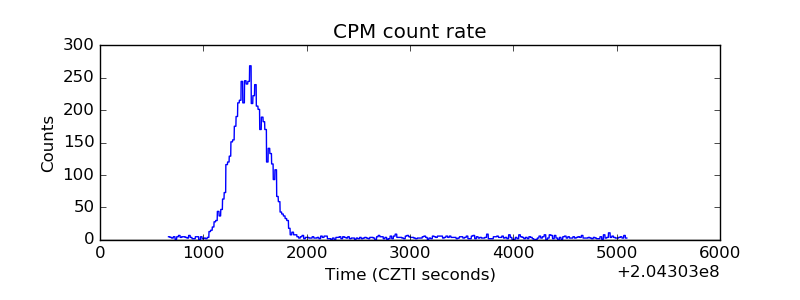 |
| CZT Counter | 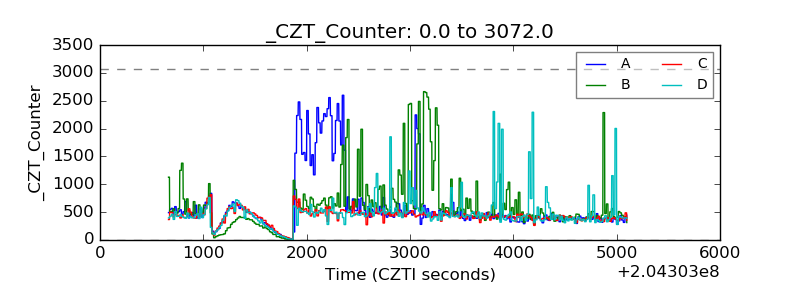 |
| +2.5 Volts monitor | 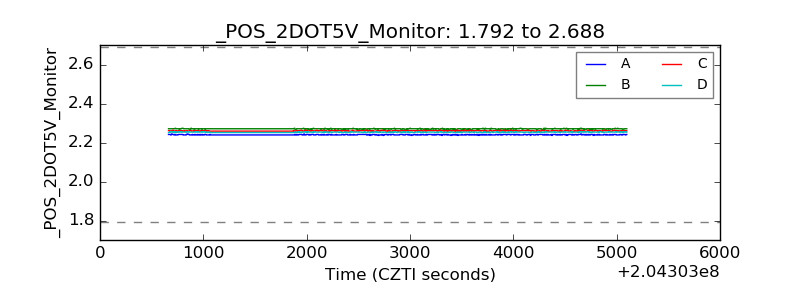 |
| +5 Volts monitor |  |
| _ROLL_ROT | 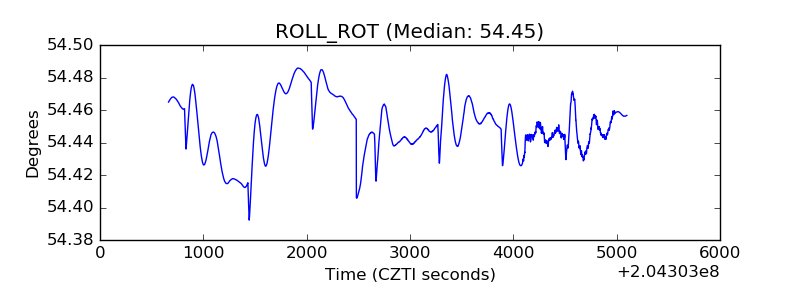 |
| _Roll_DEC | 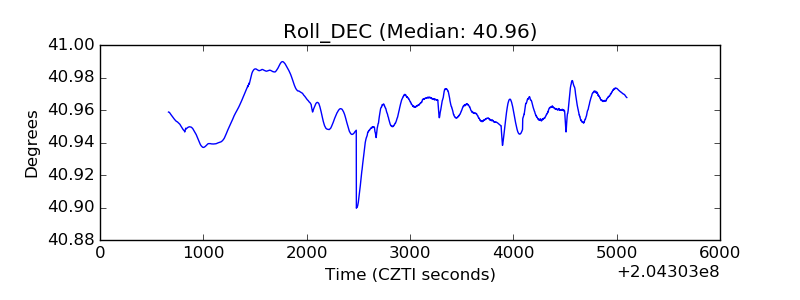 |
| _Roll_RA | 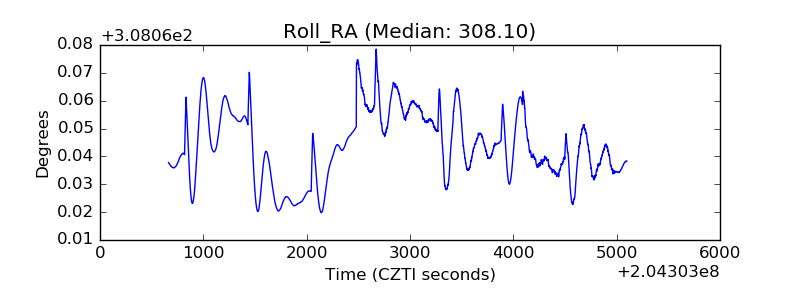 |
| Veto Counter | 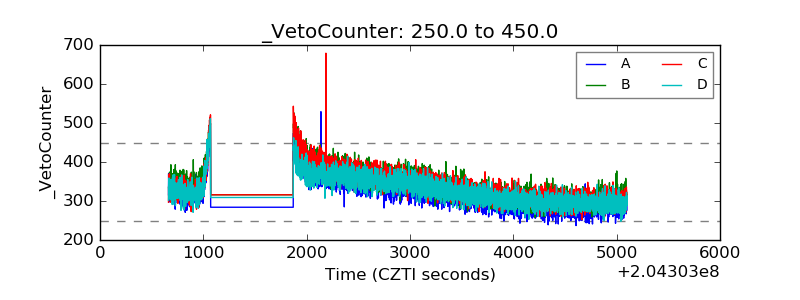 |