| Param | Original file | Final file |
|---|---|---|
| Filename | modeM0/AS1G05_247T01_9000000512cztM0_level2.fits | modeM0/AS1G05_247T01_9000000512cztM0_level2_quad_clean.evt |
| Size (bytes) | 1,340,415,360 | 2,034,244,800 |
| Size | 1.2 GB | 1.9 GB |
| Events in quadrant A | 7,901,782 | 13,260,052 |
| Events in quadrant B | 7,720,590 | 13,417,476 |
| Events in quadrant C | 7,952,432 | 12,953,176 |
| Events in quadrant D | 6,740,474 | 11,713,490 |
| Mode SS | |||
|---|---|---|---|
| Quadrant | BADHDUFLAG | Total packets | Discarded packets |
| A | 0 | 3054 | 0 |
| B | 0 | 3054 | 0 |
| C | 0 | 3054 | 0 |
| D | 0 | 3054 | 0 |
| Mode M9 | |||
|---|---|---|---|
| Quadrant | BADHDUFLAG | Total packets | Discarded packets |
| A | 0 | 243 | 0 |
| B | 0 | 243 | 0 |
| C | 0 | 243 | 0 |
| D | 0 | 244 | 0 |
| Mode M0 | |||
|---|---|---|---|
| Quadrant | BADHDUFLAG | Total packets | Discarded packets |
| A | 0 | 343881 | 0 |
| B | 0 | 331566 | 0 |
| C | 0 | 306277 | 0 |
| D | 0 | 369953 | 0 |
| Quadrant | Total seconds | Saturated seconds | Saturation percentage |
|---|---|---|---|
| A | 149959 | 4722 | 3.148861% |
| B | 149959 | 2989 | 1.993211% |
| C | 149959 | 985 | 0.656846% |
| D | 149959 | 5413 | 3.609653% |
Noise dominated data is calculated using 1-second bins in cleaned event files. If a bin has >2000 counts, and if more than 50% of those come from <1% of pixels, then it is considered to be noise-dominated and hence unusable.
| Quadrant | # 1 sec bins | Bins with >0 counts | Bins with >2000 counts | High rate bins dominated by noise | Noise dominated (total time) | Noise dominated (detector-on time) | Marked lightcurve |
|---|---|---|---|---|---|---|---|
| A | 191972 | 149913 | 0 | 0 | 0.00% | 0.00% |  |
| B | 191972 | 149948 | 0 | 0 | 0.00% | 0.00% |  |
| C | 191972 | 149958 | 0 | 0 | 0.00% | 0.00% |  |
| D | 191972 | 149930 | 0 | 0 | 0.00% | 0.00% |  |
Top three noisy pixels from each quadrant. If the there are fewer than three noisy pixels in the level2.evt file, extra rows are filled as -1
| Pixel properties | Quadrant properties | ||||||
|---|---|---|---|---|---|---|---|
| Quadrant | DetID | PixID | Counts | Sigma | Mean | Median | Sigma |
| A | 0 | 29 | 7883 | 11.37 | 2059 | 1926 | 524.1 |
| A | 7 | 110 | 6671 | 9.05 | 2059 | 1926 | 524.1 |
| A | 0 | 30 | 6143 | 8.05 | 2059 | 1926 | 524.1 |
| B | 2 | 9 | 6678 | 11.75 | 2042 | 1952 | 402.3 |
| B | 12 | 226 | 5509 | 8.84 | 2042 | 1952 | 402.3 |
| B | 14 | 254 | 5411 | 8.6 | 2042 | 1952 | 402.3 |
| C | 1 | 80 | 5762 | 6.87 | 2099 | 1950 | 555.1 |
| C | 1 | 81 | 5681 | 6.72 | 2099 | 1950 | 555.1 |
| C | 12 | 241 | 5602 | 6.58 | 2099 | 1950 | 555.1 |
| D | 11 | 82 | 5863 | 8.03 | 1921 | 1744 | 512.8 |
| D | 6 | 231 | 5060 | 6.47 | 1921 | 1744 | 512.8 |
| D | 3 | 14 | 5033 | 6.41 | 1921 | 1744 | 512.8 |
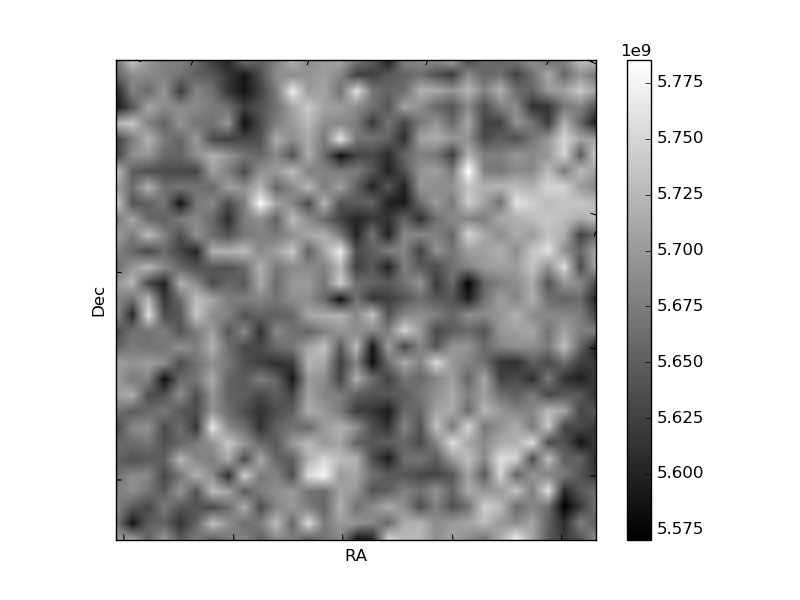
Histogram calculated using DETX and DETY for each event in the final _common_clean file
| Quadrant A | 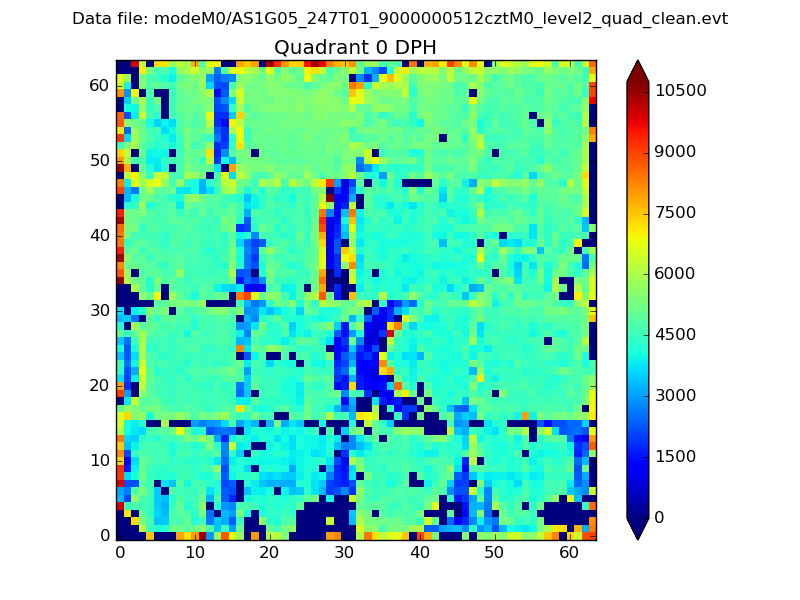 |
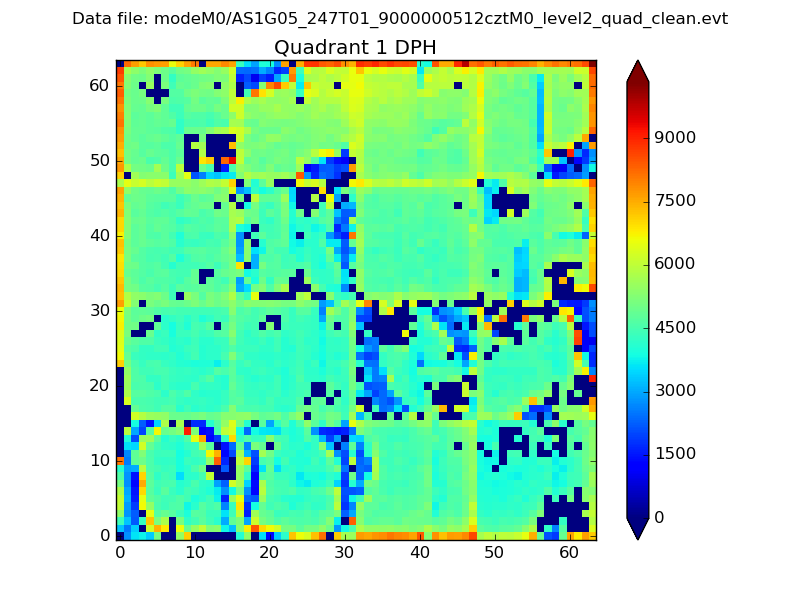 |
Quadrant B |
|---|---|---|---|
| Quadrant D |  |
 |
Quadrant C |
| Plot type | Count rate plots | Images |
|---|---|---|
| Comparison with Poisson distribution Blue bars denote a histogram of data divided into 1 sec bins. Red curve is a Poisson curve with rate = median count rate of data. |
 |
 |
| Quadrant-wise count rates Data is divided into 100 sec bins |
 |
|
| Module-wise count rates for Quadrant A Data is divided into 100 sec bins |
 |
 |
| Module-wise count rates for Quadrant B Data is divided into 100 sec bins |
 |
 |
| Module-wise count rates for Quadrant C Data is divided into 100 sec bins |
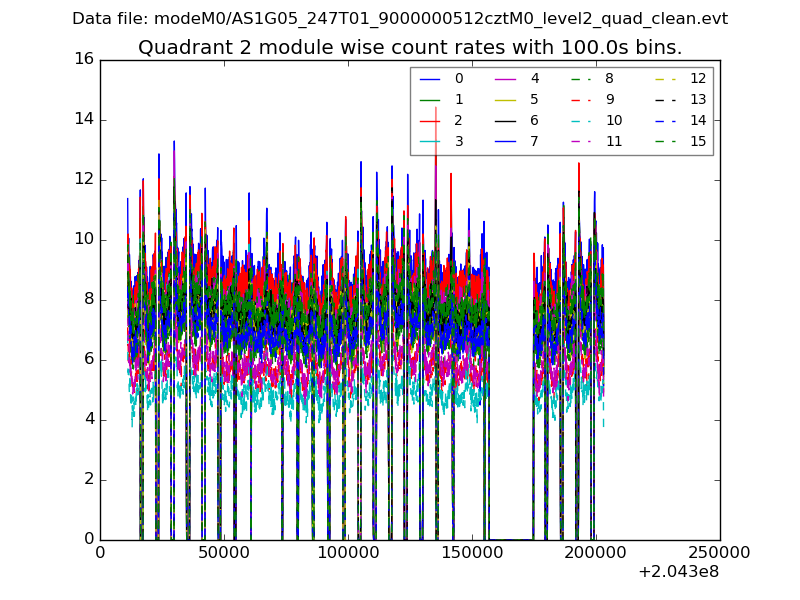 |
 |
| Module-wise count rates for Quadrant D Data is divided into 100 sec bins |
 |
 |
| Parameter | Plot |
|---|---|
| CZT HV Monitor |  |
| D_VDD | 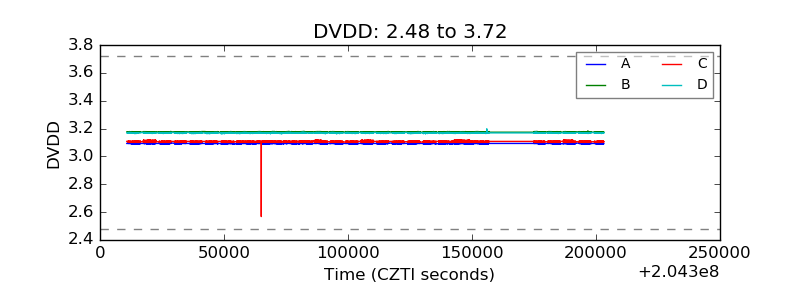 |
| Temperature 1 |  |
| Veto HV Monitor |  |
| Veto LLD | 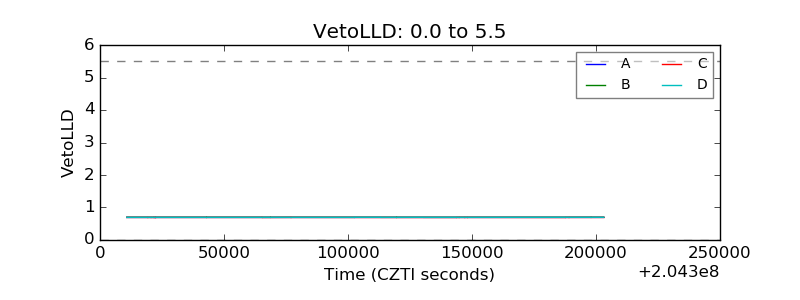 |
| Alpha Counter |  |
| _CPM_Rate |  |
| CZT Counter | 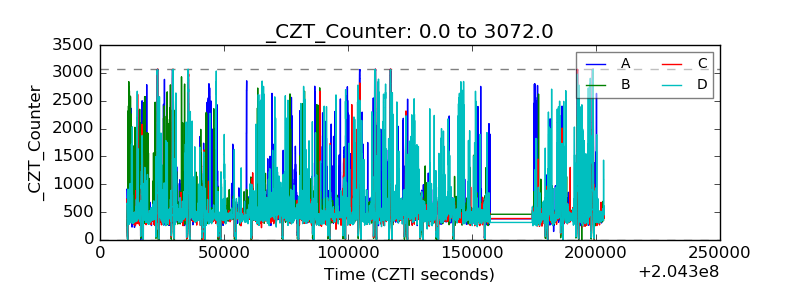 |
| +2.5 Volts monitor |  |
| +5 Volts monitor |  |
| _ROLL_ROT |  |
| _Roll_DEC |  |
| _Roll_RA |  |
| Veto Counter |  |