| Param | Original file | Final file |
|---|---|---|
| Filename | modeM0/AS1G05_247T01_9000000512_03977cztM0_level2.evt | modeM0/AS1G05_247T01_9000000512_03977cztM0_level2_quad_clean.evt |
| Size (bytes) | 504,846,720 | 102,576,960 |
| Size | 481.5 MB | 97.8 MB |
| Events in quadrant A | 3,251,683 | 683,846 |
| Events in quadrant B | 5,482,099 | 642,038 |
| Events in quadrant C | 3,101,942 | 672,059 |
| Events in quadrant D | 3,014,058 | 656,909 |
| Mode SS | |||
|---|---|---|---|
| Quadrant | BADHDUFLAG | Total packets | Discarded packets |
| A | 0 | 132 | 0 |
| B | 0 | 132 | 0 |
| C | 0 | 132 | 0 |
| D | 0 | 132 | 0 |
| Mode M9 | |||
|---|---|---|---|
| Quadrant | BADHDUFLAG | Total packets | Discarded packets |
| A | 0 | 14 | 0 |
| B | 0 | 14 | 0 |
| C | 0 | 14 | 0 |
| D | 0 | 15 | 0 |
| Mode M0 | |||
|---|---|---|---|
| Quadrant | BADHDUFLAG | Total packets | Discarded packets |
| A | 0 | 14188 | 3 |
| B | 0 | 20667 | 2 |
| C | 0 | 13851 | 2 |
| D | 0 | 13787 | 2 |
| Quadrant | Total seconds | Saturated seconds | Saturation percentage |
|---|---|---|---|
| A | 6470 | 82 | 1.267388% |
| B | 6470 | 771 | 11.916538% |
| C | 6470 | 58 | 0.896445% |
| D | 6470 | 64 | 0.989181% |
Noise dominated data is calculated using 1-second bins in cleaned event files. If a bin has >2000 counts, and if more than 50% of those come from <1% of pixels, then it is considered to be noise-dominated and hence unusable.
| Quadrant | # 1 sec bins | Bins with >0 counts | Bins with >2000 counts | High rate bins dominated by noise | Noise dominated (total time) | Noise dominated (detector-on time) | Marked lightcurve |
|---|---|---|---|---|---|---|---|
| A | 7565 | 6471 | 30 | 30 | 0.40% | 0.46% | 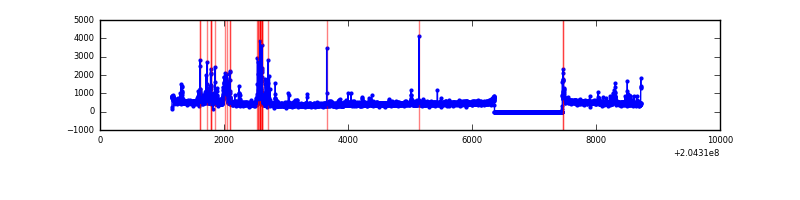 |
| B | 7565 | 6471 | 492 | 492 | 6.50% | 7.60% | 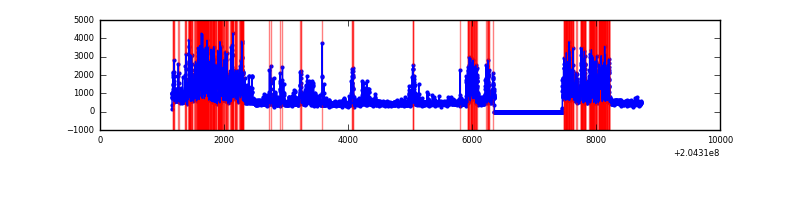 |
| C | 7565 | 6471 | 41 | 41 | 0.54% | 0.63% | 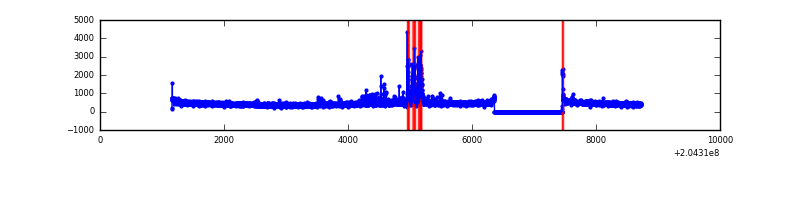 |
| D | 7565 | 6471 | 33 | 33 | 0.44% | 0.51% | 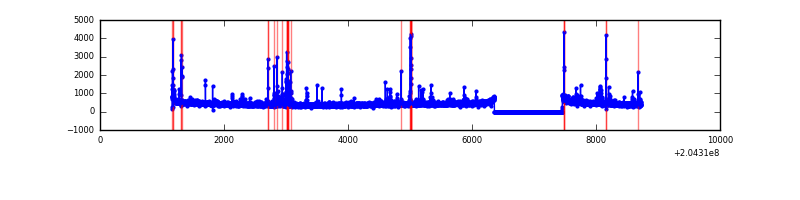 |
Top three noisy pixels from each quadrant. If the there are fewer than three noisy pixels in the level2.evt file, extra rows are filled as -1
| Pixel properties | Quadrant properties | ||||||
|---|---|---|---|---|---|---|---|
| Quadrant | DetID | PixID | Counts | Sigma | Mean | Median | Sigma |
| A | 0 | 118 | 186183 | 1232.04 | 736 | 720 | 150.5 |
| A | 0 | 50 | 158357 | 1047.19 | 736 | 720 | 150.5 |
| A | 0 | 226 | 24744 | 159.59 | 736 | 720 | 150.5 |
| B | 14 | 167 | 2297792 | 16938.22 | 711 | 696 | 135.6 |
| B | 15 | 204 | 202044 | 1484.69 | 711 | 696 | 135.6 |
| B | 4 | 81 | 113928 | 834.95 | 711 | 696 | 135.6 |
| C | 9 | 144 | 321273 | 1964.34 | 706 | 710 | 163.2 |
| C | 10 | 65 | 10770 | 61.65 | 706 | 710 | 163.2 |
| C | 8 | 128 | 6492 | 35.43 | 706 | 710 | 163.2 |
| D | 2 | 232 | 144381 | 857.19 | 703 | 683 | 167.6 |
| D | 2 | 14 | 41399 | 242.88 | 703 | 683 | 167.6 |
| D | 2 | 32 | 25730 | 149.41 | 703 | 683 | 167.6 |
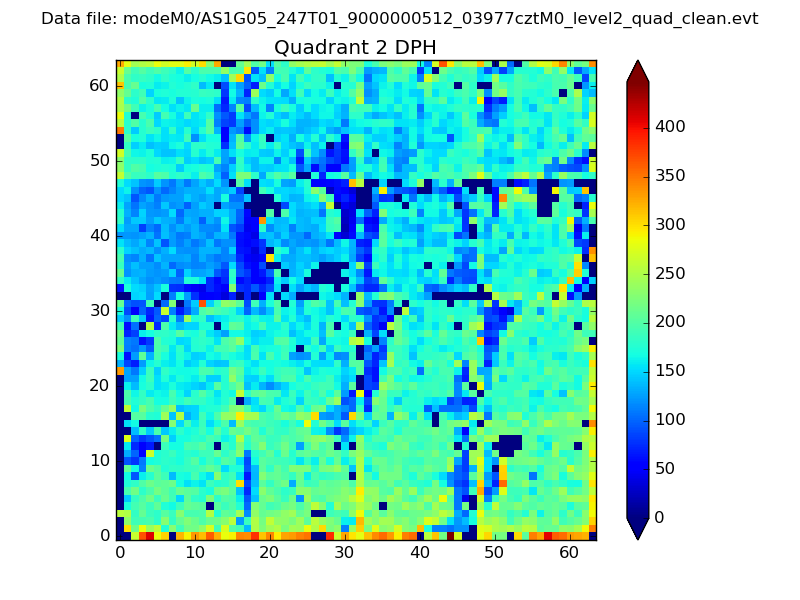
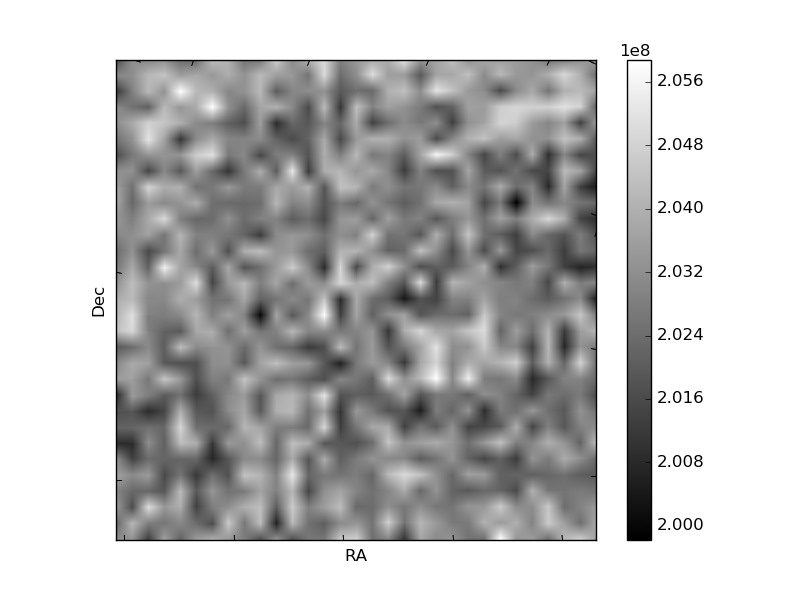
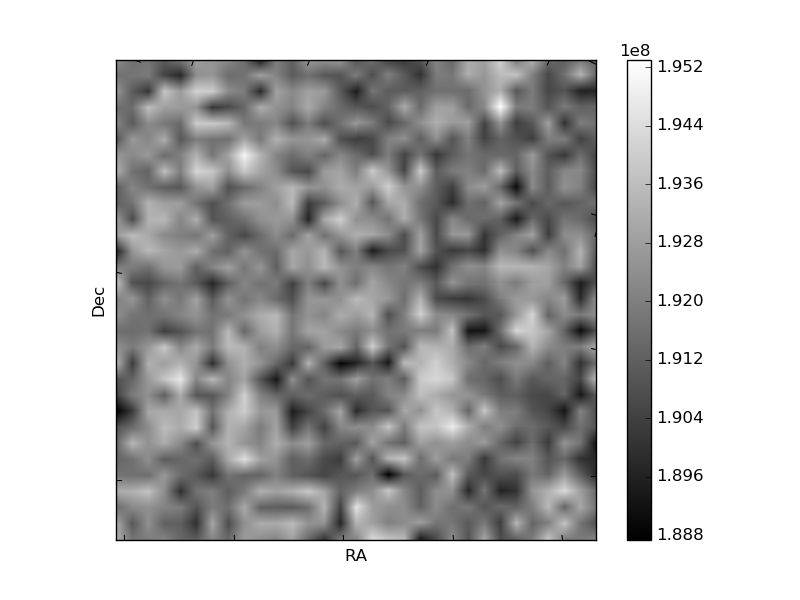
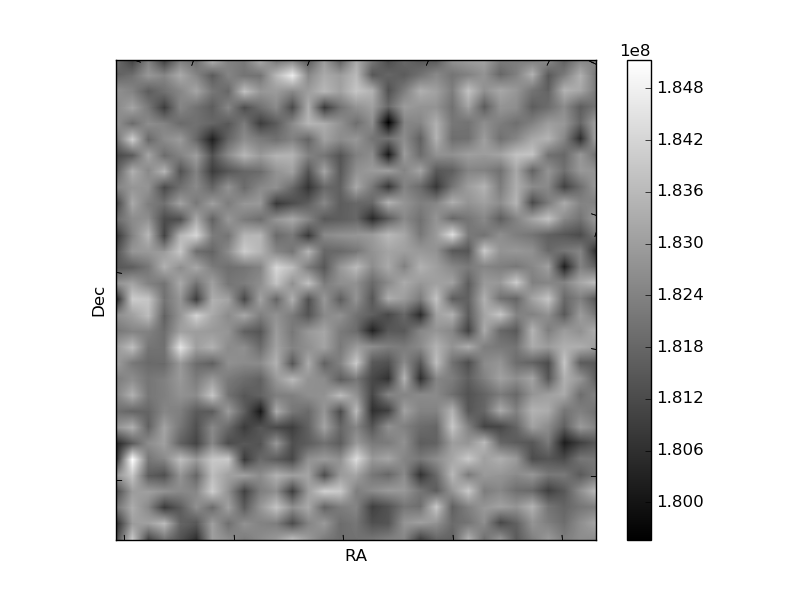
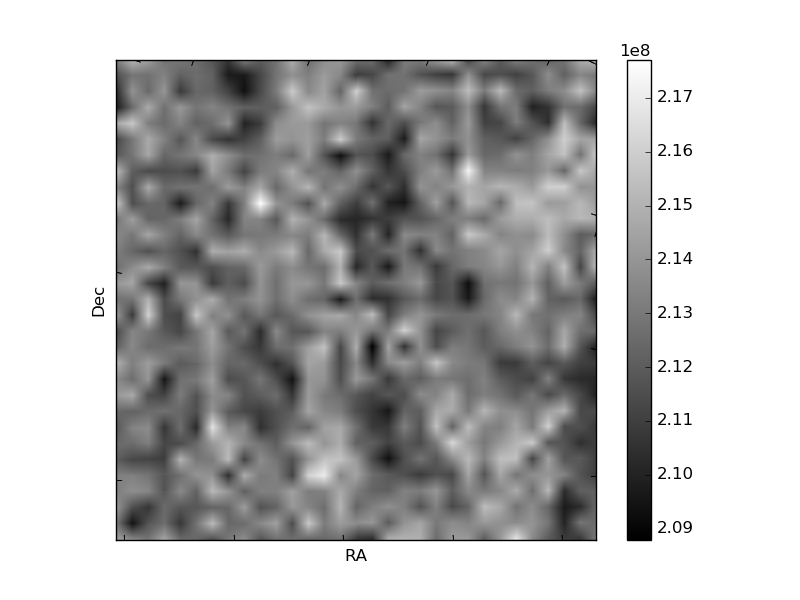
Histogram calculated using DETX and DETY for each event in the final _common_clean file
| Quadrant A | 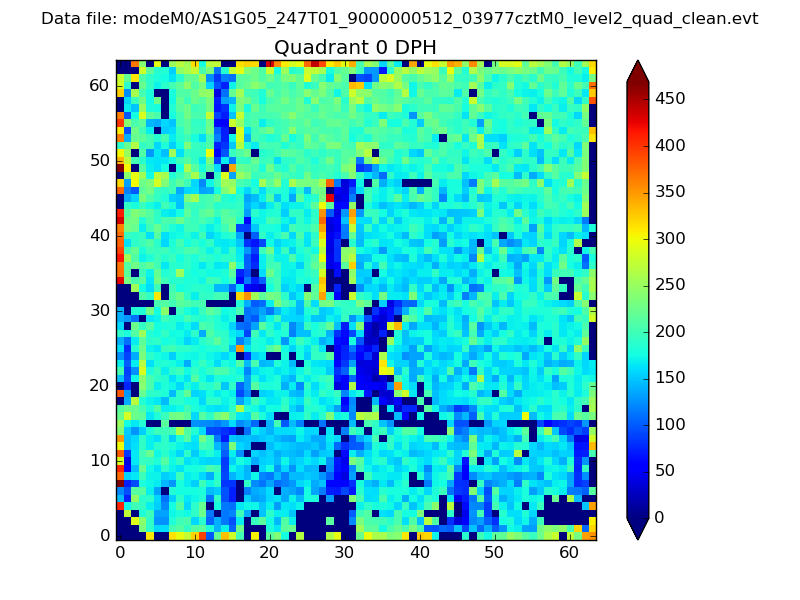 |
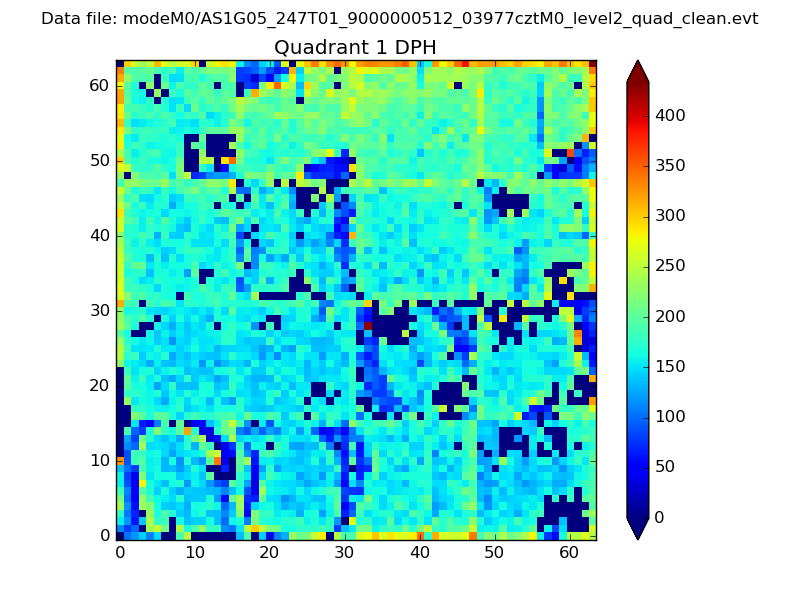 |
Quadrant B |
|---|---|---|---|
| Quadrant D | 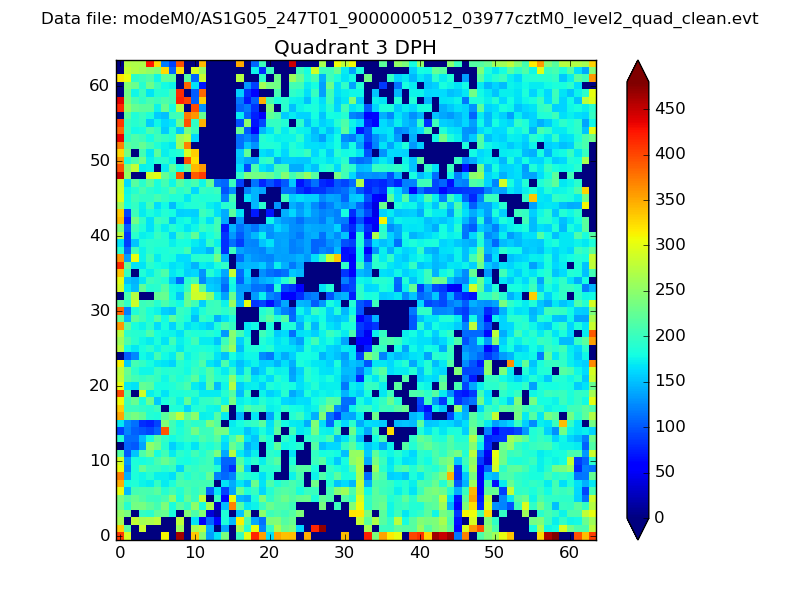 |
 |
Quadrant C |
| Plot type | Count rate plots | Images |
|---|---|---|
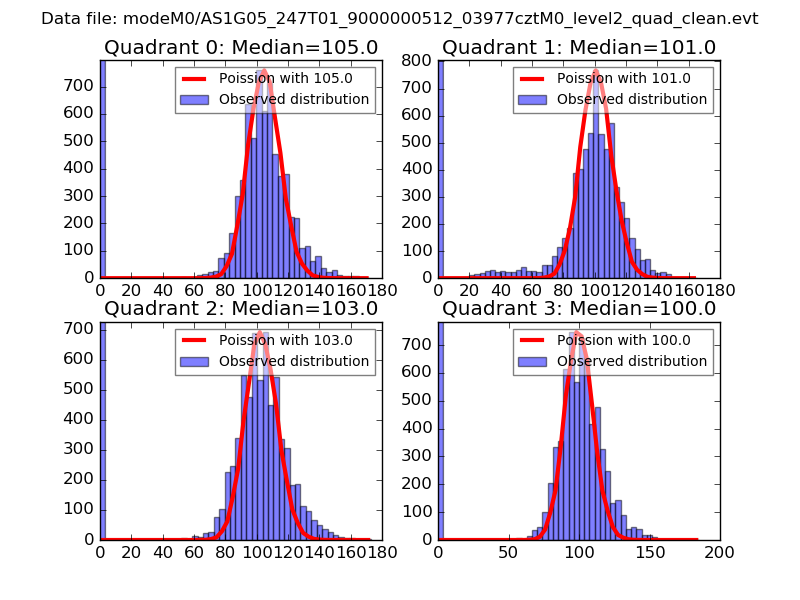
| Comparison with Poisson distribution Blue bars denote a histogram of data divided into 1 sec bins. Red curve is a Poisson curve with rate = median count rate of data. |
 |
 |
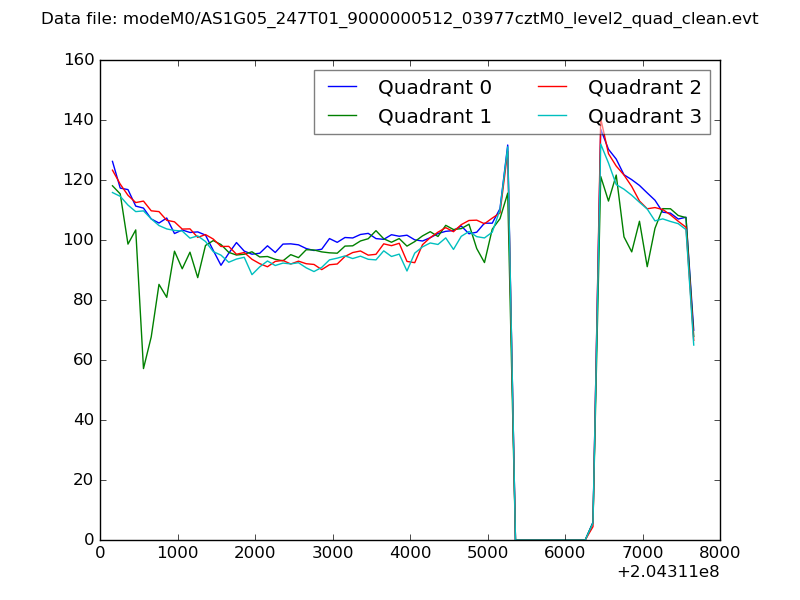
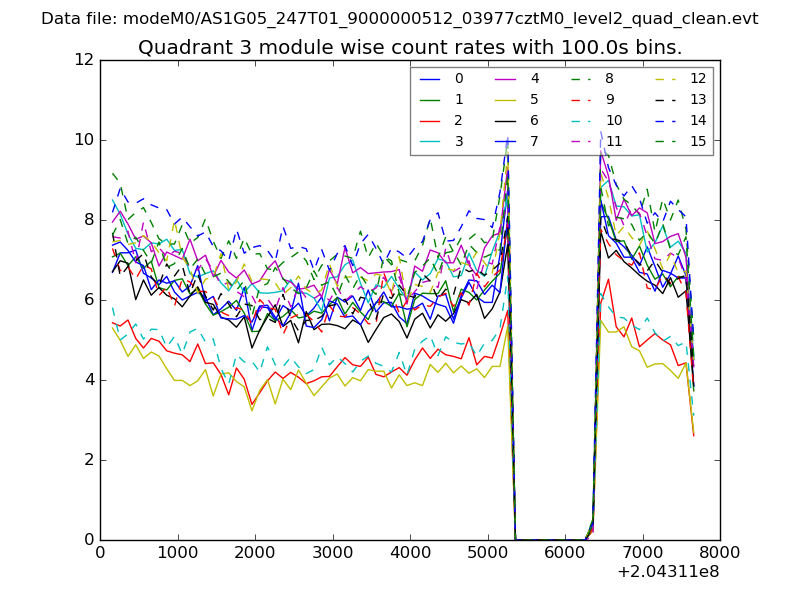
| Quadrant-wise count rates Data is divided into 100 sec bins |
 |
|
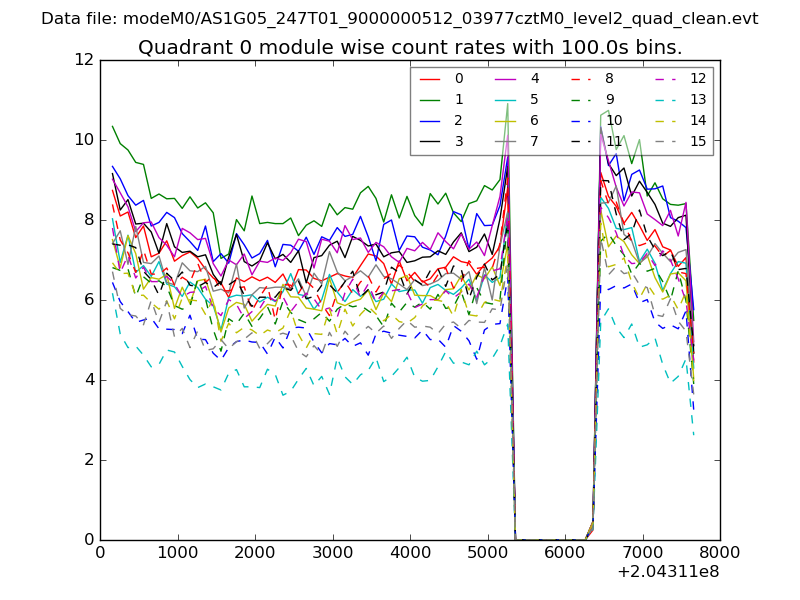
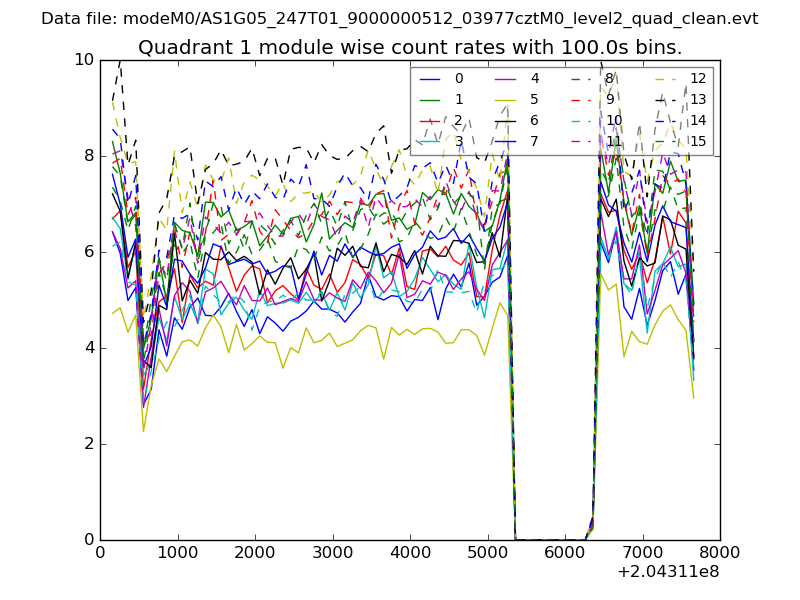
| Module-wise count rates for Quadrant A Data is divided into 100 sec bins |
 |
 |
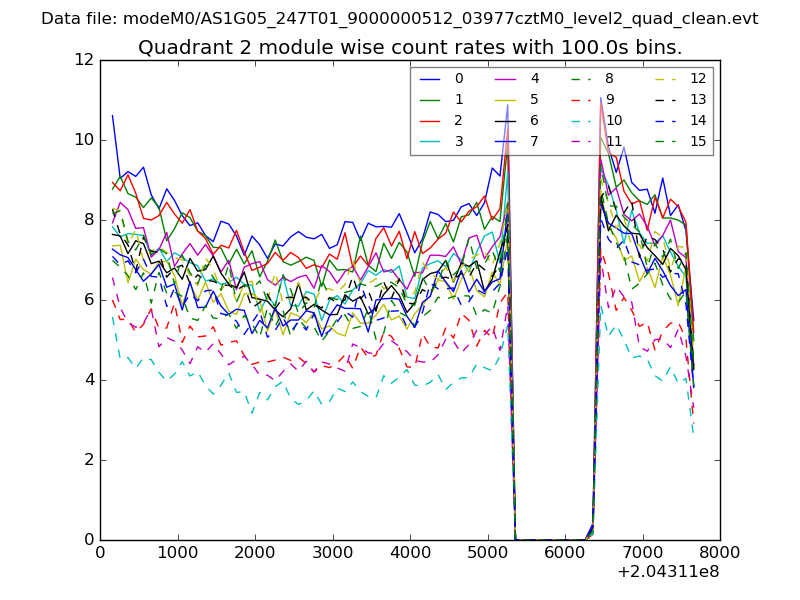
| Module-wise count rates for Quadrant B Data is divided into 100 sec bins |
 |
 |
| Module-wise count rates for Quadrant C Data is divided into 100 sec bins |
 |
 |
| Module-wise count rates for Quadrant D Data is divided into 100 sec bins |
 |
 |
| Parameter | Plot |
|---|---|
| CZT HV Monitor | 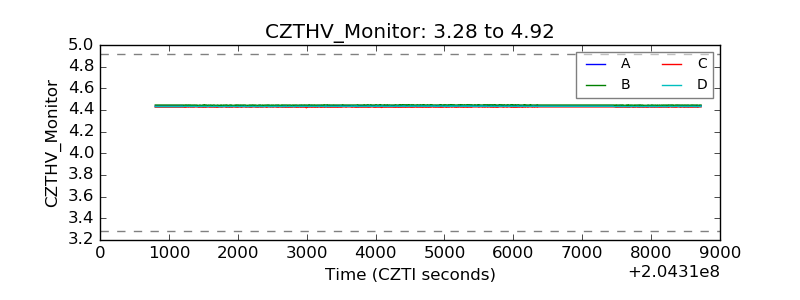 |
| D_VDD | 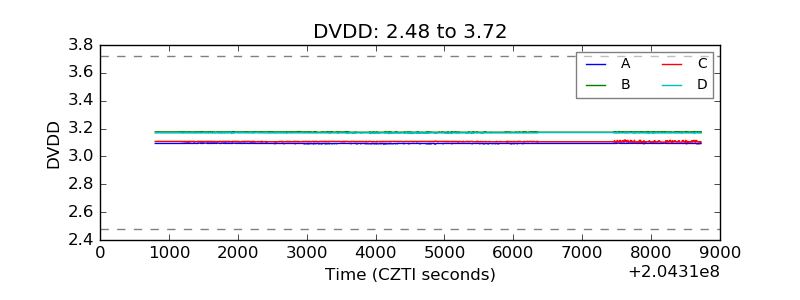 |
| Temperature 1 | 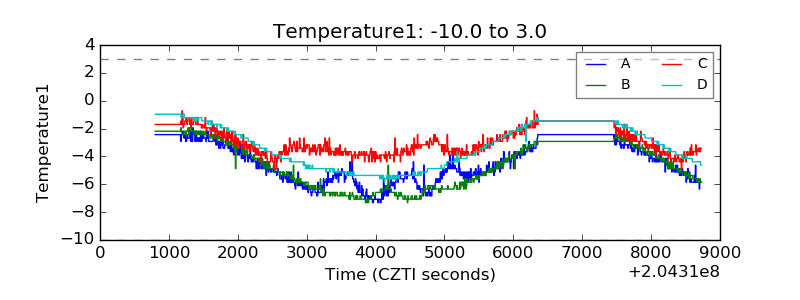 |
| Veto HV Monitor | 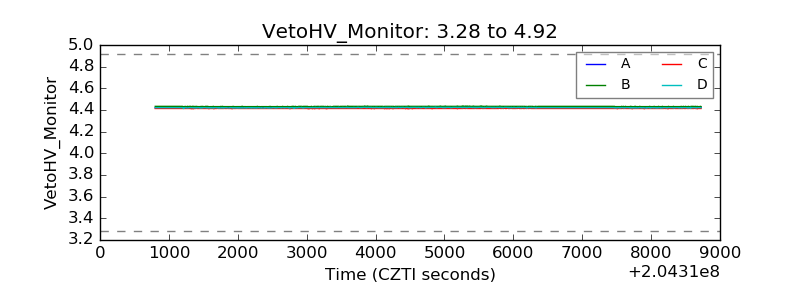 |
| Veto LLD | 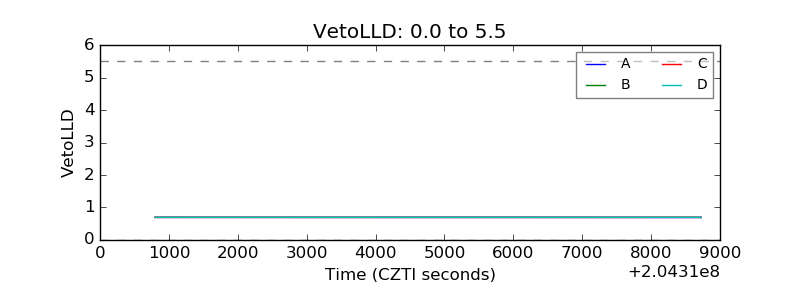 |
| Alpha Counter | 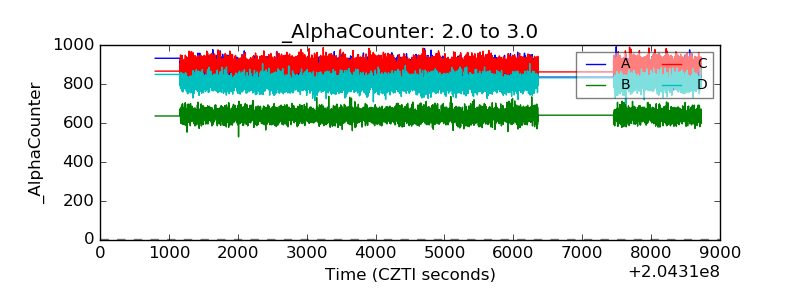 |
| _CPM_Rate | 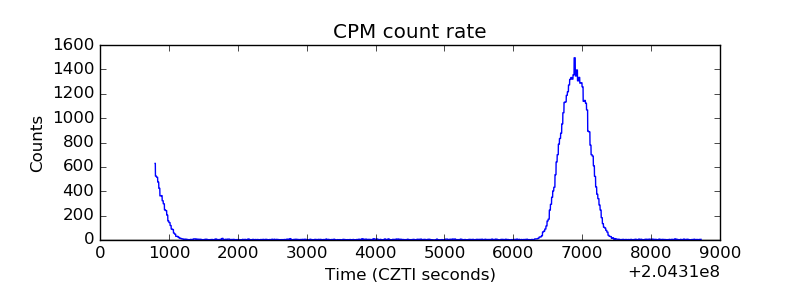 |
| CZT Counter | 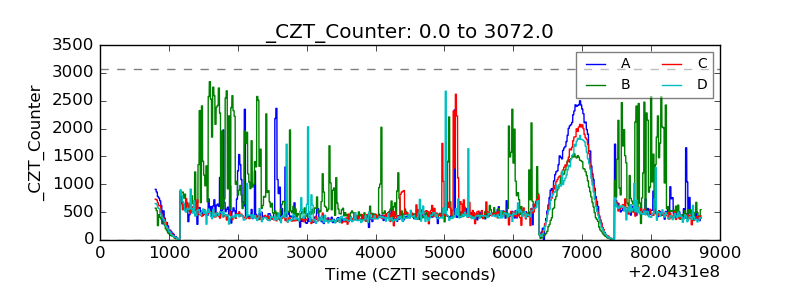 |
| +2.5 Volts monitor |  |
| +5 Volts monitor |  |
| _ROLL_ROT | 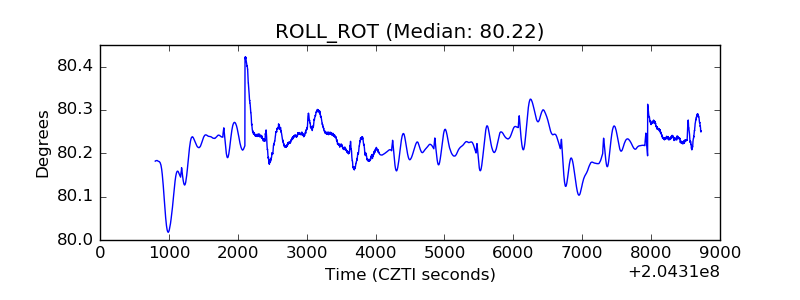 |
| _Roll_DEC | 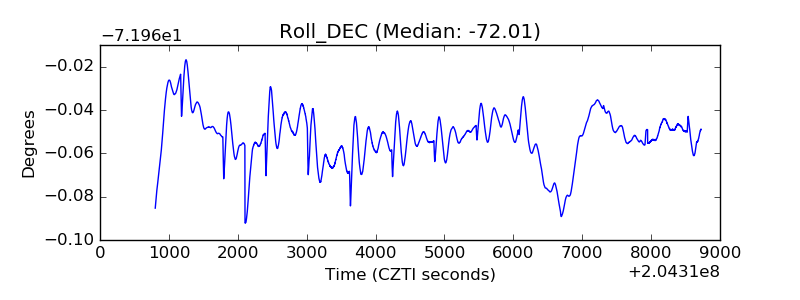 |
| _Roll_RA | 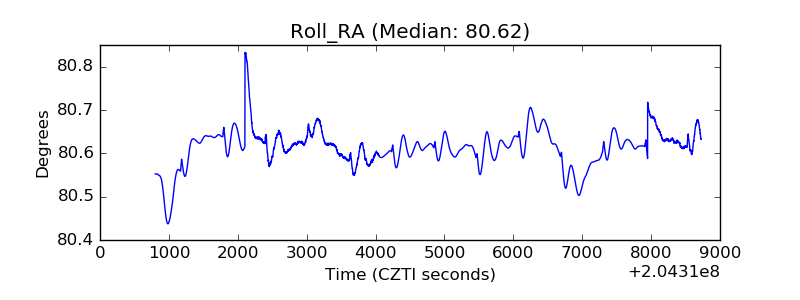 |
| Veto Counter | 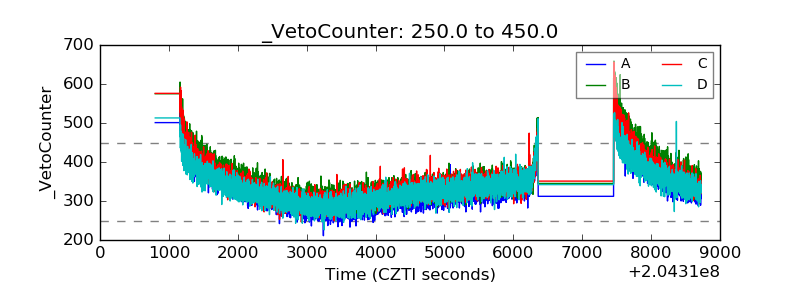 |