| Param | Original file | Final file |
|---|---|---|
| Filename | modeM0/AS1G05_247T01_9000000512_03978cztM0_level2.evt | modeM0/AS1G05_247T01_9000000512_03978cztM0_level2_quad_clean.evt |
| Size (bytes) | 448,447,680 | 103,907,520 |
| Size | 427.7 MB | 99.1 MB |
| Events in quadrant A | 3,046,467 | 693,191 |
| Events in quadrant B | 4,066,432 | 679,259 |
| Events in quadrant C | 2,799,179 | 679,986 |
| Events in quadrant D | 3,242,757 | 656,477 |
| Mode SS | |||
|---|---|---|---|
| Quadrant | BADHDUFLAG | Total packets | Discarded packets |
| A | 0 | 128 | 0 |
| B | 0 | 128 | 0 |
| C | 0 | 128 | 0 |
| D | 0 | 128 | 0 |
| Mode M9 | |||
|---|---|---|---|
| Quadrant | BADHDUFLAG | Total packets | Discarded packets |
| A | 0 | 18 | 0 |
| B | 0 | 18 | 0 |
| C | 0 | 18 | 0 |
| D | 0 | 19 | 0 |
| Mode M0 | |||
|---|---|---|---|
| Quadrant | BADHDUFLAG | Total packets | Discarded packets |
| A | 0 | 13350 | 3 |
| B | 0 | 16345 | 2 |
| C | 0 | 12752 | 2 |
| D | 0 | 14302 | 2 |
| Quadrant | Total seconds | Saturated seconds | Saturation percentage |
|---|---|---|---|
| A | 6271 | 48 | 0.765428% |
| B | 6271 | 339 | 5.405836% |
| C | 6271 | 11 | 0.175411% |
| D | 6271 | 93 | 1.483017% |
Noise dominated data is calculated using 1-second bins in cleaned event files. If a bin has >2000 counts, and if more than 50% of those come from <1% of pixels, then it is considered to be noise-dominated and hence unusable.
| Quadrant | # 1 sec bins | Bins with >0 counts | Bins with >2000 counts | High rate bins dominated by noise | Noise dominated (total time) | Noise dominated (detector-on time) | Marked lightcurve |
|---|---|---|---|---|---|---|---|
| A | 7481 | 6272 | 18 | 18 | 0.24% | 0.29% | 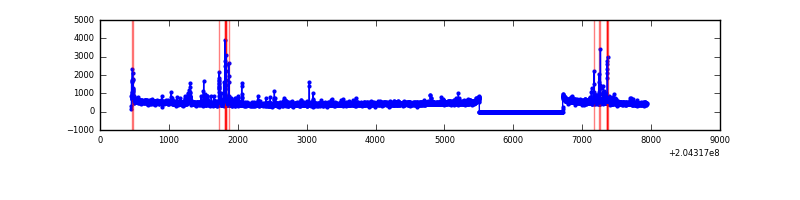 |
| B | 7481 | 6272 | 217 | 217 | 2.90% | 3.46% | 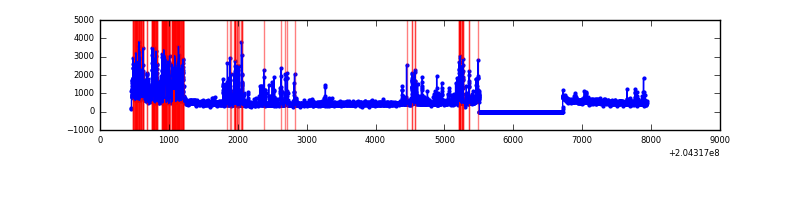 |
| C | 7481 | 6272 | 5 | 5 | 0.07% | 0.08% | 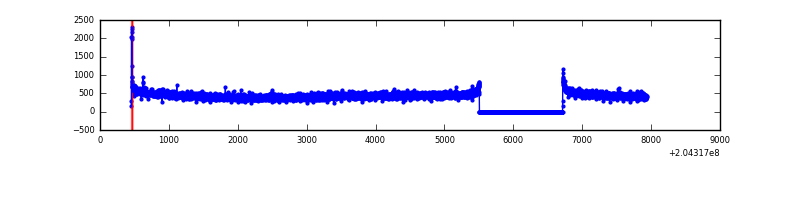 |
| D | 7481 | 6272 | 69 | 69 | 0.92% | 1.10% | 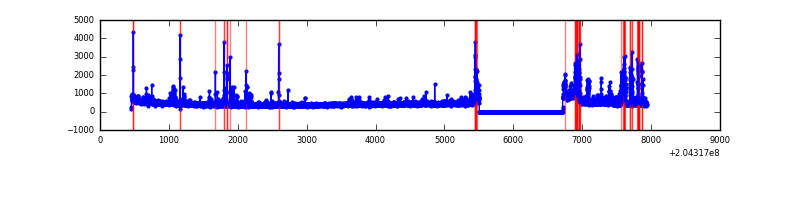 |
Top three noisy pixels from each quadrant. If the there are fewer than three noisy pixels in the level2.evt file, extra rows are filled as -1
| Pixel properties | Quadrant properties | ||||||
|---|---|---|---|---|---|---|---|
| Quadrant | DetID | PixID | Counts | Sigma | Mean | Median | Sigma |
| A | 0 | 50 | 130541 | 882.57 | 726 | 713 | 147.1 |
| A | 0 | 118 | 41421 | 276.73 | 726 | 713 | 147.1 |
| A | 13 | 251 | 30559 | 202.89 | 726 | 713 | 147.1 |
| B | 14 | 167 | 1121954 | 8205.75 | 723 | 708 | 136.6 |
| B | 0 | 229 | 41946 | 301.8 | 723 | 708 | 136.6 |
| B | 15 | 204 | 41445 | 298.13 | 723 | 708 | 136.6 |
| C | 9 | 144 | 34320 | 209.69 | 698 | 701 | 160.3 |
| C | 8 | 128 | 20107 | 121.04 | 698 | 701 | 160.3 |
| C | 8 | 112 | 8459 | 48.39 | 698 | 701 | 160.3 |
| D | 2 | 232 | 342888 | 2077.51 | 691 | 672 | 164.7 |
| D | 7 | 53 | 70379 | 423.17 | 691 | 672 | 164.7 |
| D | 12 | 217 | 52394 | 313.99 | 691 | 672 | 164.7 |
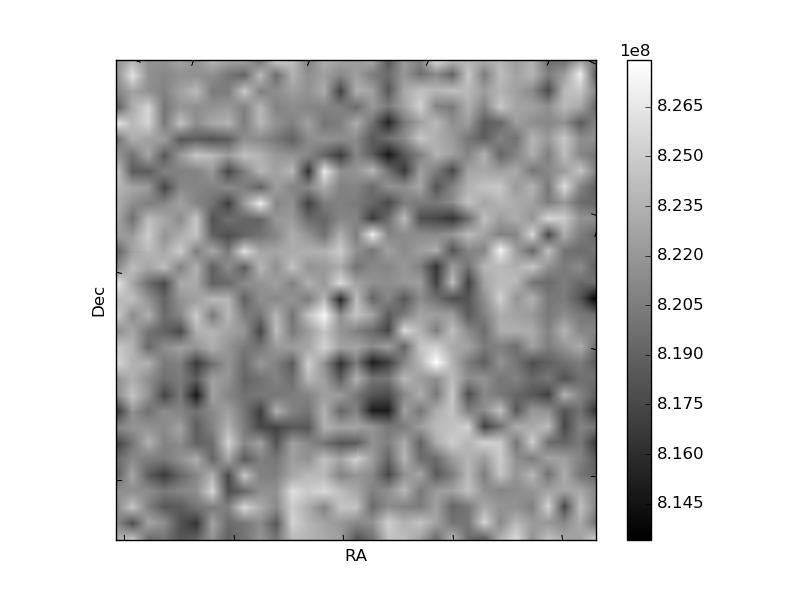
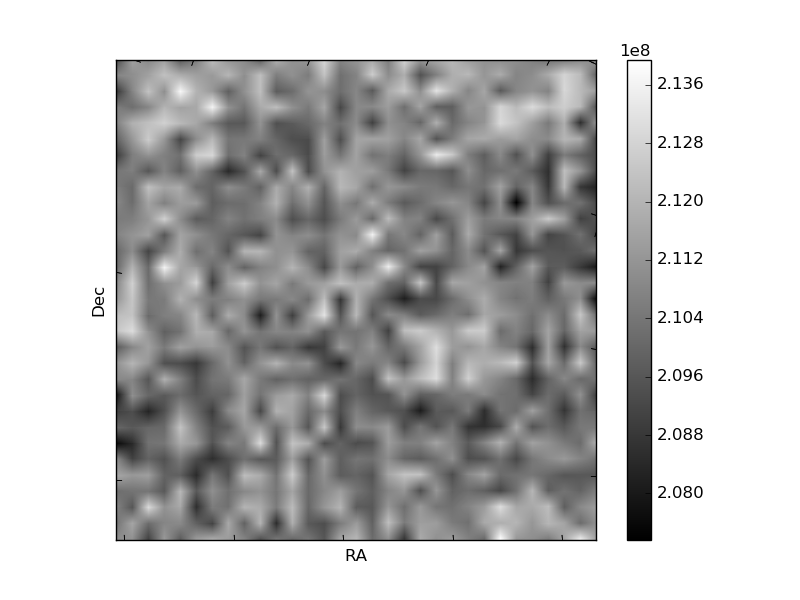
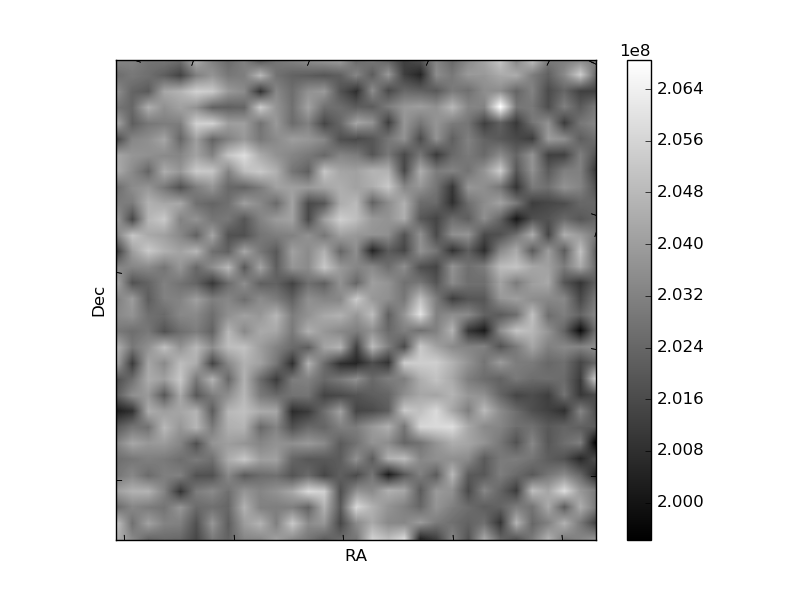
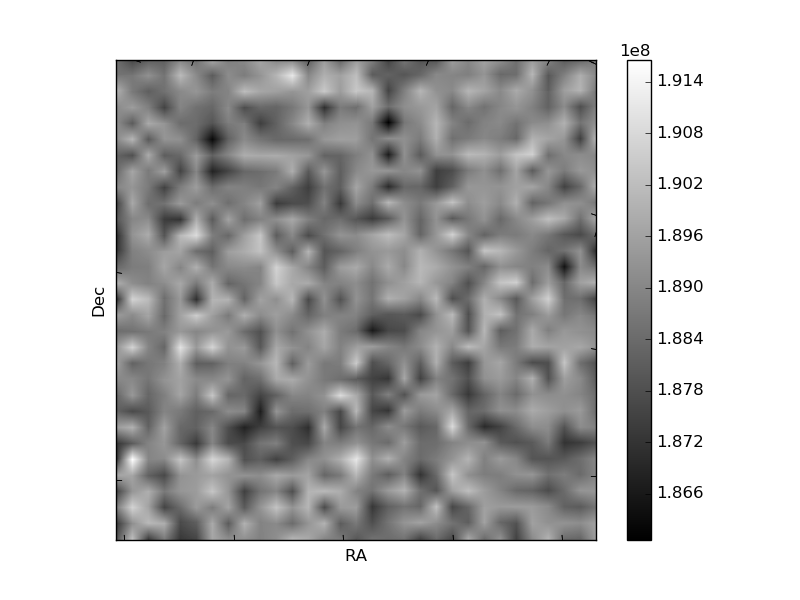
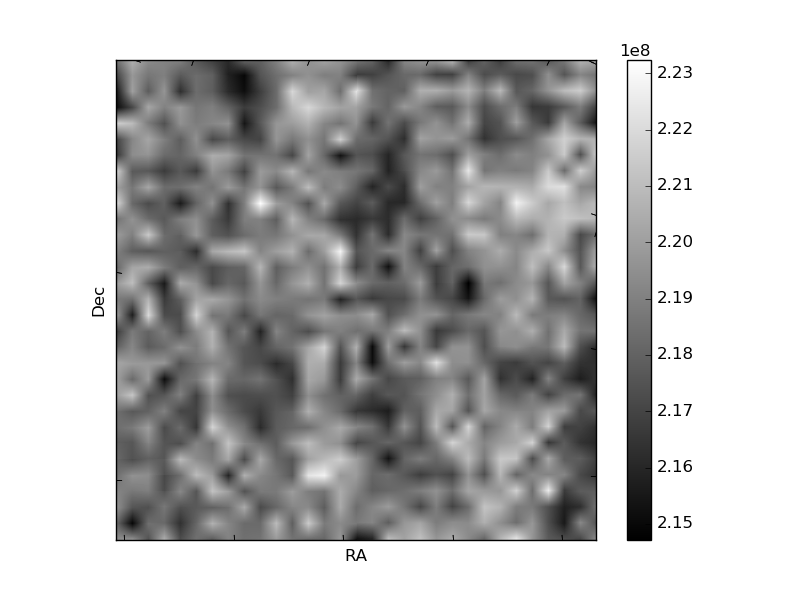
Histogram calculated using DETX and DETY for each event in the final _common_clean file
| Quadrant A | 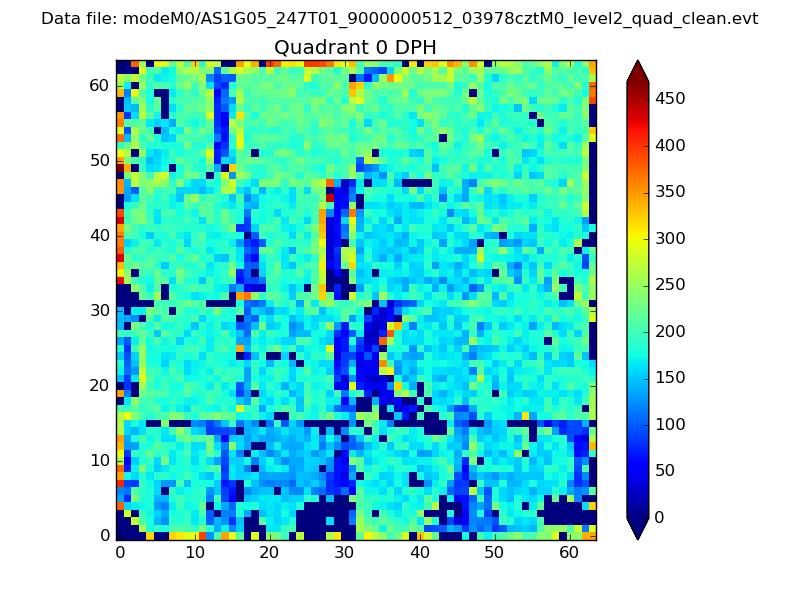 |
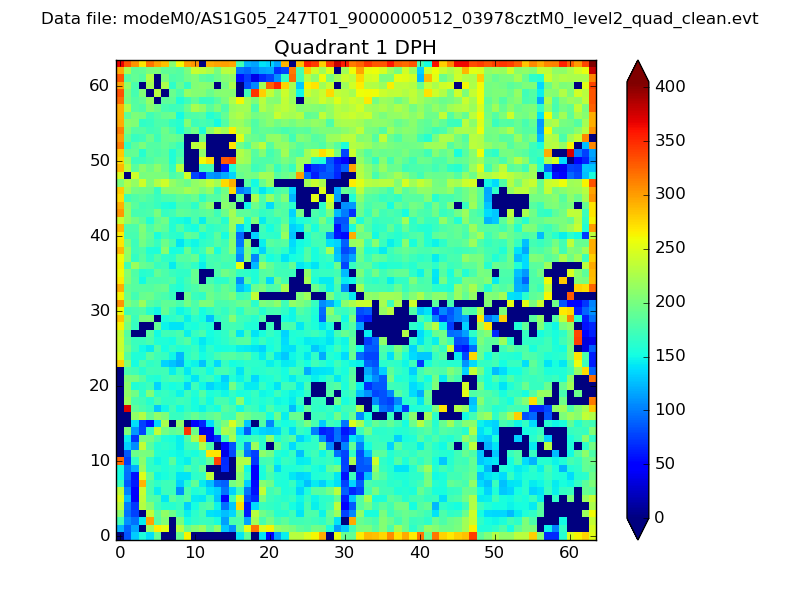 |
Quadrant B |
|---|---|---|---|
| Quadrant D | 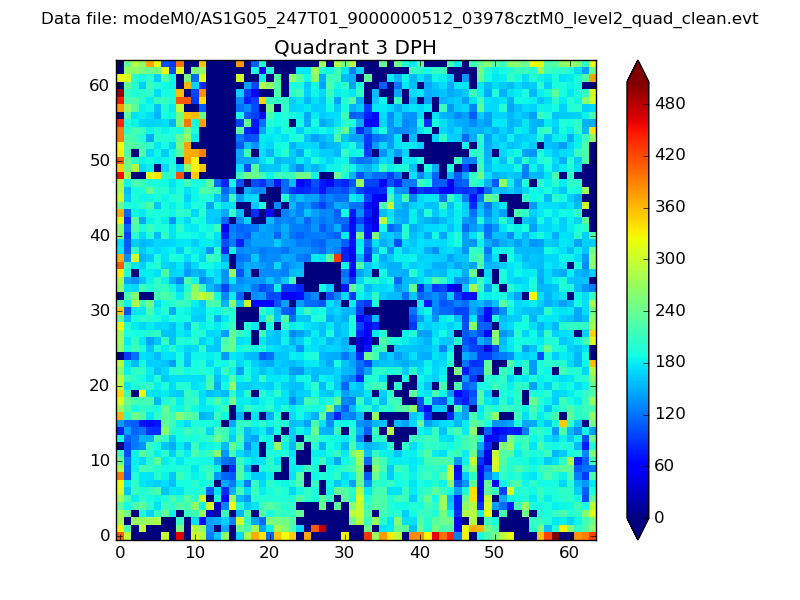 |
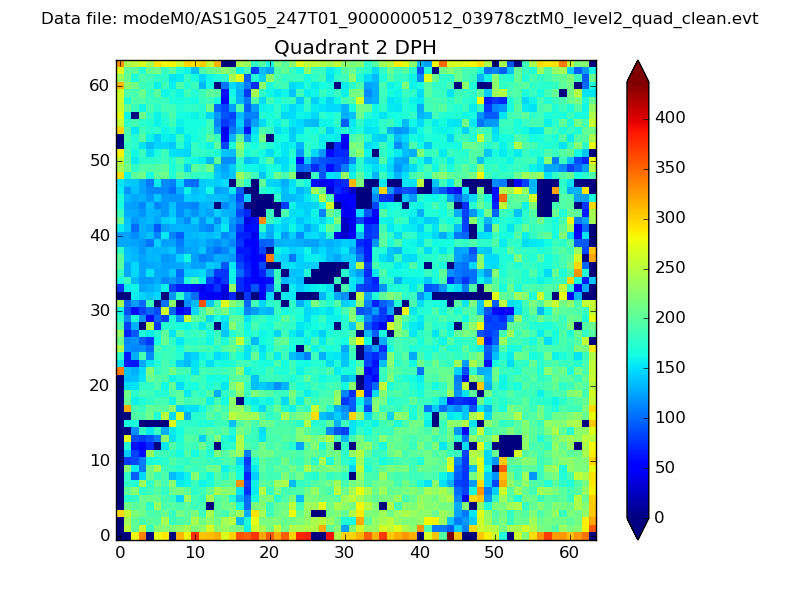 |
Quadrant C |
| Plot type | Count rate plots | Images |
|---|---|---|
| Comparison with Poisson distribution Blue bars denote a histogram of data divided into 1 sec bins. Red curve is a Poisson curve with rate = median count rate of data. |
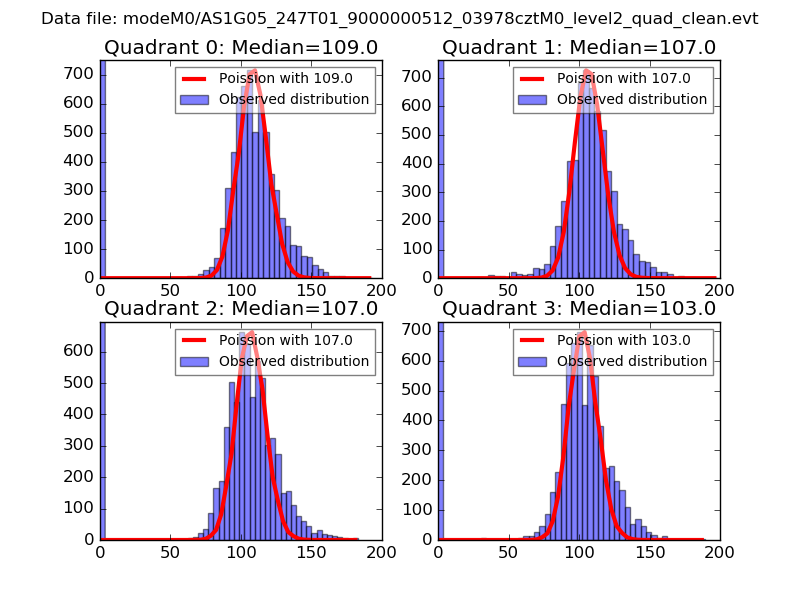 |
 |
| Quadrant-wise count rates Data is divided into 100 sec bins |
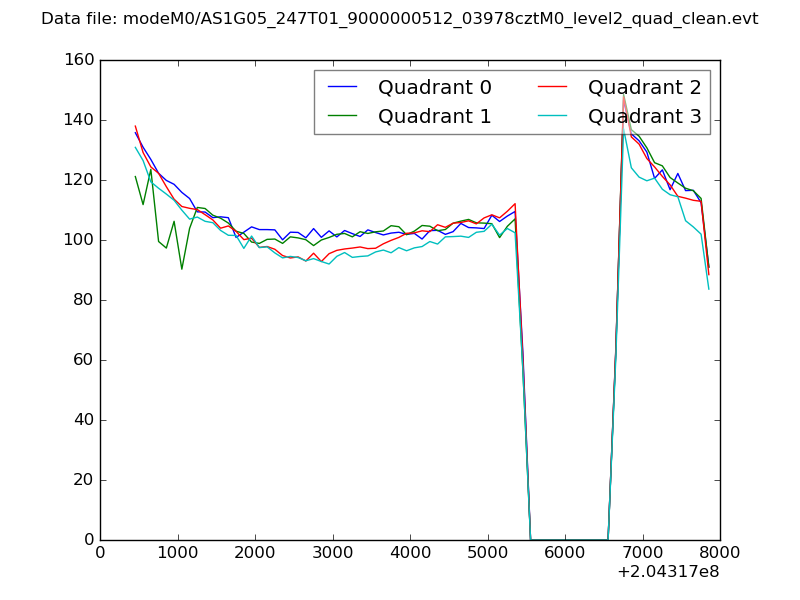 |
|
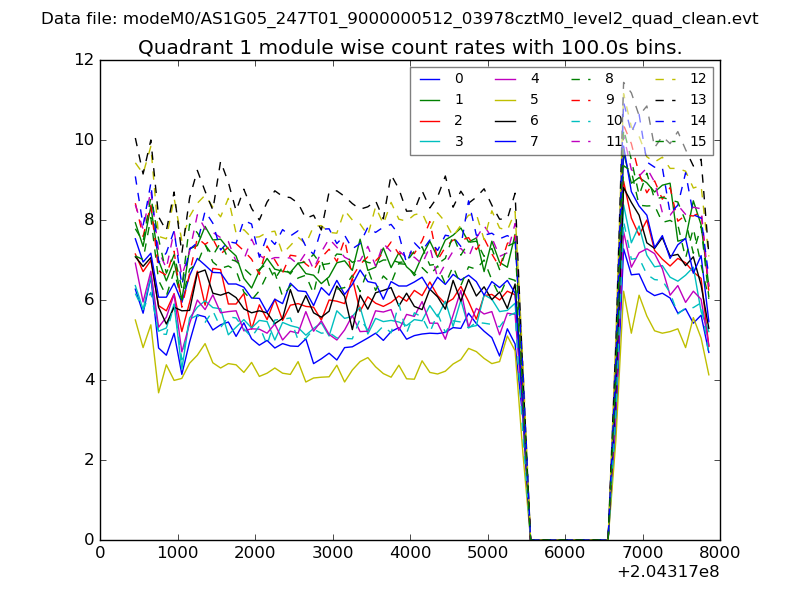
| Module-wise count rates for Quadrant A Data is divided into 100 sec bins |
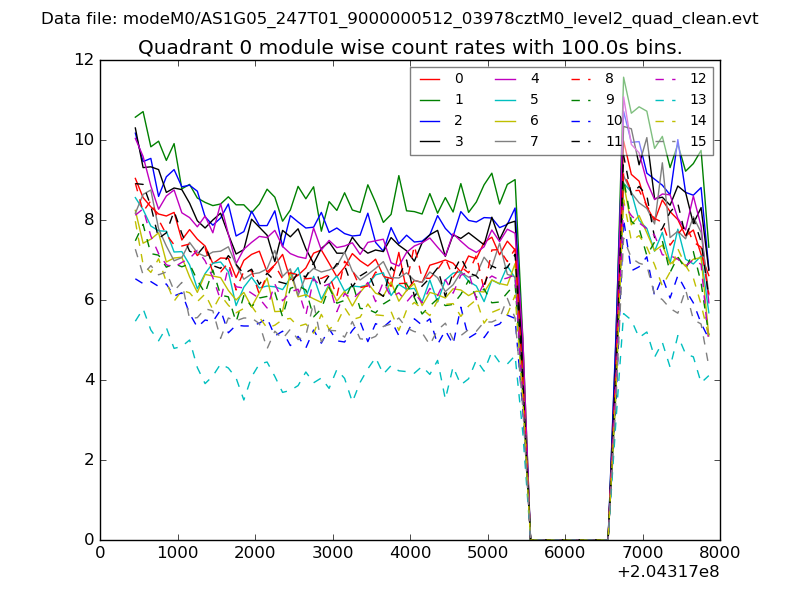 |
 |
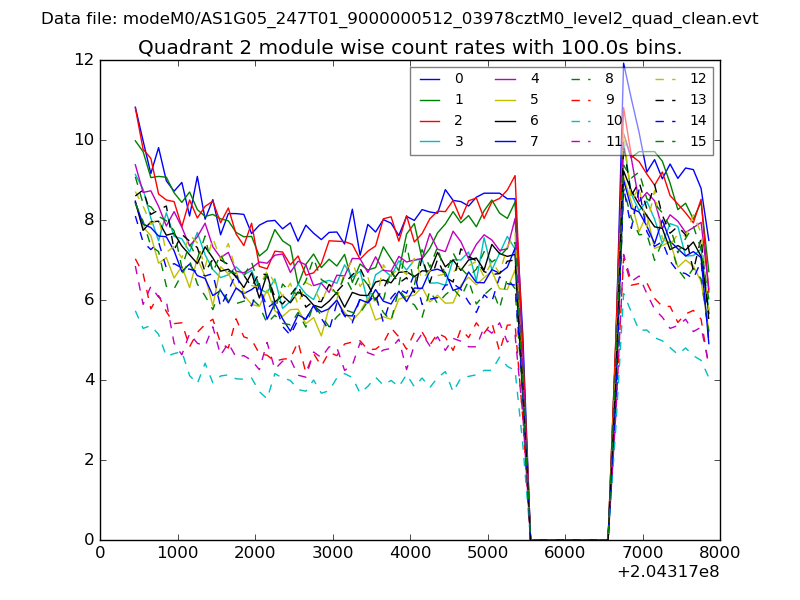
| Module-wise count rates for Quadrant B Data is divided into 100 sec bins |
 |
 |
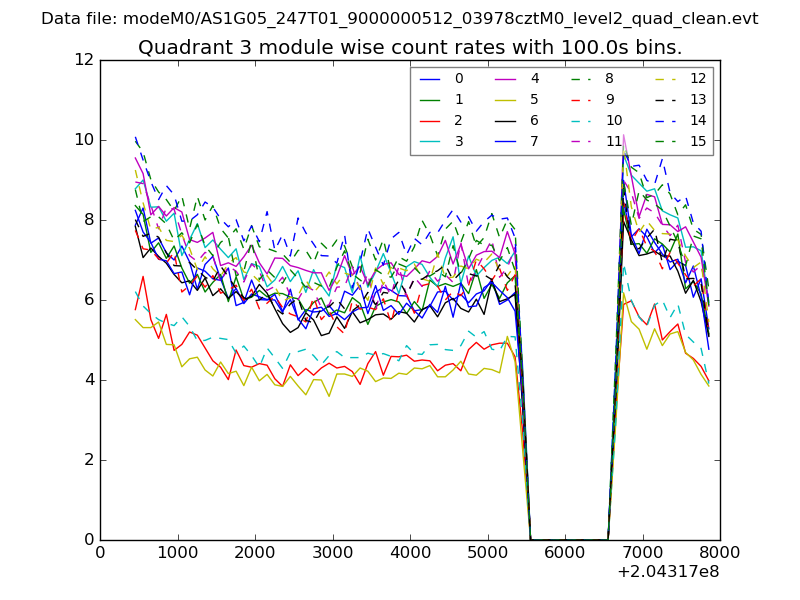
| Module-wise count rates for Quadrant C Data is divided into 100 sec bins |
 |
 |
| Module-wise count rates for Quadrant D Data is divided into 100 sec bins |
 |
 |
| Parameter | Plot |
|---|---|
| CZT HV Monitor | 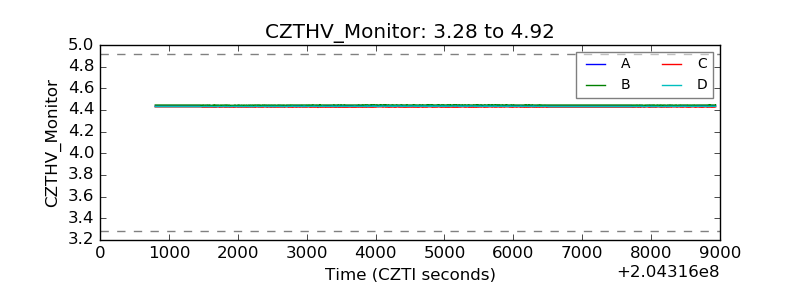 |
| D_VDD | 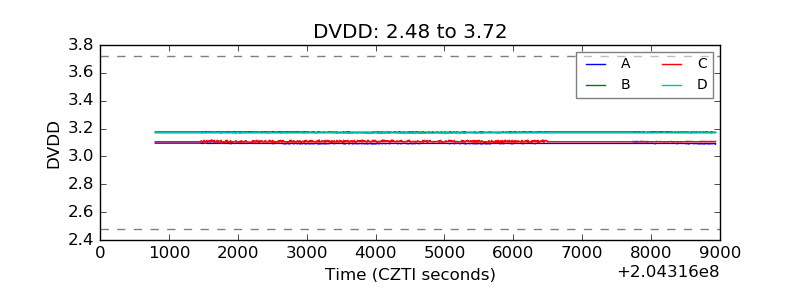 |
| Temperature 1 | 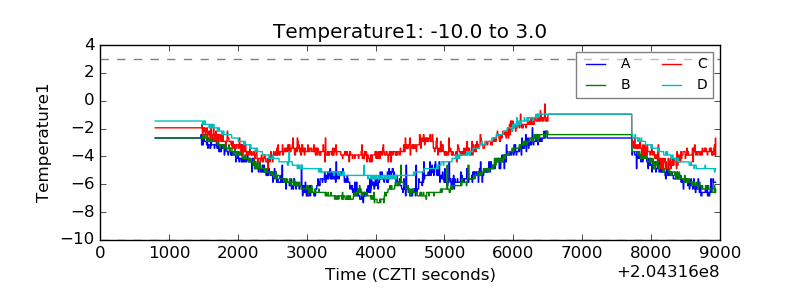 |
| Veto HV Monitor | 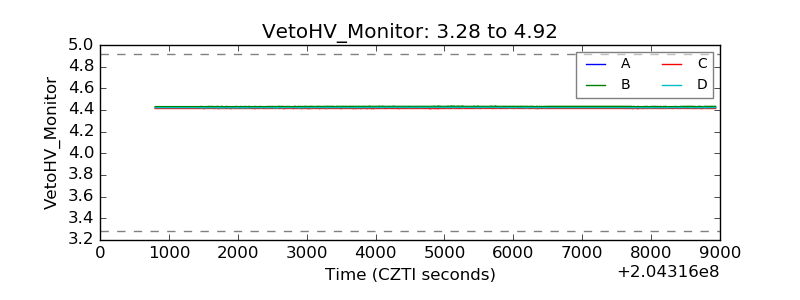 |
| Veto LLD |  |
| Alpha Counter | 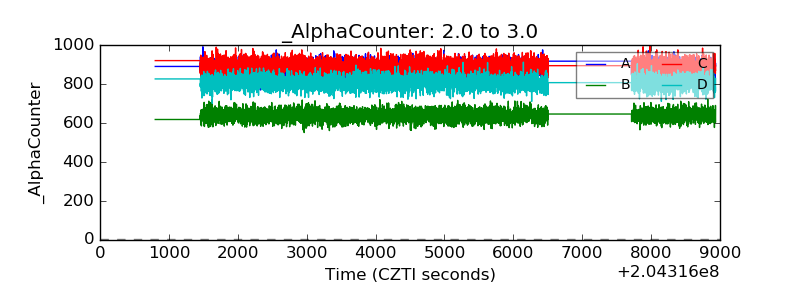 |
| _CPM_Rate | 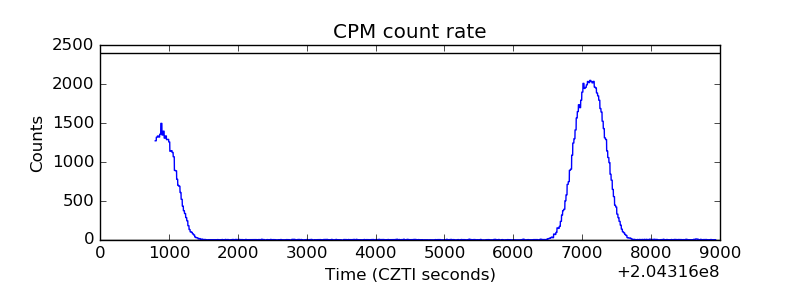 |
| CZT Counter | 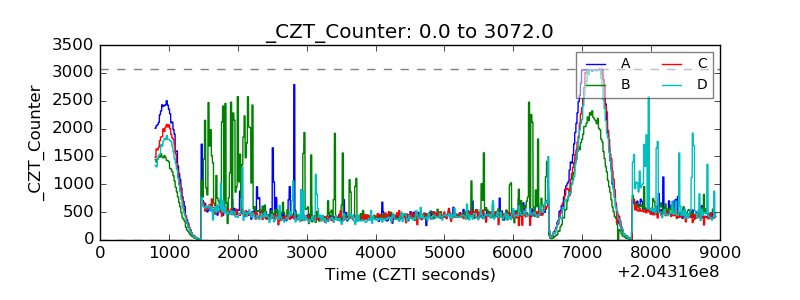 |
| +2.5 Volts monitor |  |
| +5 Volts monitor |  |
| _ROLL_ROT | 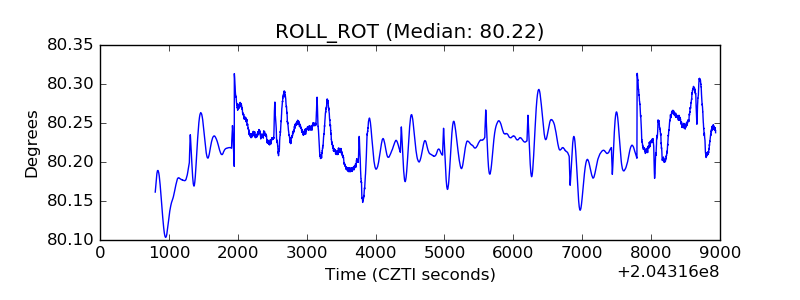 |
| _Roll_DEC | 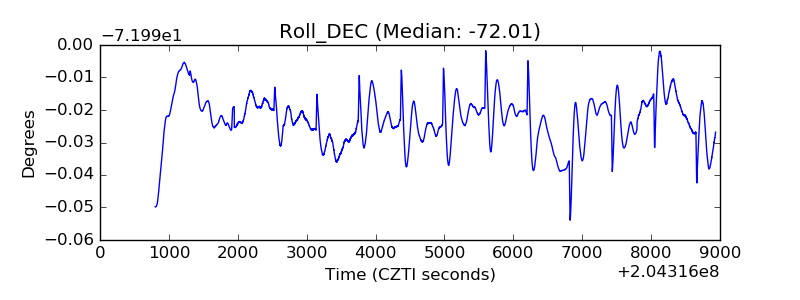 |
| _Roll_RA | 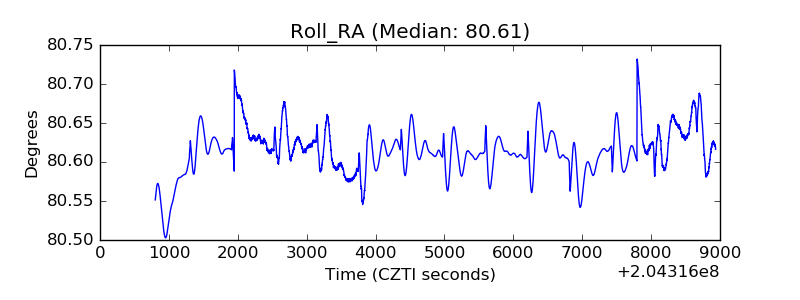 |
| Veto Counter | 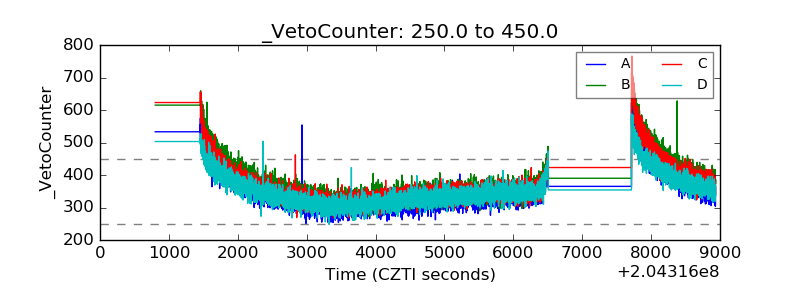 |