| Param | Original file | Final file |
|---|---|---|
| Filename | modeM0/AS1G05_247T01_9000000512_03979cztM0_level2.evt | modeM0/AS1G05_247T01_9000000512_03979cztM0_level2_quad_clean.evt |
| Size (bytes) | 461,531,520 | 107,262,720 |
| Size | 440.2 MB | 102.3 MB |
| Events in quadrant A | 3,294,352 | 712,995 |
| Events in quadrant B | 4,012,221 | 715,155 |
| Events in quadrant C | 2,793,838 | 707,841 |
| Events in quadrant D | 3,452,672 | 676,386 |
| Mode SS | |||
|---|---|---|---|
| Quadrant | BADHDUFLAG | Total packets | Discarded packets |
| A | 0 | 126 | 0 |
| B | 0 | 126 | 0 |
| C | 0 | 126 | 0 |
| D | 0 | 126 | 0 |
| Mode M9 | |||
|---|---|---|---|
| Quadrant | BADHDUFLAG | Total packets | Discarded packets |
| A | 0 | 19 | 0 |
| B | 0 | 19 | 0 |
| C | 0 | 19 | 0 |
| D | 0 | 20 | 0 |
| Mode M0 | |||
|---|---|---|---|
| Quadrant | BADHDUFLAG | Total packets | Discarded packets |
| A | 0 | 13998 | 3 |
| B | 0 | 16046 | 2 |
| C | 0 | 12685 | 2 |
| D | 0 | 14740 | 2 |
| Quadrant | Total seconds | Saturated seconds | Saturation percentage |
|---|---|---|---|
| A | 6244 | 96 | 1.537476% |
| B | 6244 | 232 | 3.715567% |
| C | 6244 | 20 | 0.320307% |
| D | 6244 | 121 | 1.937860% |
Noise dominated data is calculated using 1-second bins in cleaned event files. If a bin has >2000 counts, and if more than 50% of those come from <1% of pixels, then it is considered to be noise-dominated and hence unusable.
| Quadrant | # 1 sec bins | Bins with >0 counts | Bins with >2000 counts | High rate bins dominated by noise | Noise dominated (total time) | Noise dominated (detector-on time) | Marked lightcurve |
|---|---|---|---|---|---|---|---|
| A | 7504 | 6245 | 46 | 46 | 0.61% | 0.74% | 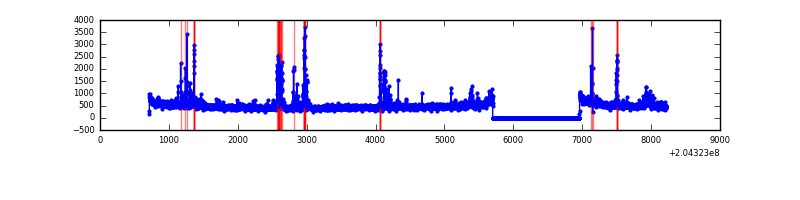 |
| B | 7504 | 6245 | 138 | 138 | 1.84% | 2.21% | 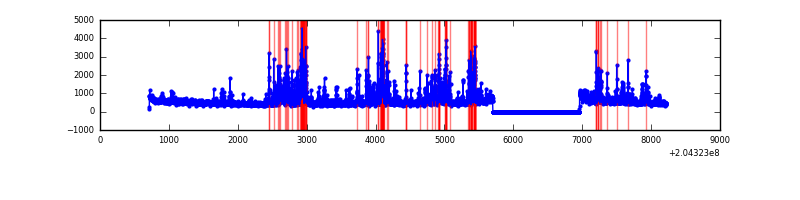 |
| C | 7504 | 6245 | 0 | 0 | 0.00% | 0.00% | 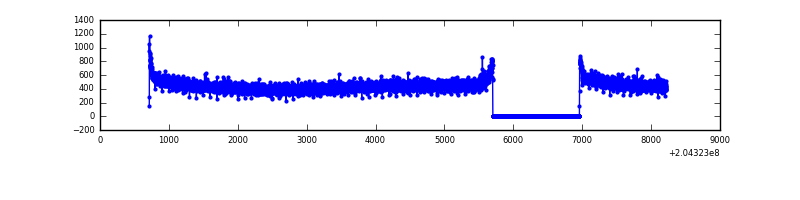 |
| D | 7504 | 6245 | 76 | 76 | 1.01% | 1.22% | 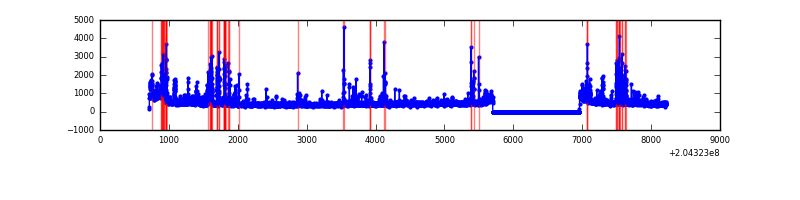 |
Top three noisy pixels from each quadrant. If the there are fewer than three noisy pixels in the level2.evt file, extra rows are filled as -1
| Pixel properties | Quadrant properties | ||||||
|---|---|---|---|---|---|---|---|
| Quadrant | DetID | PixID | Counts | Sigma | Mean | Median | Sigma |
| A | 0 | 50 | 220486 | 1482.16 | 734 | 719 | 148.3 |
| A | 0 | 118 | 62708 | 418.07 | 734 | 719 | 148.3 |
| A | 15 | 236 | 62155 | 414.34 | 734 | 719 | 148.3 |
| B | 14 | 167 | 938752 | 6762.98 | 741 | 724 | 138.7 |
| B | 4 | 81 | 78667 | 561.95 | 741 | 724 | 138.7 |
| B | 3 | 0 | 40285 | 285.23 | 741 | 724 | 138.7 |
| C | 13 | 61 | 6124 | 33.47 | 712 | 715 | 161.6 |
| C | 7 | 206 | 4861 | 25.65 | 712 | 715 | 161.6 |
| C | 9 | 144 | 4004 | 20.35 | 712 | 715 | 161.6 |
| D | 2 | 232 | 448334 | 2640.87 | 704 | 682 | 169.5 |
| D | 7 | 53 | 69616 | 406.67 | 704 | 682 | 169.5 |
| D | 13 | 248 | 61469 | 358.61 | 704 | 682 | 169.5 |
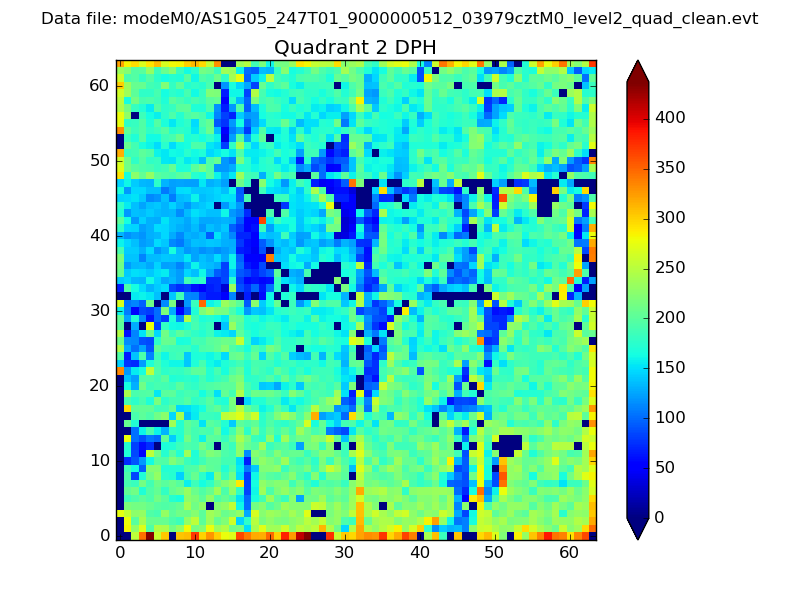
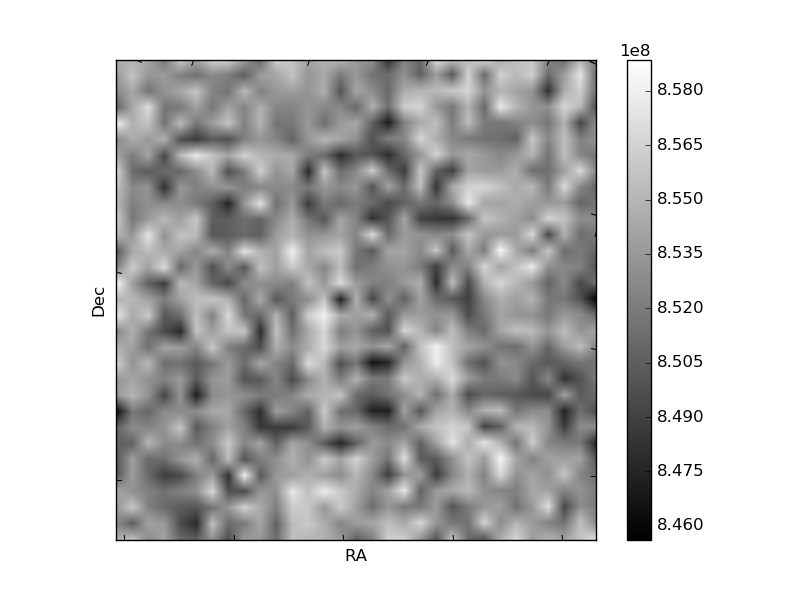
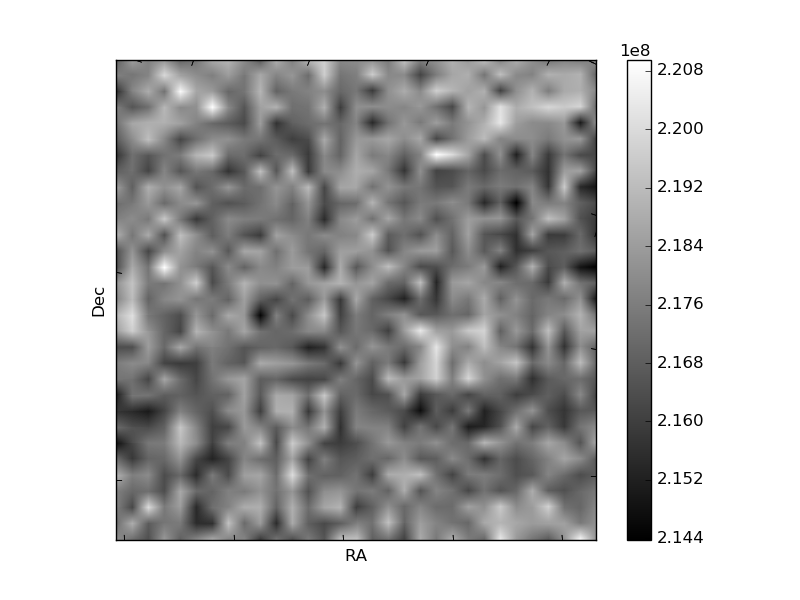
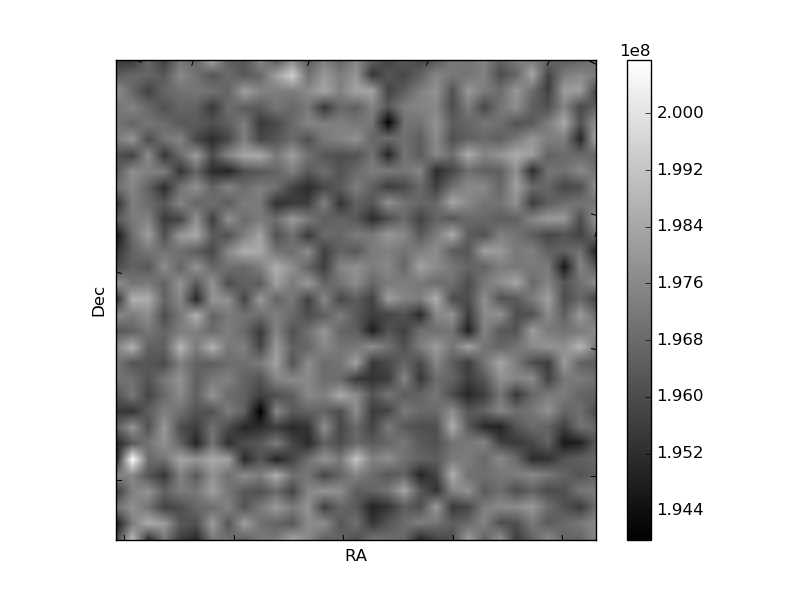
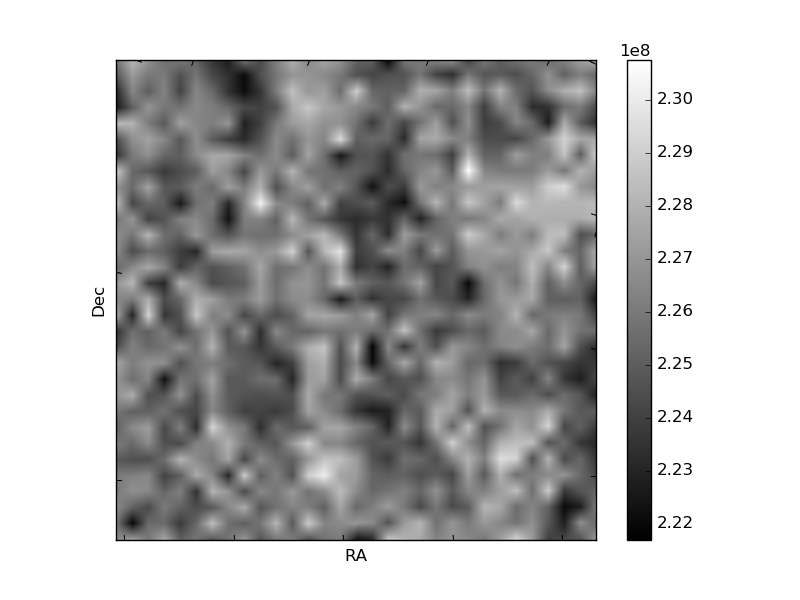
Histogram calculated using DETX and DETY for each event in the final _common_clean file
| Quadrant A | 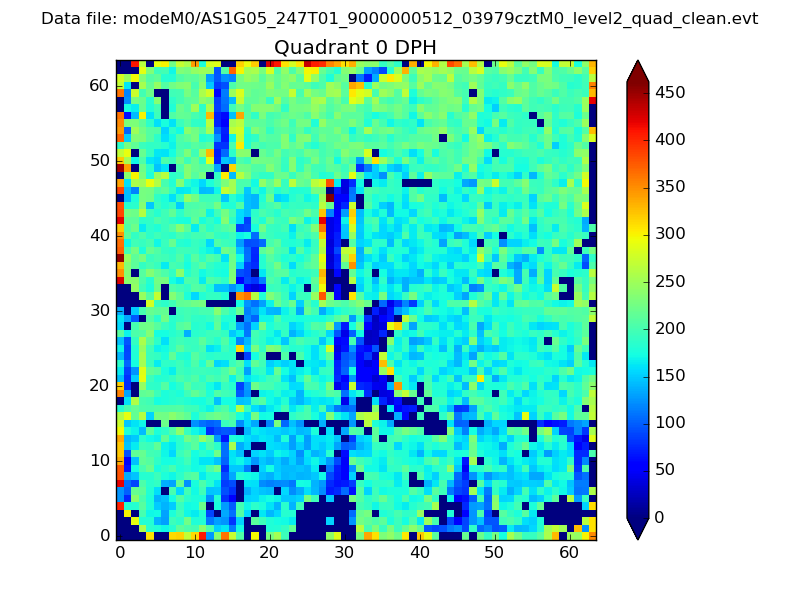 |
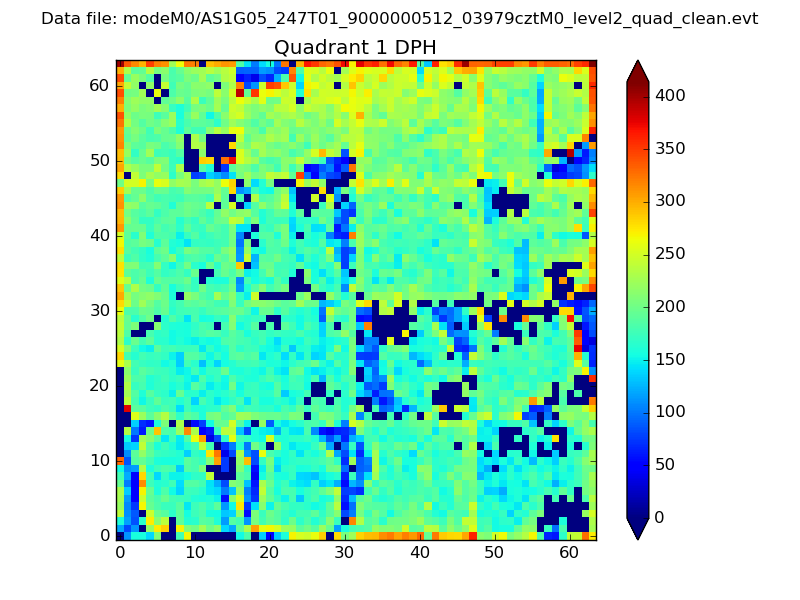 |
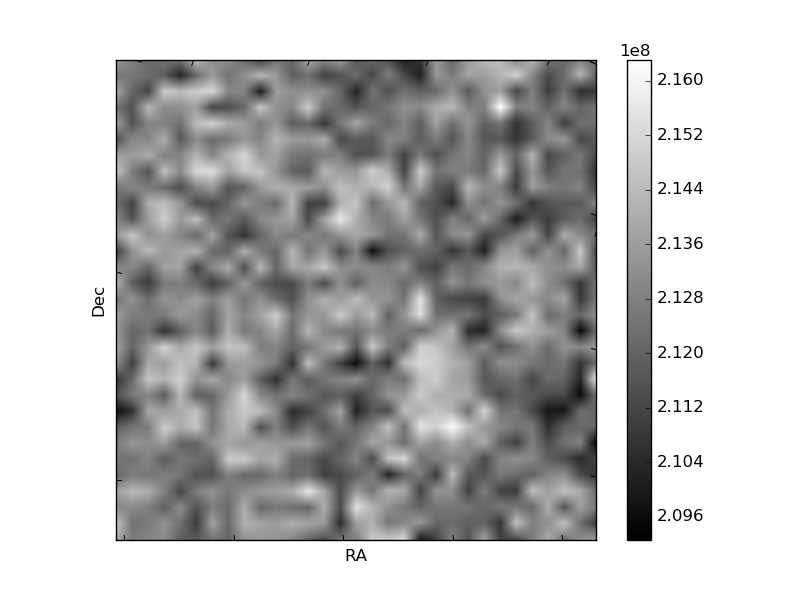
Quadrant B |
|---|---|---|---|
| Quadrant D | 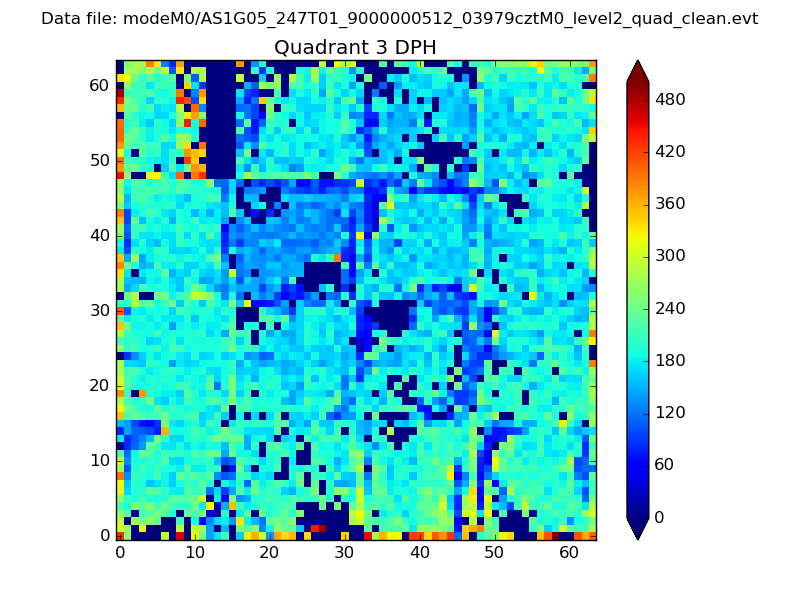 |
 |
Quadrant C |
| Plot type | Count rate plots | Images |
|---|---|---|
| Comparison with Poisson distribution Blue bars denote a histogram of data divided into 1 sec bins. Red curve is a Poisson curve with rate = median count rate of data. |
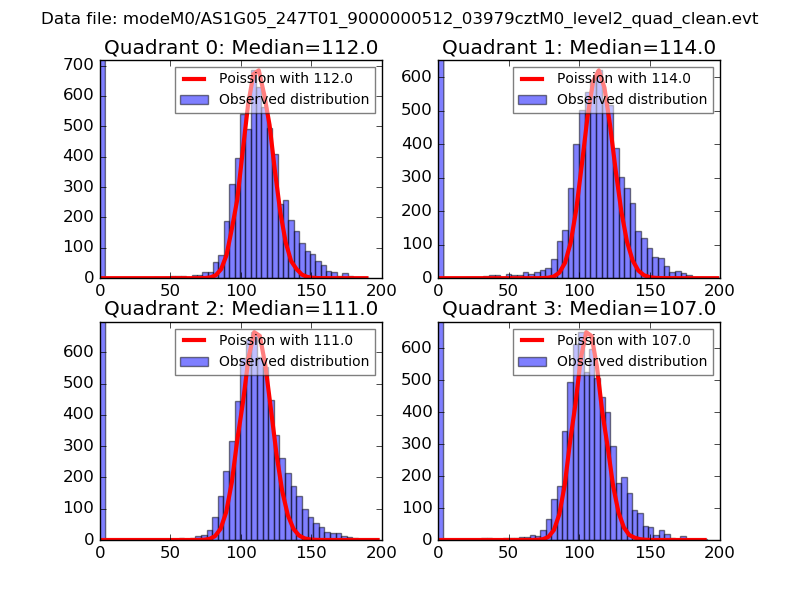 |
 |
| Quadrant-wise count rates Data is divided into 100 sec bins |
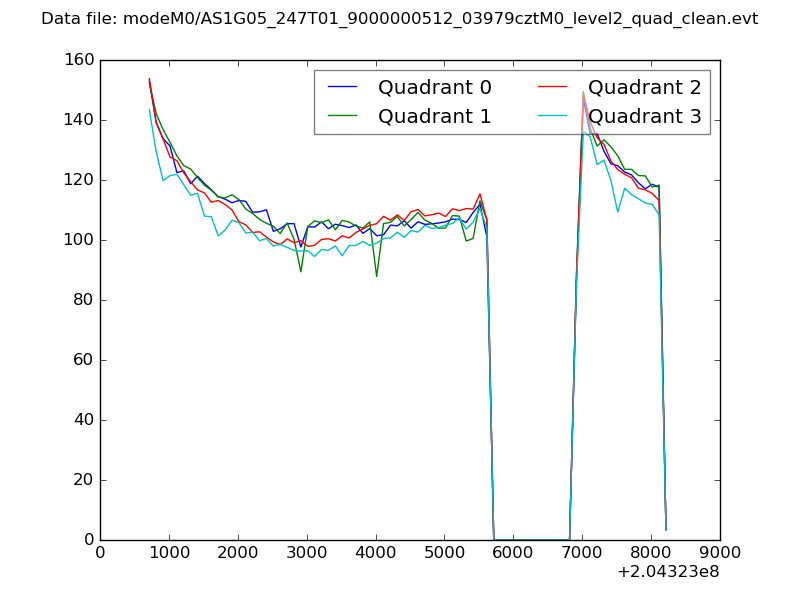 |
|
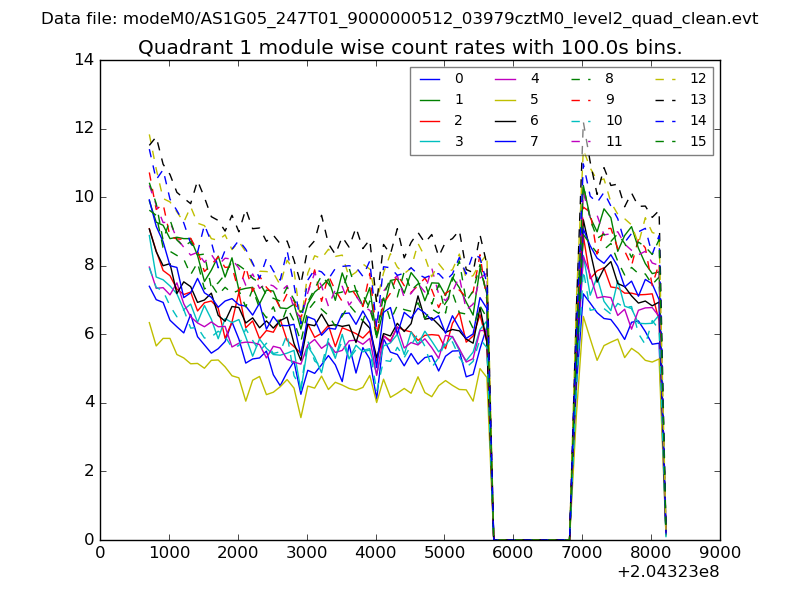
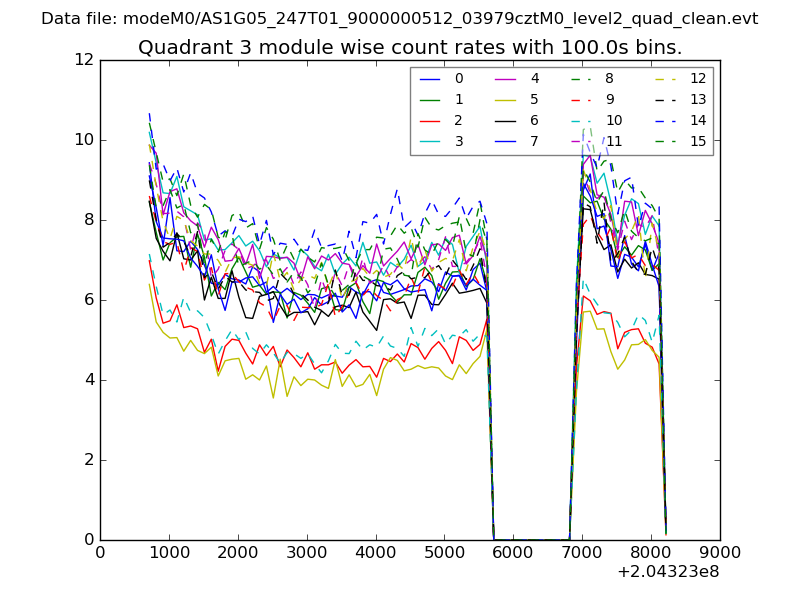
| Module-wise count rates for Quadrant A Data is divided into 100 sec bins |
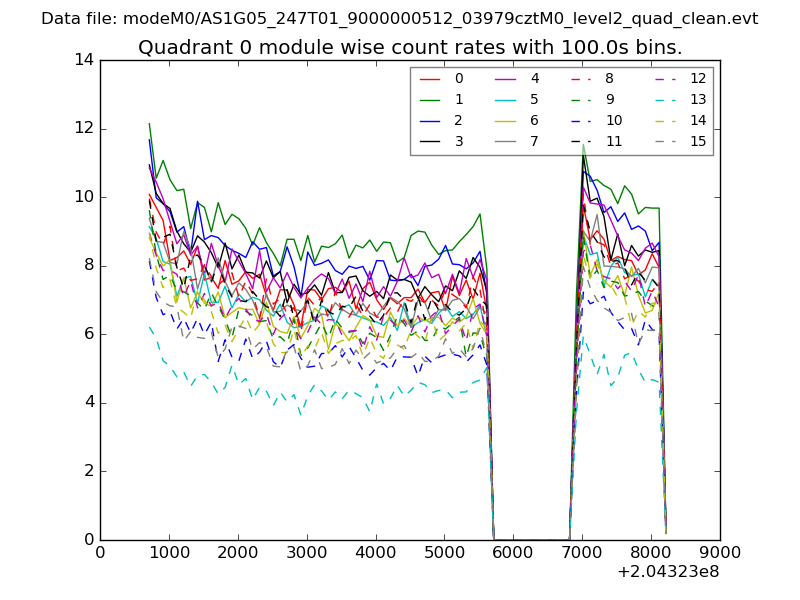 |
 |
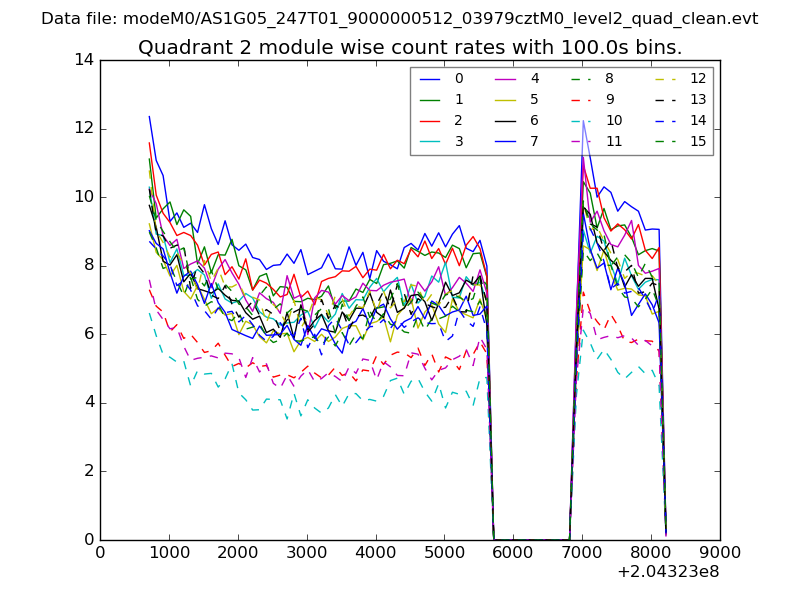
| Module-wise count rates for Quadrant B Data is divided into 100 sec bins |
 |
 |
| Module-wise count rates for Quadrant C Data is divided into 100 sec bins |
 |
 |
| Module-wise count rates for Quadrant D Data is divided into 100 sec bins |
 |
 |
| Parameter | Plot |
|---|---|
| CZT HV Monitor | 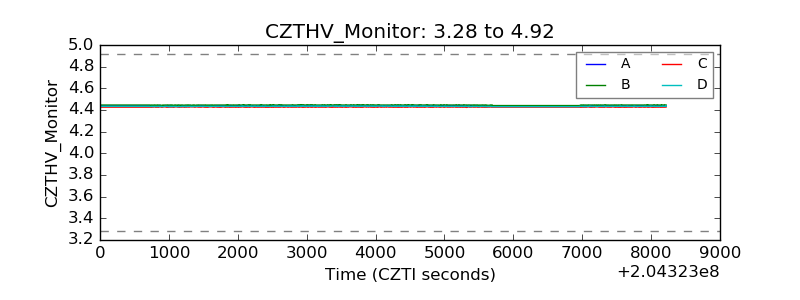 |
| D_VDD | 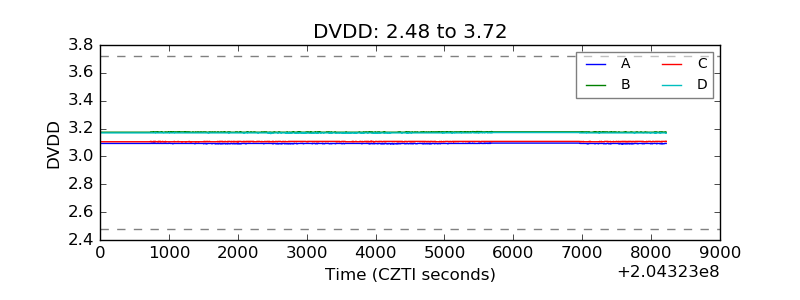 |
| Temperature 1 | 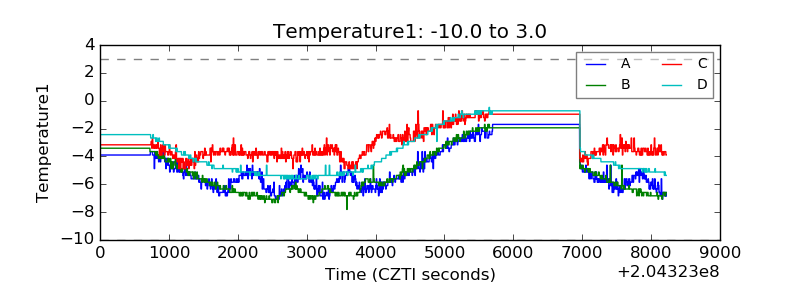 |
| Veto HV Monitor |  |
| Veto LLD | 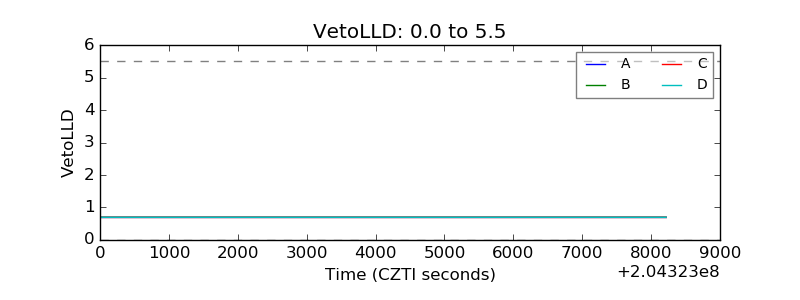 |
| Alpha Counter | 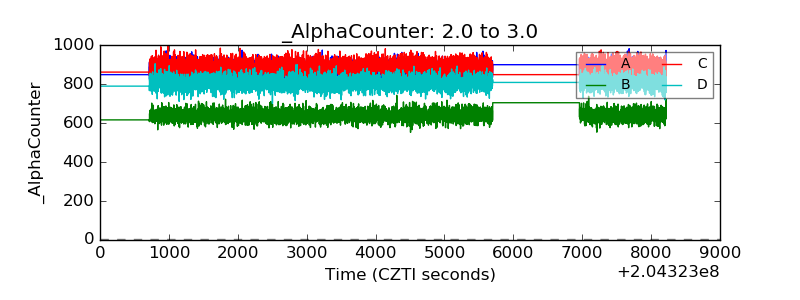 |
| _CPM_Rate | 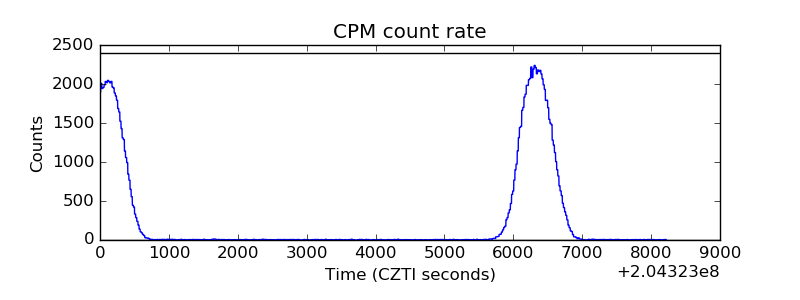 |
| CZT Counter | 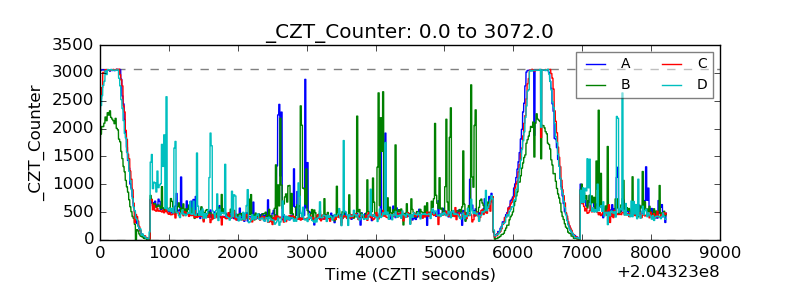 |
| +2.5 Volts monitor |  |
| +5 Volts monitor |  |
| _ROLL_ROT | 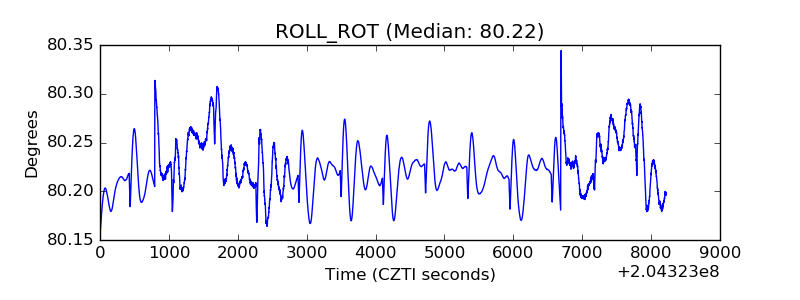 |
| _Roll_DEC | 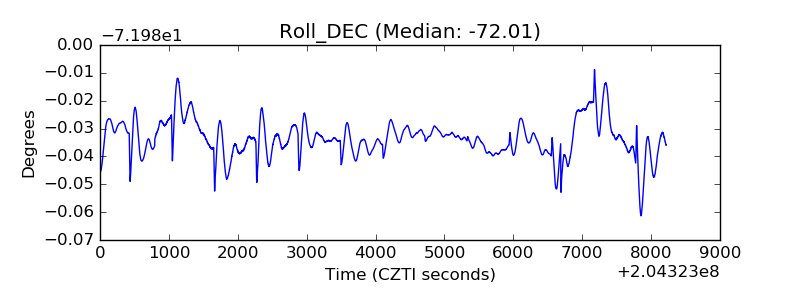 |
| _Roll_RA | 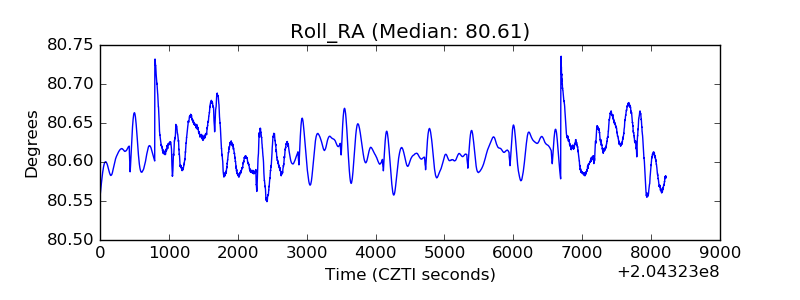 |
| Veto Counter | 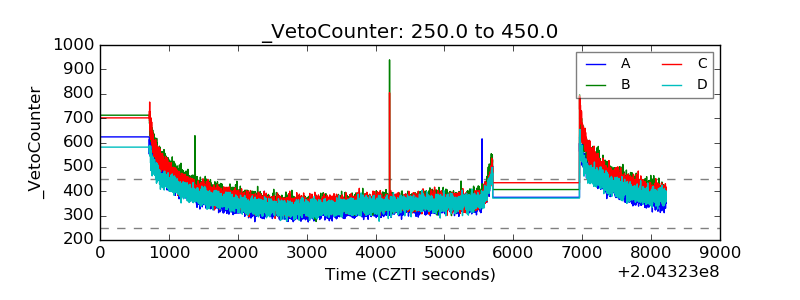 |