| Param | Original file | Final file |
|---|---|---|
| Filename | modeM0/AS1G05_247T01_9000000512_03981cztM0_level2.evt | modeM0/AS1G05_247T01_9000000512_03981cztM0_level2_quad_clean.evt |
| Size (bytes) | 475,312,320 | 111,288,960 |
| Size | 453.3 MB | 106.1 MB |
| Events in quadrant A | 4,121,539 | 719,836 |
| Events in quadrant B | 3,725,929 | 743,621 |
| Events in quadrant C | 2,962,159 | 737,592 |
| Events in quadrant D | 3,136,923 | 709,180 |
| Mode SS | |||
|---|---|---|---|
| Quadrant | BADHDUFLAG | Total packets | Discarded packets |
| A | 0 | 134 | 0 |
| B | 0 | 134 | 0 |
| C | 0 | 134 | 0 |
| D | 0 | 134 | 0 |
| Mode M9 | |||
|---|---|---|---|
| Quadrant | BADHDUFLAG | Total packets | Discarded packets |
| A | 0 | 23 | 0 |
| B | 0 | 23 | 0 |
| C | 0 | 23 | 0 |
| D | 0 | 24 | 0 |
| Mode M0 | |||
|---|---|---|---|
| Quadrant | BADHDUFLAG | Total packets | Discarded packets |
| A | 0 | 16749 | 3 |
| B | 0 | 15410 | 2 |
| C | 0 | 13372 | 2 |
| D | 0 | 14137 | 2 |
| Quadrant | Total seconds | Saturated seconds | Saturation percentage |
|---|---|---|---|
| A | 6597 | 486 | 7.366985% |
| B | 6597 | 123 | 1.864484% |
| C | 6597 | 17 | 0.257693% |
| D | 6597 | 35 | 0.530544% |
Noise dominated data is calculated using 1-second bins in cleaned event files. If a bin has >2000 counts, and if more than 50% of those come from <1% of pixels, then it is considered to be noise-dominated and hence unusable.
| Quadrant | # 1 sec bins | Bins with >0 counts | Bins with >2000 counts | High rate bins dominated by noise | Noise dominated (total time) | Noise dominated (detector-on time) | Marked lightcurve |
|---|---|---|---|---|---|---|---|
| A | 7887 | 6598 | 348 | 348 | 4.41% | 5.27% | 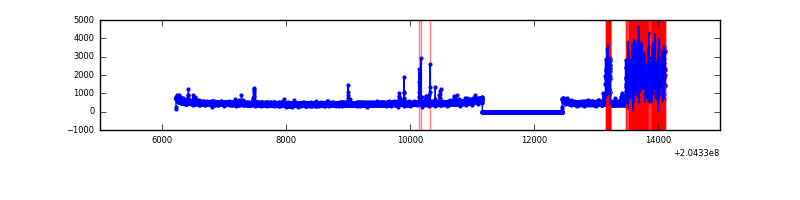 |
| B | 7887 | 6598 | 49 | 49 | 0.62% | 0.74% | 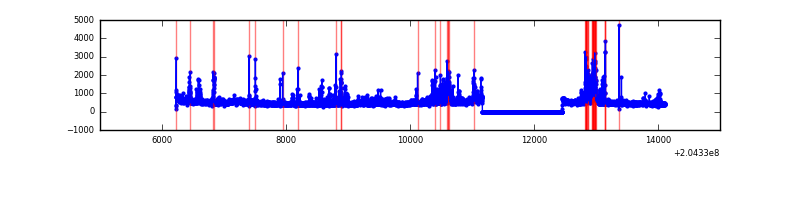 |
| C | 7887 | 6598 | 1 | 1 | 0.01% | 0.02% | 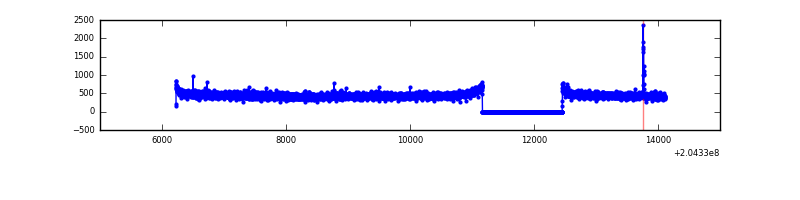 |
| D | 7887 | 6598 | 16 | 16 | 0.20% | 0.24% | 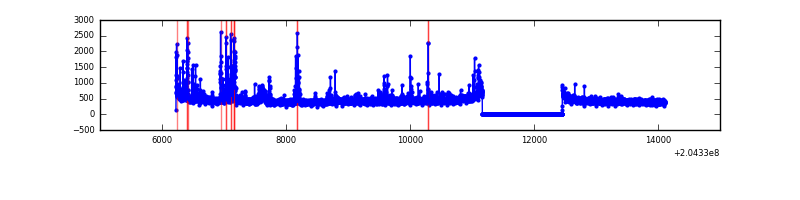 |
Top three noisy pixels from each quadrant. If the there are fewer than three noisy pixels in the level2.evt file, extra rows are filled as -1
| Pixel properties | Quadrant properties | ||||||
|---|---|---|---|---|---|---|---|
| Quadrant | DetID | PixID | Counts | Sigma | Mean | Median | Sigma |
| A | 0 | 50 | 1188129 | 7983.49 | 742 | 727 | 148.7 |
| A | 0 | 118 | 33601 | 221.03 | 742 | 727 | 148.7 |
| A | 8 | 15 | 21927 | 142.54 | 742 | 727 | 148.7 |
| B | 14 | 167 | 332359 | 2290.79 | 773 | 755 | 144.8 |
| B | 4 | 81 | 211377 | 1455.02 | 773 | 755 | 144.8 |
| B | 7 | 252 | 61630 | 420.54 | 773 | 755 | 144.8 |
| C | 9 | 144 | 24562 | 138.79 | 751 | 755 | 171.5 |
| C | 13 | 61 | 6437 | 33.12 | 751 | 755 | 171.5 |
| C | 7 | 202 | 2920 | 12.62 | 751 | 755 | 171.5 |
| D | 12 | 233 | 114939 | 650.01 | 741 | 721 | 175.7 |
| D | 2 | 232 | 68314 | 384.67 | 741 | 721 | 175.7 |
| D | 9 | 82 | 39938 | 223.18 | 741 | 721 | 175.7 |
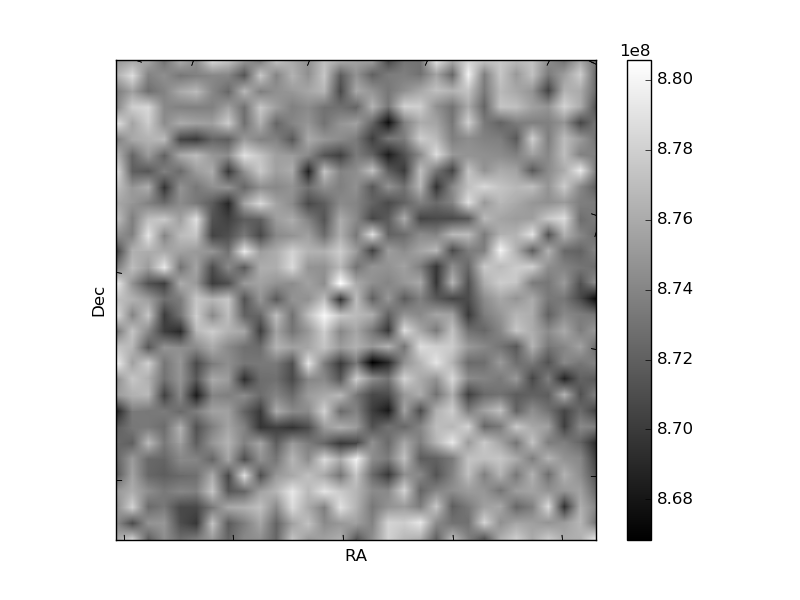
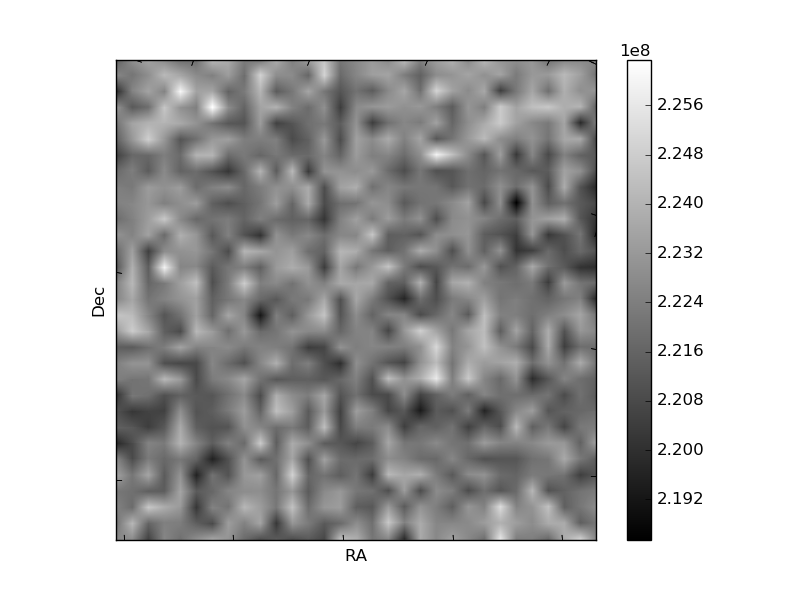
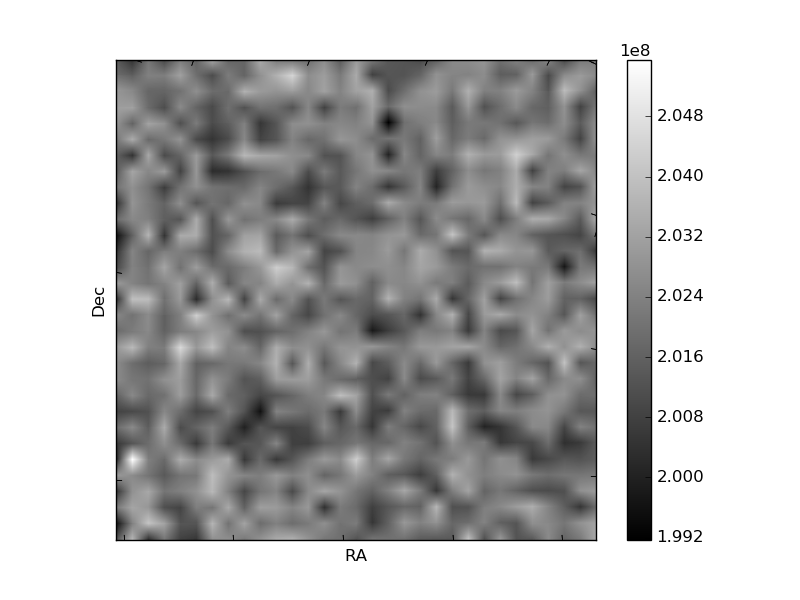
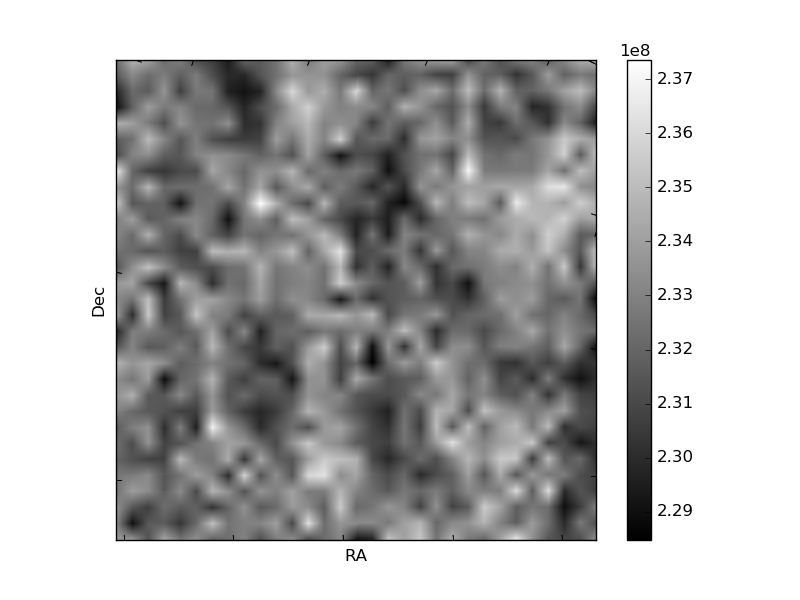
Histogram calculated using DETX and DETY for each event in the final _common_clean file
| Quadrant A | 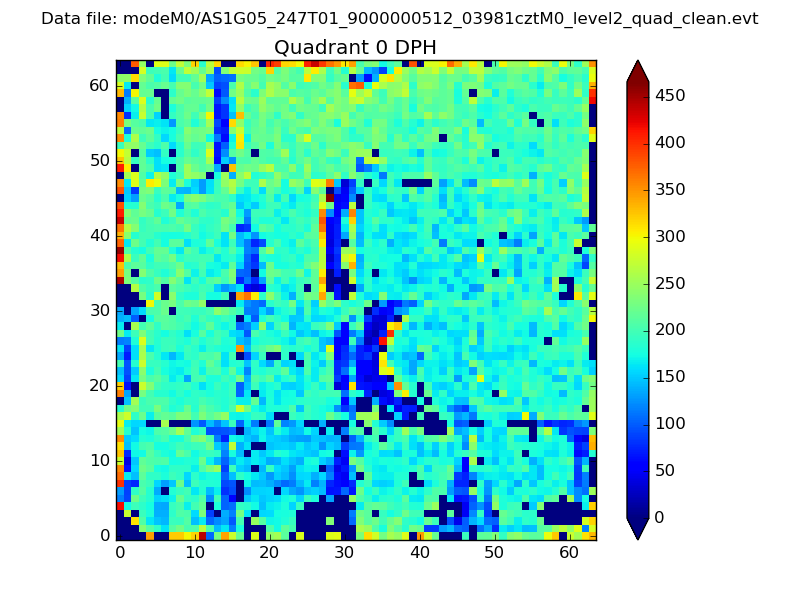 |
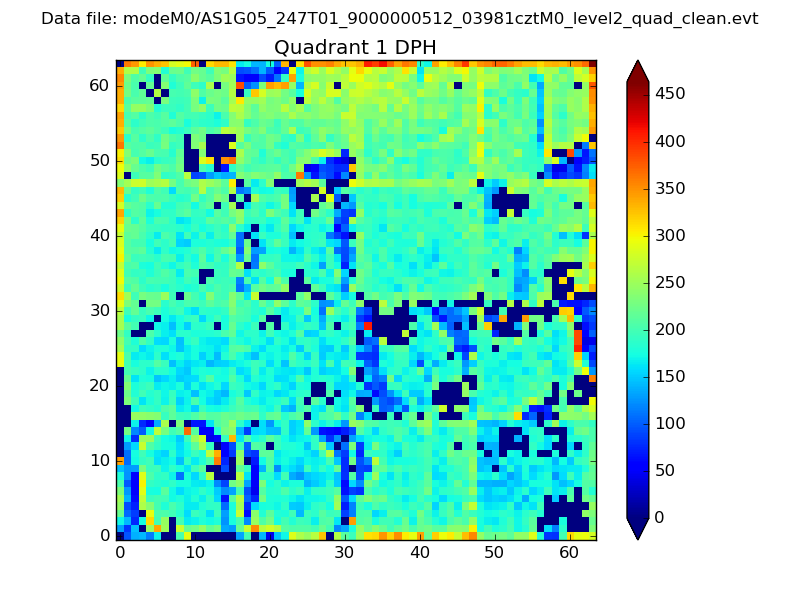 |
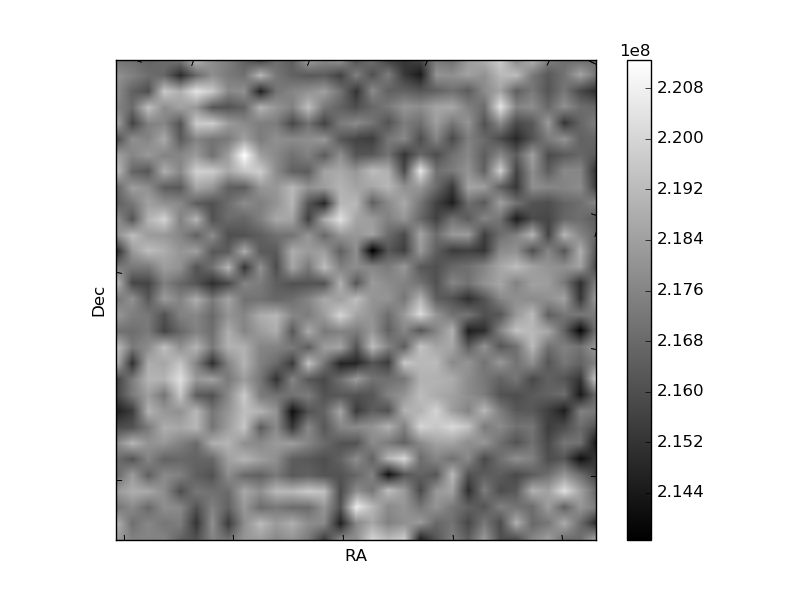
Quadrant B |
|---|---|---|---|
| Quadrant D | 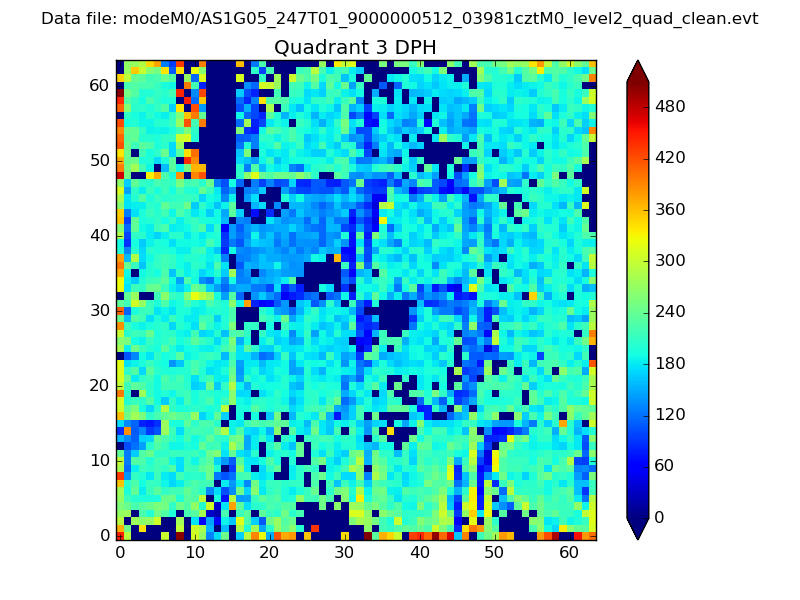 |
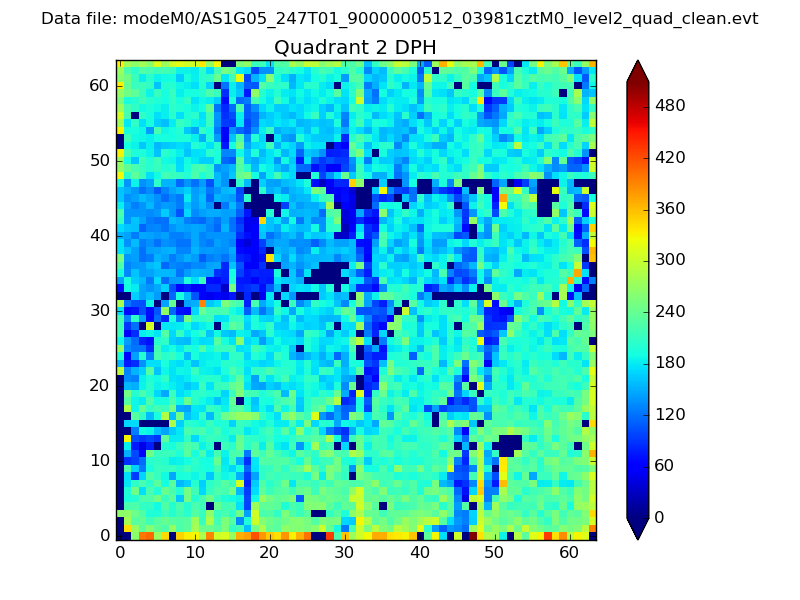 |
Quadrant C |
| Plot type | Count rate plots | Images |
|---|---|---|
| Comparison with Poisson distribution Blue bars denote a histogram of data divided into 1 sec bins. Red curve is a Poisson curve with rate = median count rate of data. |
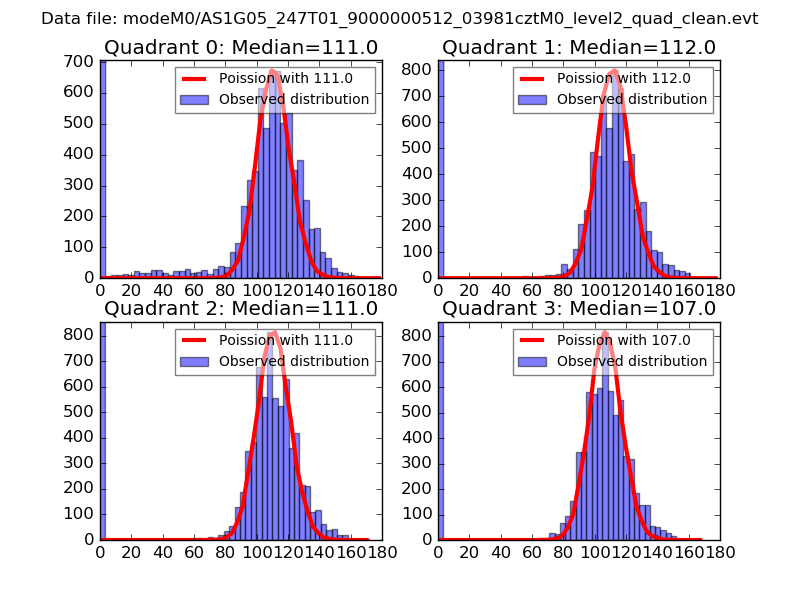 |
 |
| Quadrant-wise count rates Data is divided into 100 sec bins |
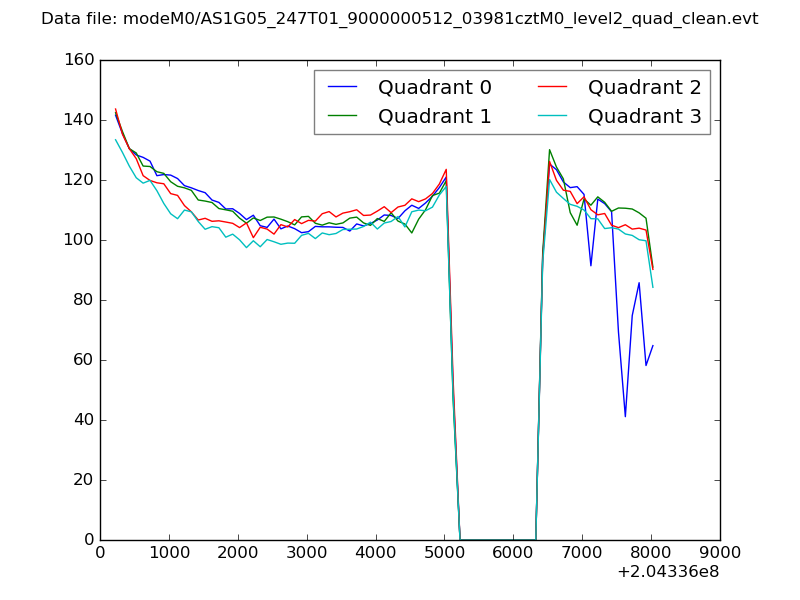 |
|
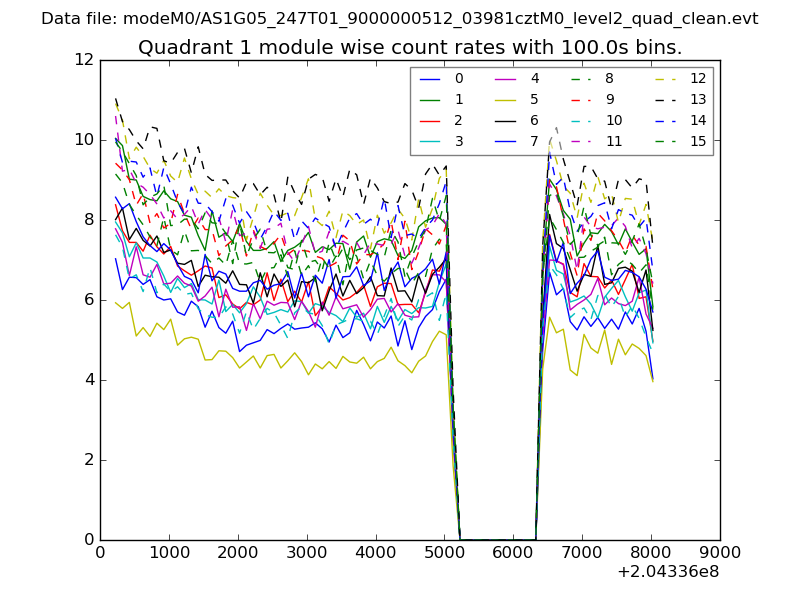
| Module-wise count rates for Quadrant A Data is divided into 100 sec bins |
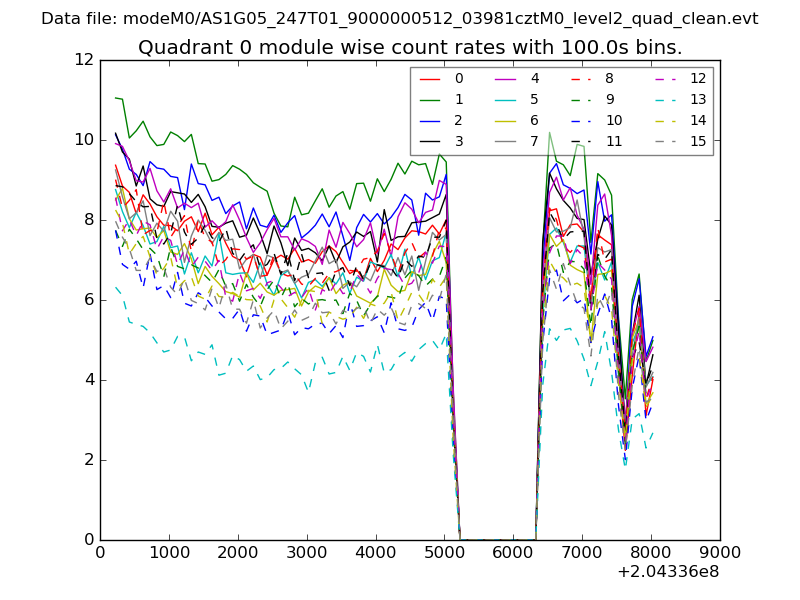 |
 |
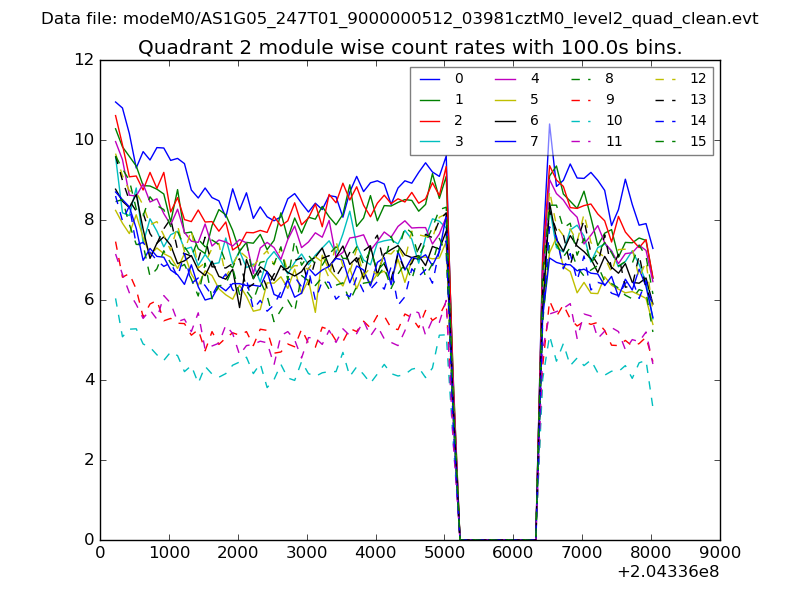
| Module-wise count rates for Quadrant B Data is divided into 100 sec bins |
 |
 |
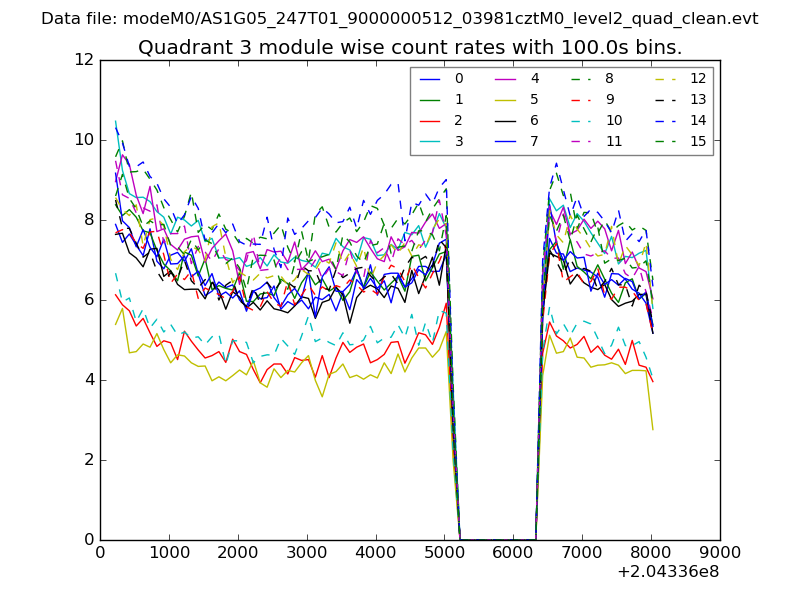
| Module-wise count rates for Quadrant C Data is divided into 100 sec bins |
 |
 |
| Module-wise count rates for Quadrant D Data is divided into 100 sec bins |
 |
 |
| Parameter | Plot |
|---|---|
| CZT HV Monitor | 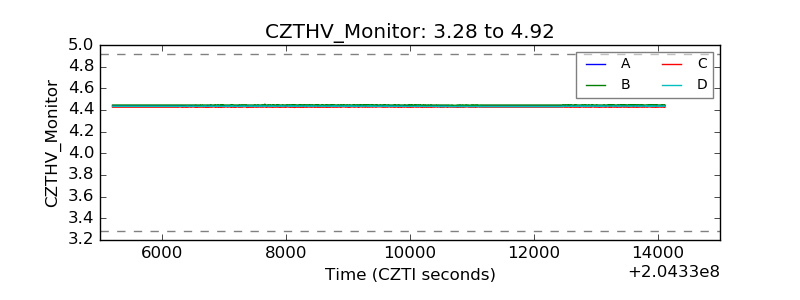 |
| D_VDD | 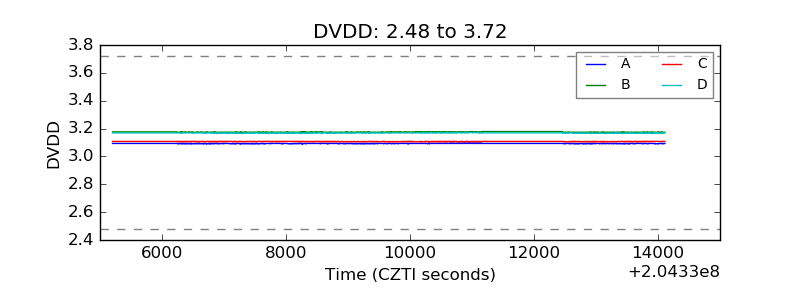 |
| Temperature 1 | 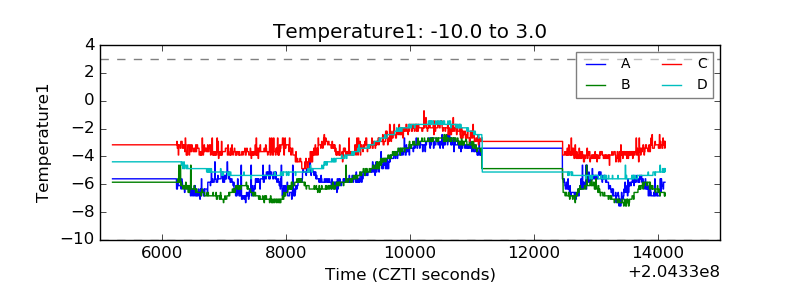 |
| Veto HV Monitor | 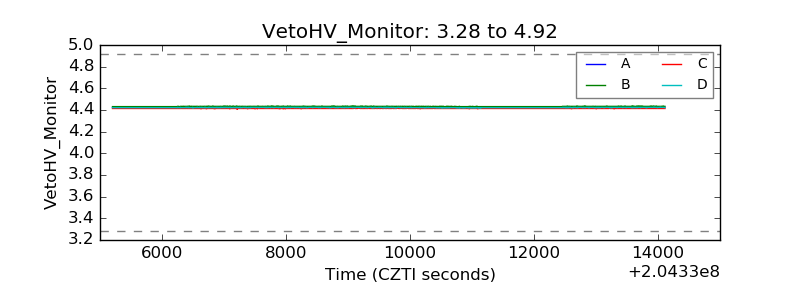 |
| Veto LLD | 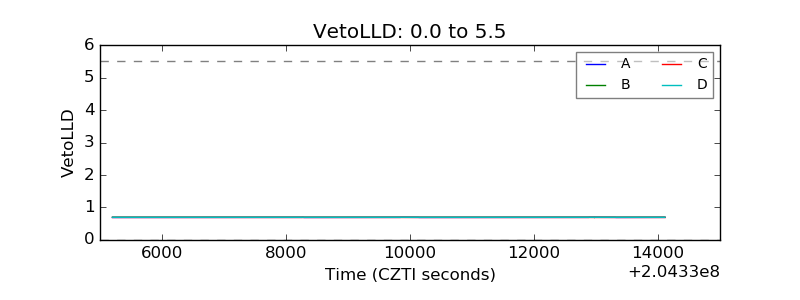 |
| Alpha Counter | 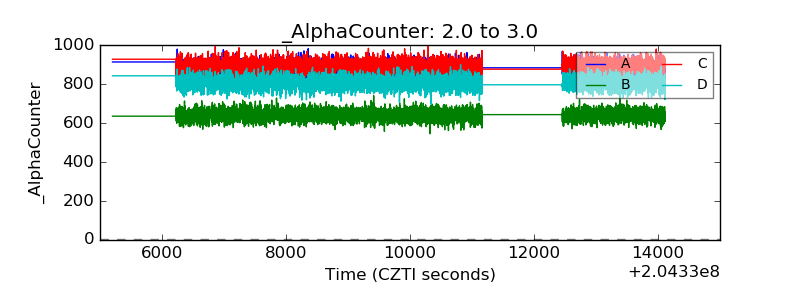 |
| _CPM_Rate | 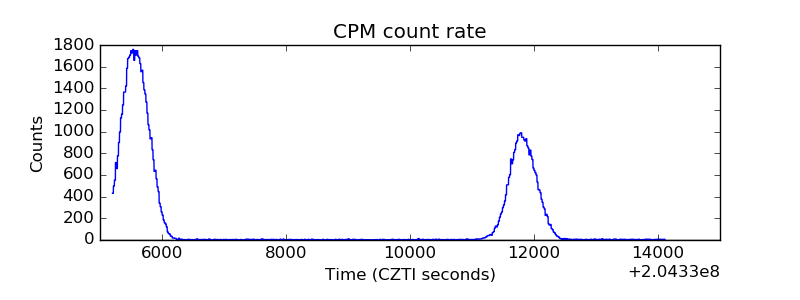 |
| CZT Counter | 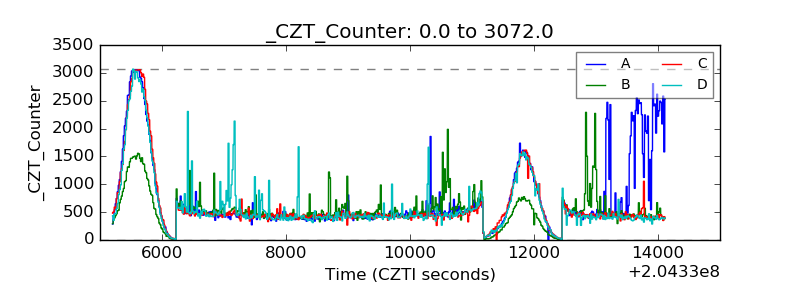 |
| +2.5 Volts monitor |  |
| +5 Volts monitor | 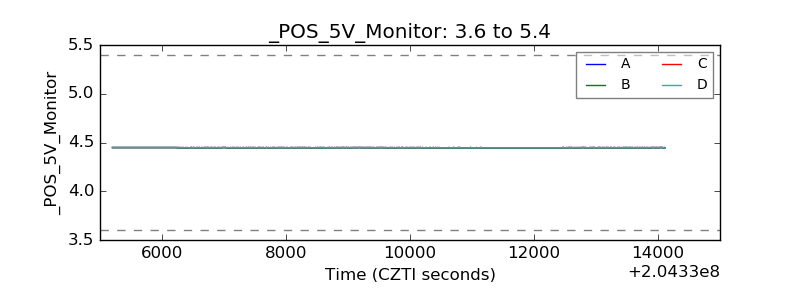 |
| _ROLL_ROT | 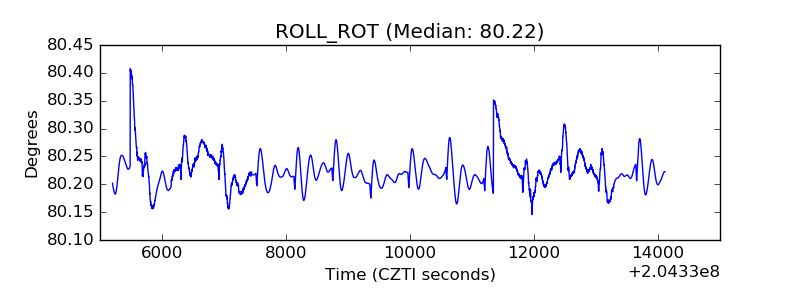 |
| _Roll_DEC | 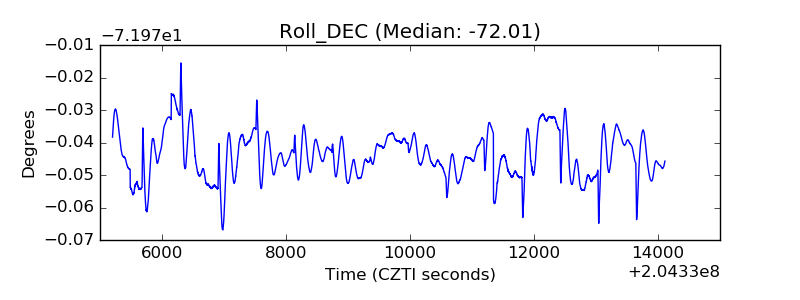 |
| _Roll_RA | 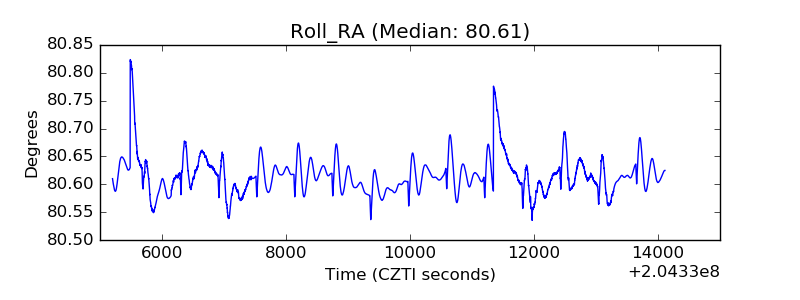 |
| Veto Counter | 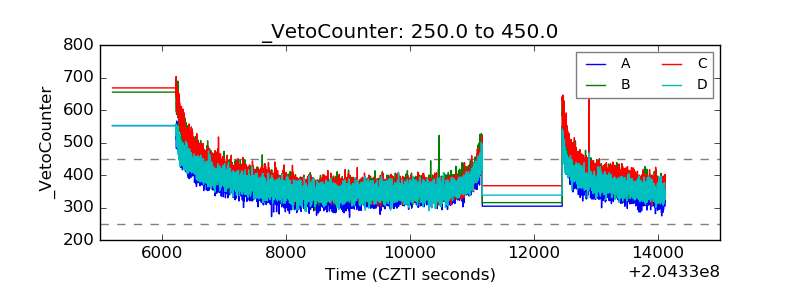 |