| Param | Original file | Final file |
|---|---|---|
| Filename | modeM0/AS1G05_247T01_9000000512_03982cztM0_level2.evt | modeM0/AS1G05_247T01_9000000512_03982cztM0_level2_quad_clean.evt |
| Size (bytes) | 427,248,000 | 92,139,840 |
| Size | 407.5 MB | 87.9 MB |
| Events in quadrant A | 4,095,873 | 577,926 |
| Events in quadrant B | 3,098,051 | 610,770 |
| Events in quadrant C | 2,518,450 | 613,471 |
| Events in quadrant D | 2,833,144 | 583,581 |
| Mode SS | |||
|---|---|---|---|
| Quadrant | BADHDUFLAG | Total packets | Discarded packets |
| A | 0 | 118 | 0 |
| B | 0 | 118 | 0 |
| C | 0 | 118 | 0 |
| D | 0 | 118 | 0 |
| Mode M9 | |||
|---|---|---|---|
| Quadrant | BADHDUFLAG | Total packets | Discarded packets |
| A | 0 | 11 | 0 |
| B | 0 | 11 | 0 |
| C | 0 | 11 | 0 |
| D | 0 | 11 | 0 |
| Mode M0 | |||
|---|---|---|---|
| Quadrant | BADHDUFLAG | Total packets | Discarded packets |
| A | 0 | 16209 | 2 |
| B | 0 | 13059 | 1 |
| C | 0 | 11715 | 1 |
| D | 0 | 12692 | 1 |
| Quadrant | Total seconds | Saturated seconds | Saturation percentage |
|---|---|---|---|
| A | 5782 | 610 | 10.549983% |
| B | 5782 | 148 | 2.559668% |
| C | 5782 | 20 | 0.345901% |
| D | 5782 | 107 | 1.850571% |
Noise dominated data is calculated using 1-second bins in cleaned event files. If a bin has >2000 counts, and if more than 50% of those come from <1% of pixels, then it is considered to be noise-dominated and hence unusable.
| Quadrant | # 1 sec bins | Bins with >0 counts | Bins with >2000 counts | High rate bins dominated by noise | Noise dominated (total time) | Noise dominated (detector-on time) | Marked lightcurve |
|---|---|---|---|---|---|---|---|
| A | 6897 | 5783 | 445 | 445 | 6.45% | 7.69% | 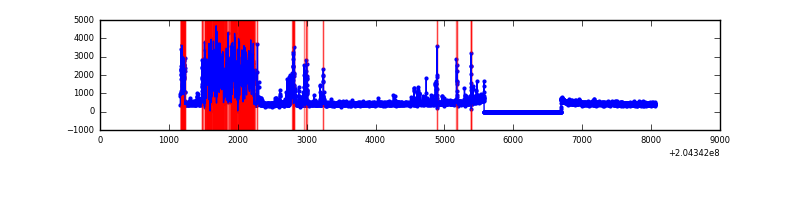 |
| B | 6897 | 5783 | 96 | 96 | 1.39% | 1.66% | 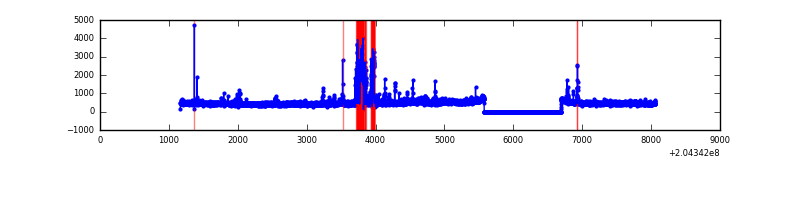 |
| C | 6897 | 5783 | 1 | 1 | 0.01% | 0.02% | 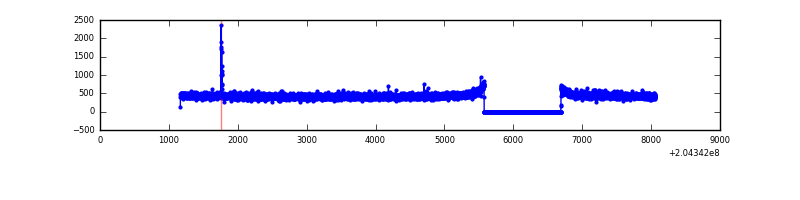 |
| D | 6897 | 5783 | 78 | 78 | 1.13% | 1.35% | 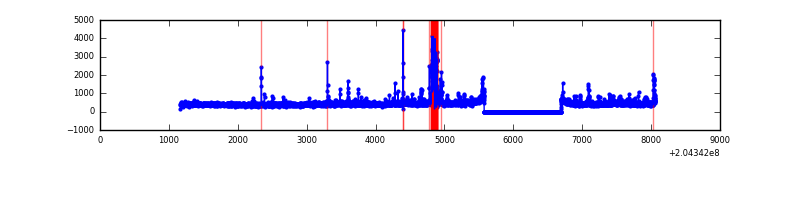 |
Top three noisy pixels from each quadrant. If the there are fewer than three noisy pixels in the level2.evt file, extra rows are filled as -1
| Pixel properties | Quadrant properties | ||||||
|---|---|---|---|---|---|---|---|
| Quadrant | DetID | PixID | Counts | Sigma | Mean | Median | Sigma |
| A | 0 | 50 | 1606403 | 12574.81 | 621 | 606 | 127.7 |
| A | 0 | 118 | 34162 | 262.77 | 621 | 606 | 127.7 |
| A | 3 | 1 | 26967 | 206.43 | 621 | 606 | 127.7 |
| B | 15 | 255 | 312893 | 2522.08 | 651 | 634 | 123.8 |
| B | 15 | 204 | 106040 | 851.35 | 651 | 634 | 123.8 |
| B | 14 | 167 | 89120 | 714.69 | 651 | 634 | 123.8 |
| C | 9 | 144 | 15378 | 99.88 | 639 | 640 | 147.6 |
| C | 10 | 65 | 5952 | 36.0 | 639 | 640 | 147.6 |
| C | 13 | 61 | 5346 | 31.89 | 639 | 640 | 147.6 |
| D | 10 | 246 | 319506 | 2118.36 | 629 | 611 | 150.5 |
| D | 2 | 63 | 36054 | 235.44 | 629 | 611 | 150.5 |
| D | 2 | 232 | 21609 | 139.49 | 629 | 611 | 150.5 |
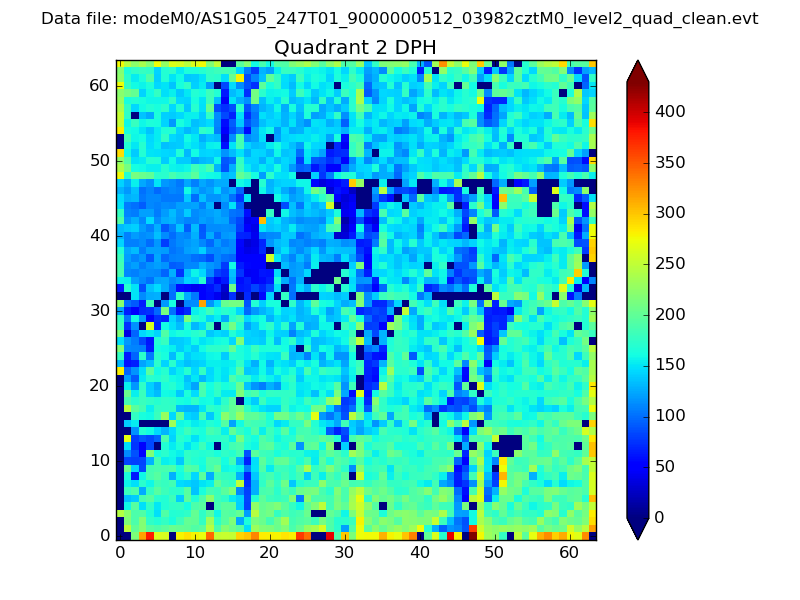
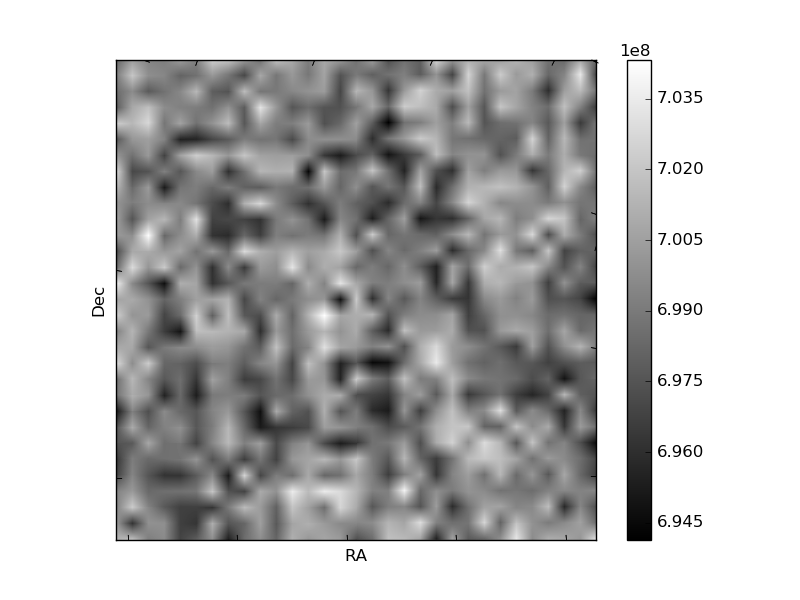
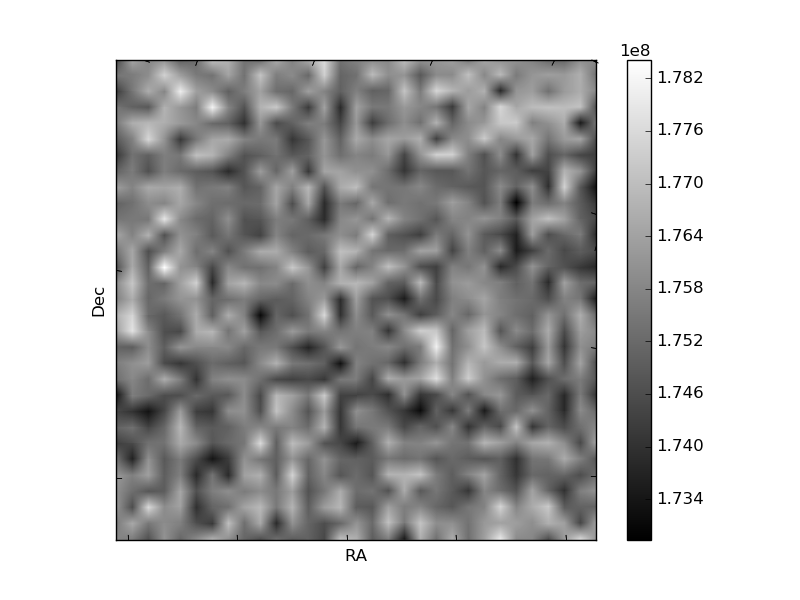
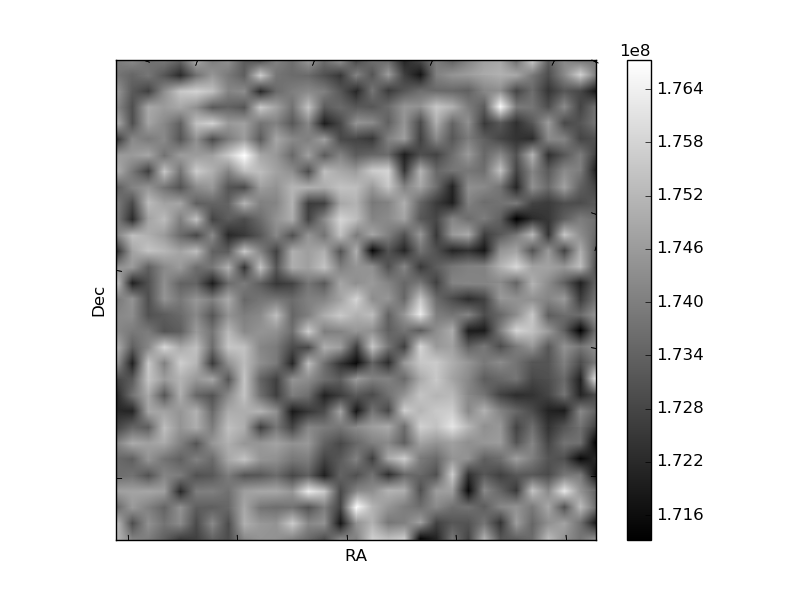
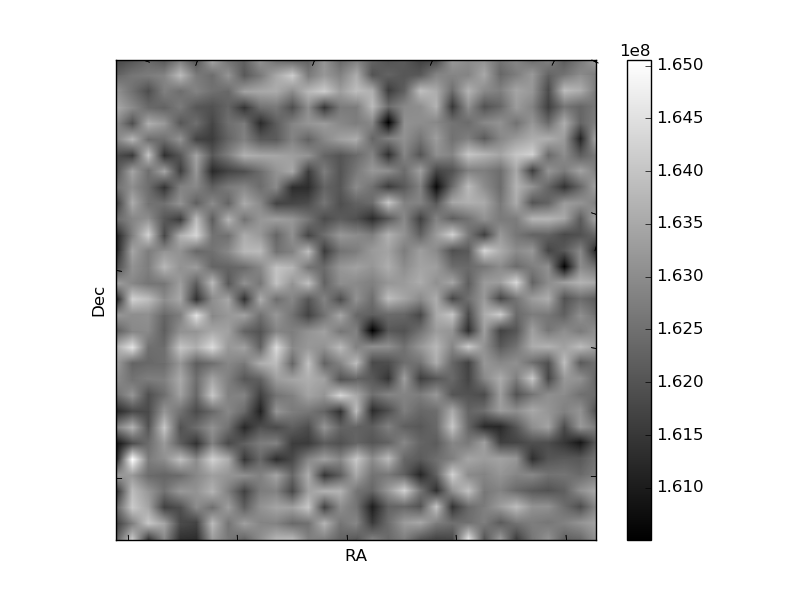
Histogram calculated using DETX and DETY for each event in the final _common_clean file
| Quadrant A | 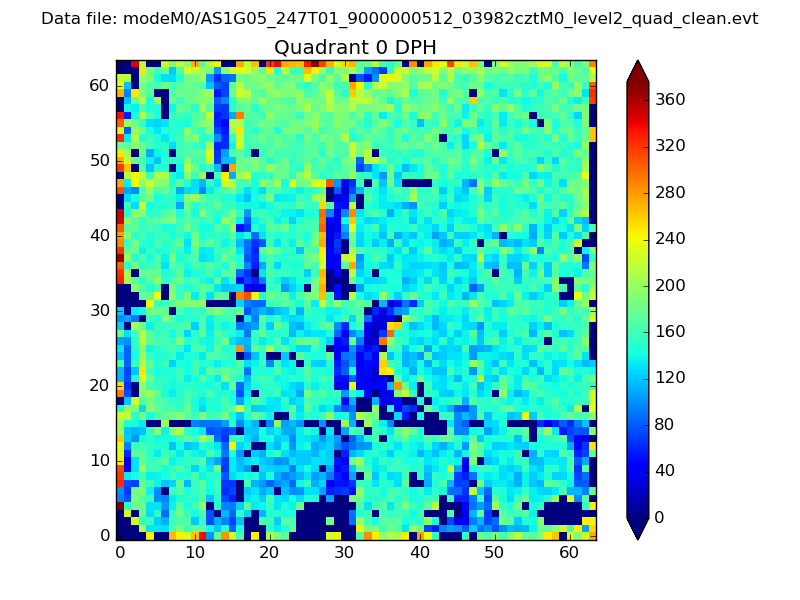 |
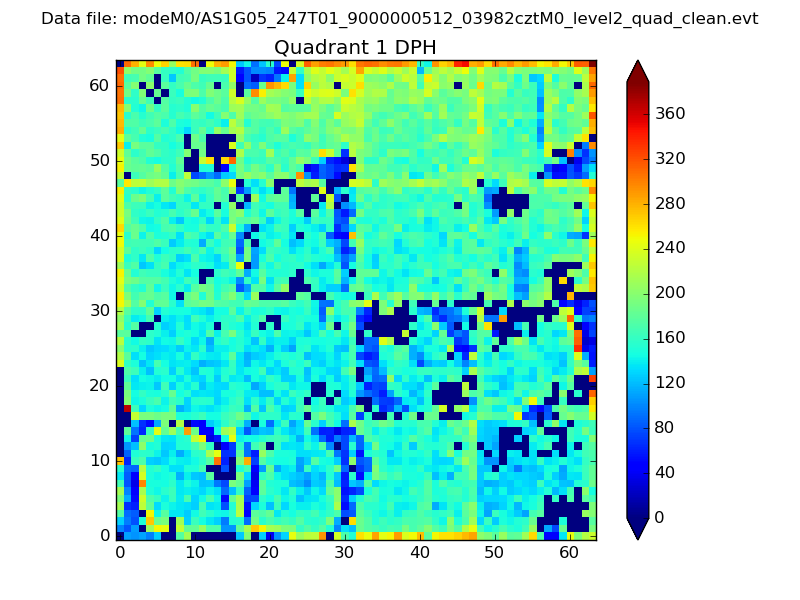 |
Quadrant B |
|---|---|---|---|
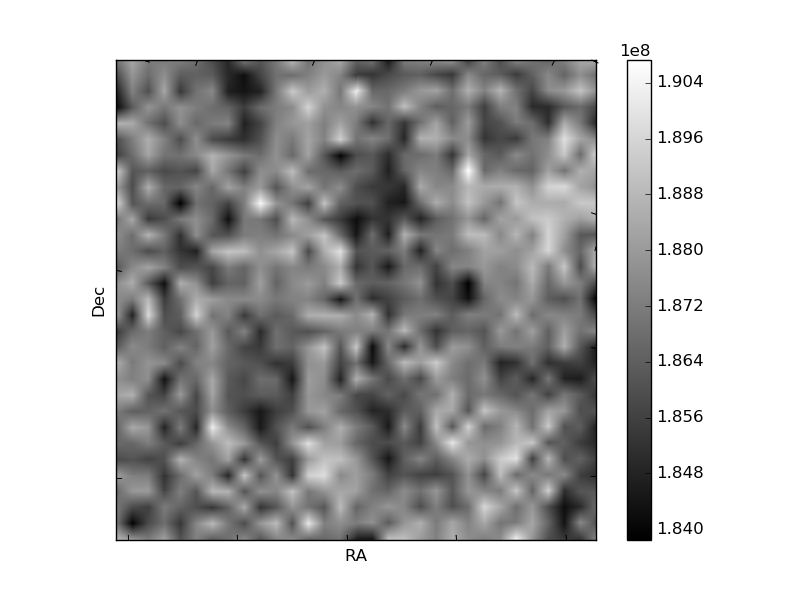
| Quadrant D | 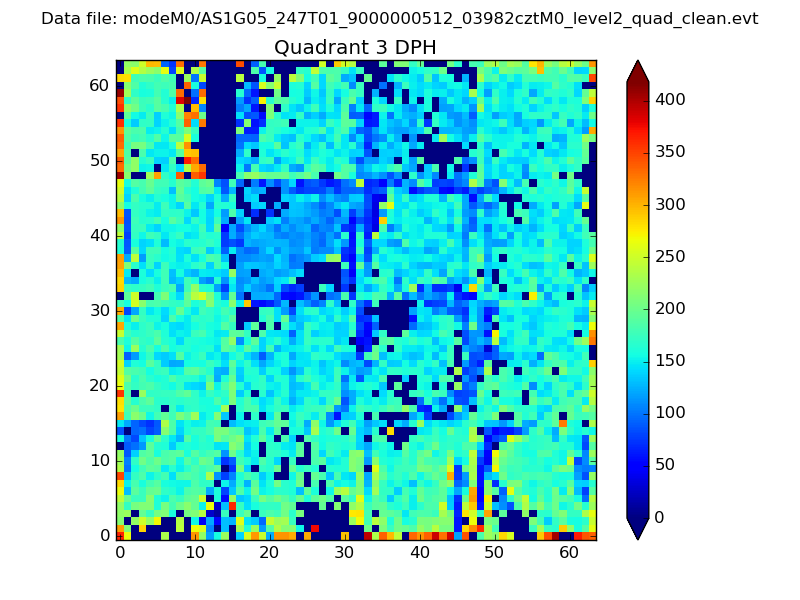 |
 |
Quadrant C |
| Plot type | Count rate plots | Images |
|---|---|---|
| Comparison with Poisson distribution Blue bars denote a histogram of data divided into 1 sec bins. Red curve is a Poisson curve with rate = median count rate of data. |
 |
 |
| Quadrant-wise count rates Data is divided into 100 sec bins |
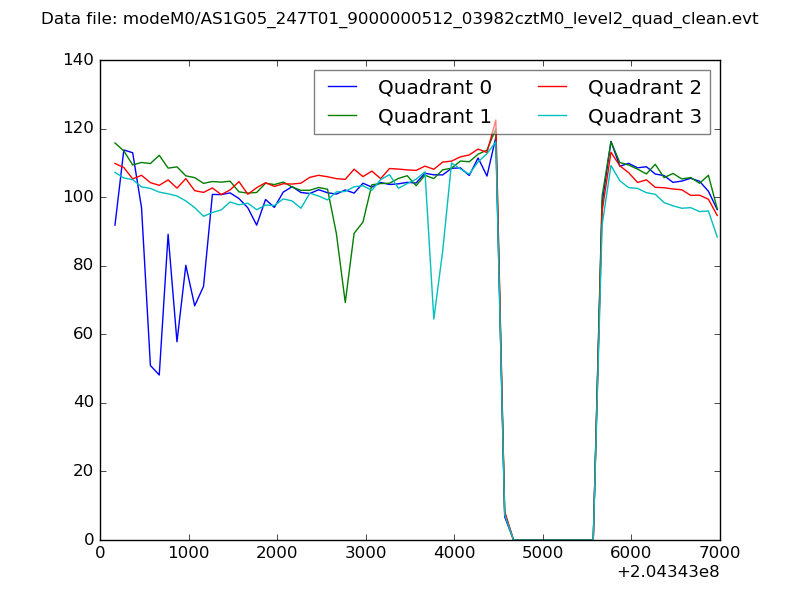 |
|
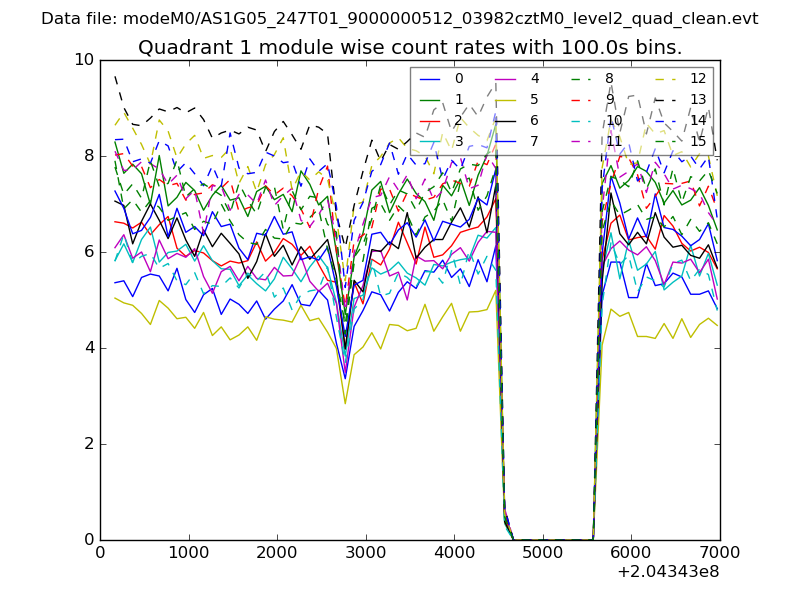
| Module-wise count rates for Quadrant A Data is divided into 100 sec bins |
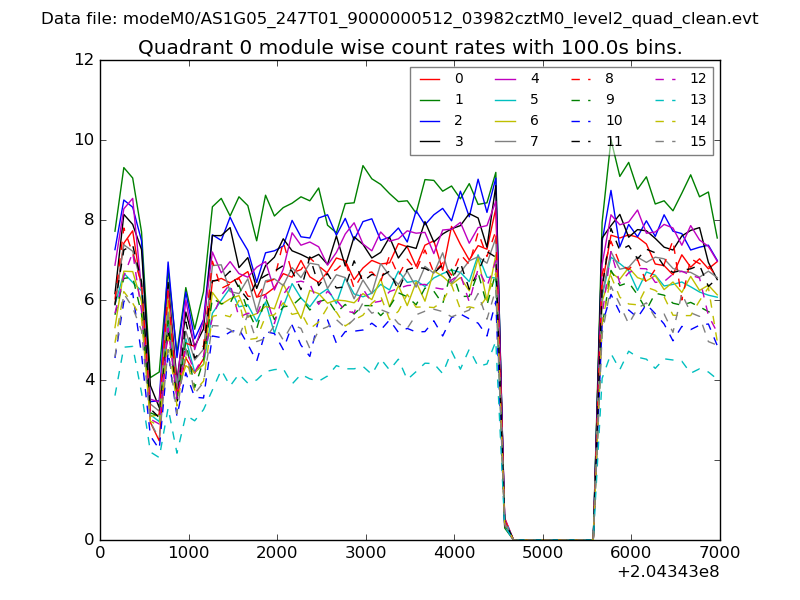 |
 |
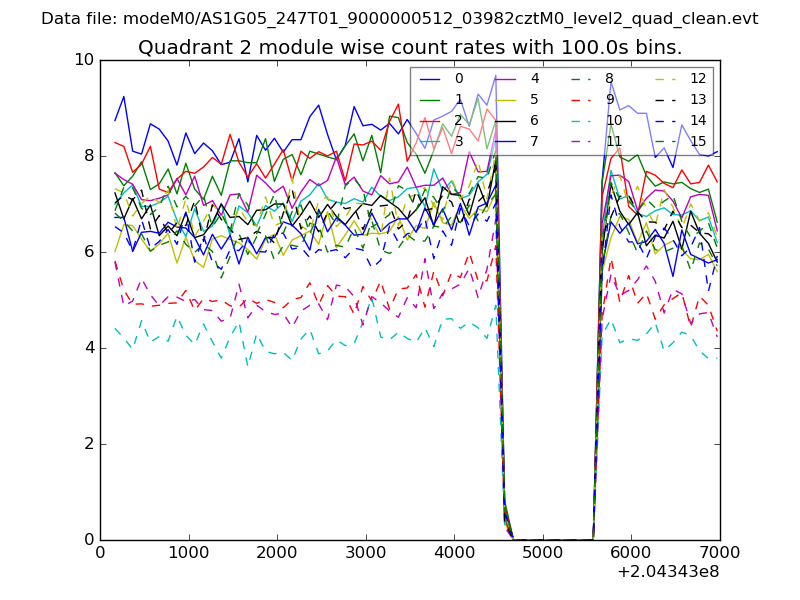
| Module-wise count rates for Quadrant B Data is divided into 100 sec bins |
 |
 |
| Module-wise count rates for Quadrant C Data is divided into 100 sec bins |
 |
 |
| Module-wise count rates for Quadrant D Data is divided into 100 sec bins |
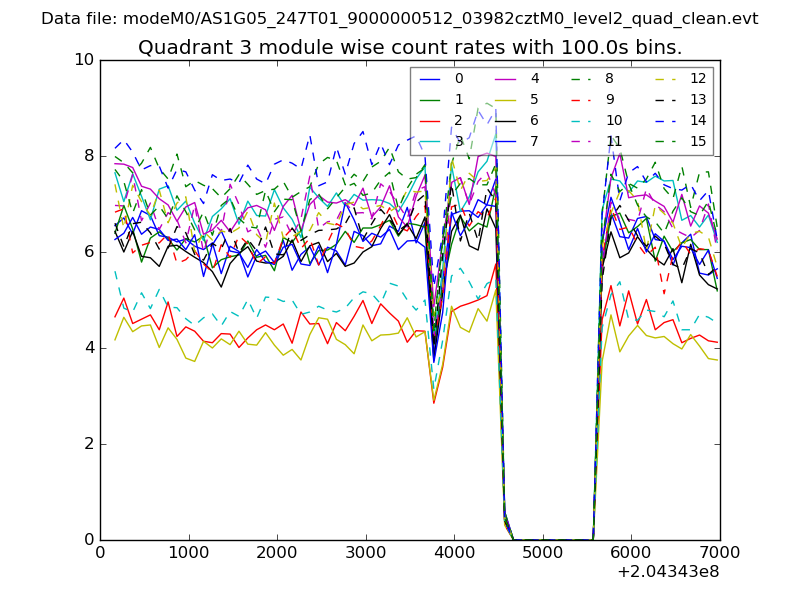 |
 |
| Parameter | Plot |
|---|---|
| CZT HV Monitor | 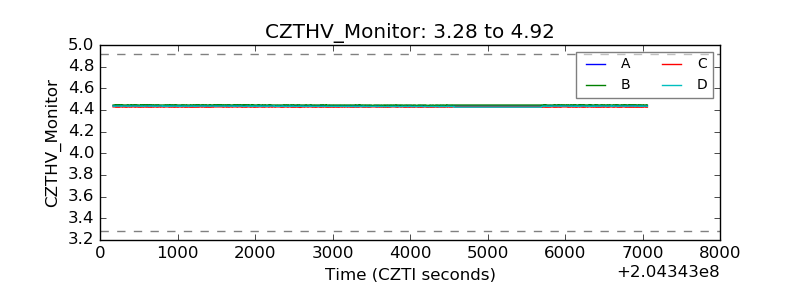 |
| D_VDD | 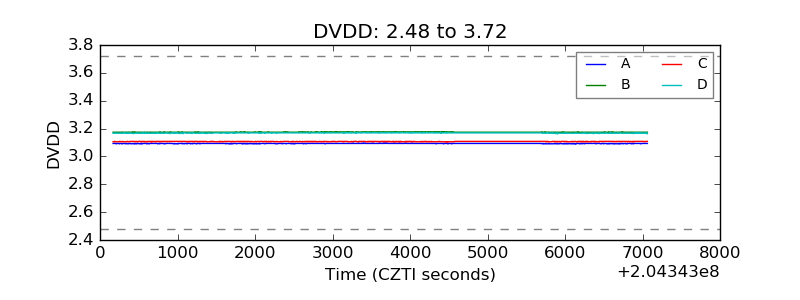 |
| Temperature 1 | 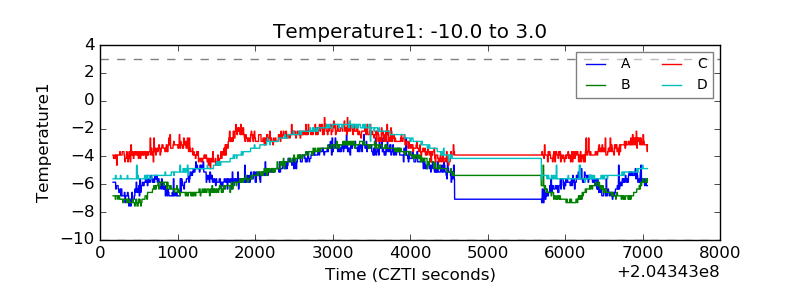 |
| Veto HV Monitor | 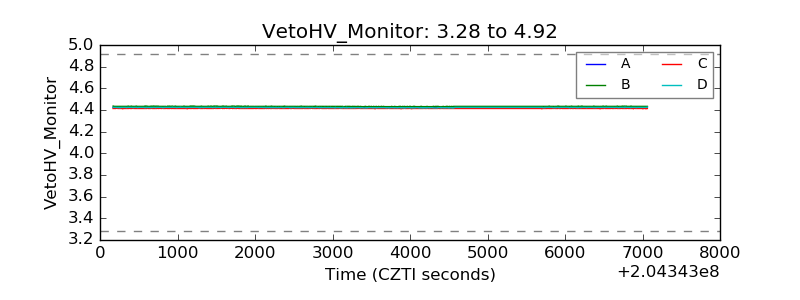 |
| Veto LLD | 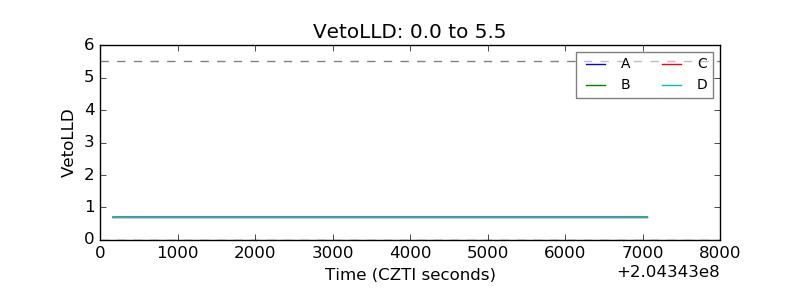 |
| Alpha Counter | 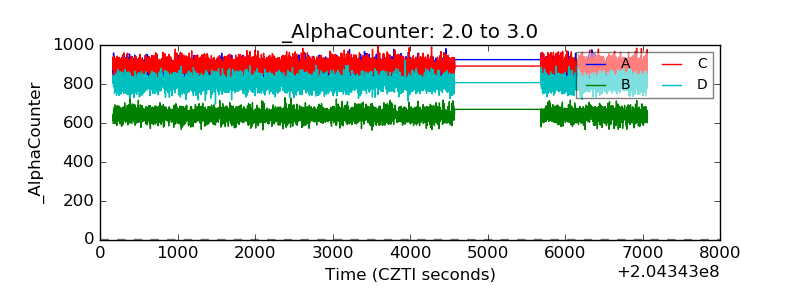 |
| _CPM_Rate | 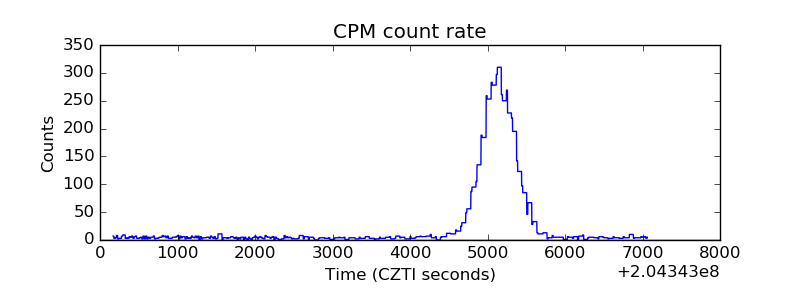 |
| CZT Counter | 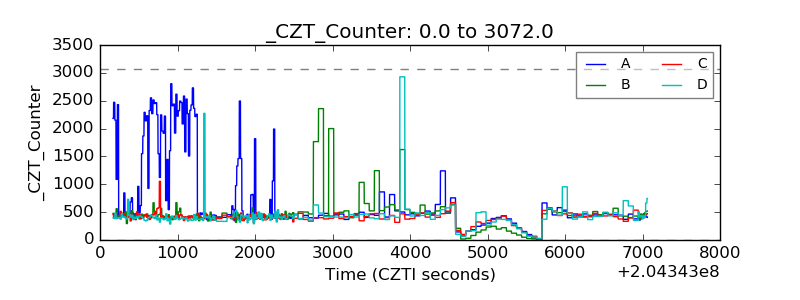 |
| +2.5 Volts monitor |  |
| +5 Volts monitor |  |
| _ROLL_ROT | 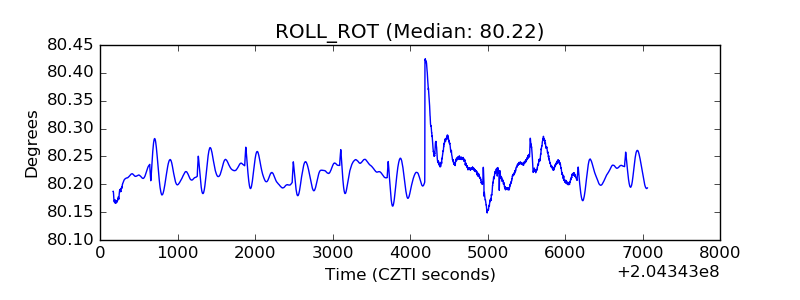 |
| _Roll_DEC | 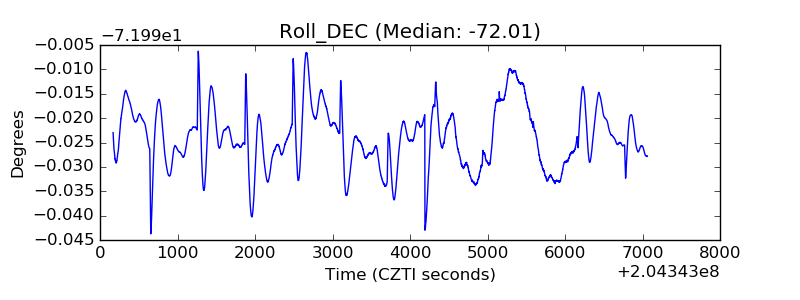 |
| _Roll_RA | 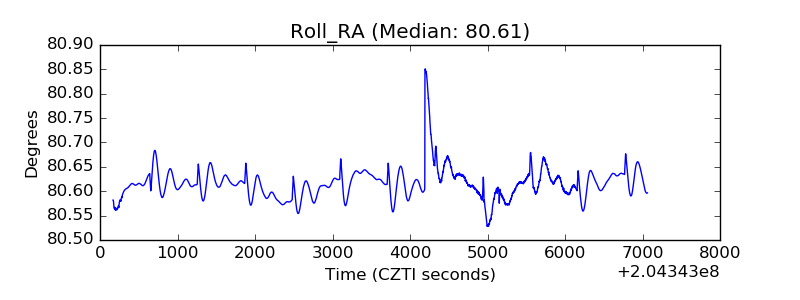 |
| Veto Counter | 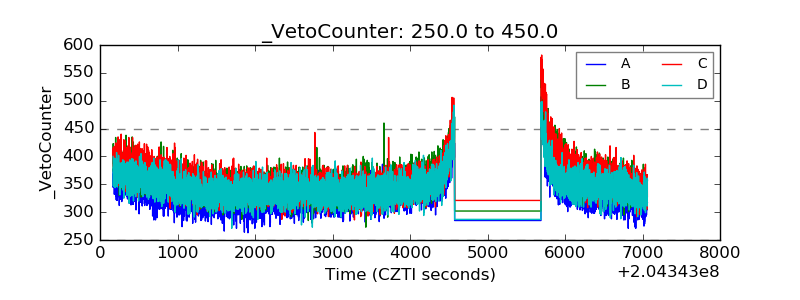 |