| Param | Original file | Final file |
|---|---|---|
| Filename | modeM0/AS1G05_247T01_9000000512_03983cztM0_level2.evt | modeM0/AS1G05_247T01_9000000512_03983cztM0_level2_quad_clean.evt |
| Size (bytes) | 480,018,240 | 116,936,640 |
| Size | 457.8 MB | 111.5 MB |
| Events in quadrant A | 3,602,740 | 761,069 |
| Events in quadrant B | 3,562,479 | 767,939 |
| Events in quadrant C | 3,229,428 | 764,331 |
| Events in quadrant D | 3,641,456 | 735,083 |
| Mode SS | |||
|---|---|---|---|
| Quadrant | BADHDUFLAG | Total packets | Discarded packets |
| A | 0 | 152 | 0 |
| B | 0 | 152 | 0 |
| C | 0 | 152 | 0 |
| D | 0 | 152 | 0 |
| Mode M9 | |||
|---|---|---|---|
| Quadrant | BADHDUFLAG | Total packets | Discarded packets |
| A | 0 | 19 | 0 |
| B | 0 | 19 | 0 |
| C | 0 | 19 | 0 |
| D | 0 | 19 | 0 |
| Mode M0 | |||
|---|---|---|---|
| Quadrant | BADHDUFLAG | Total packets | Discarded packets |
| A | 0 | 15974 | 3 |
| B | 0 | 15521 | 2 |
| C | 0 | 15006 | 2 |
| D | 0 | 16267 | 2 |
| Quadrant | Total seconds | Saturated seconds | Saturation percentage |
|---|---|---|---|
| A | 7372 | 101 | 1.370049% |
| B | 7372 | 75 | 1.017363% |
| C | 7372 | 47 | 0.637547% |
| D | 7372 | 129 | 1.749864% |
Noise dominated data is calculated using 1-second bins in cleaned event files. If a bin has >2000 counts, and if more than 50% of those come from <1% of pixels, then it is considered to be noise-dominated and hence unusable.
| Quadrant | # 1 sec bins | Bins with >0 counts | Bins with >2000 counts | High rate bins dominated by noise | Noise dominated (total time) | Noise dominated (detector-on time) | Marked lightcurve |
|---|---|---|---|---|---|---|---|
| A | 9272 | 7374 | 23 | 23 | 0.25% | 0.31% | 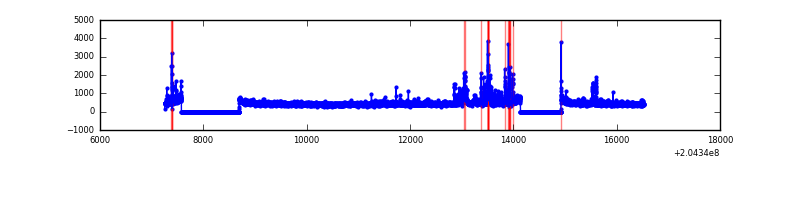 |
| B | 9272 | 7374 | 6 | 6 | 0.06% | 0.08% | 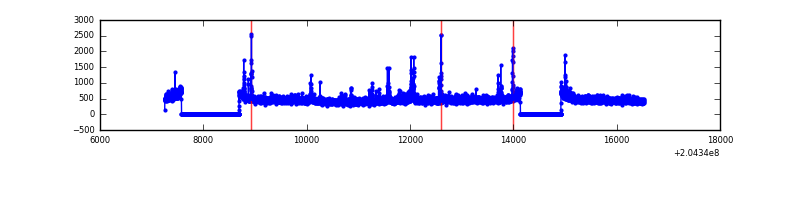 |
| C | 9272 | 7374 | 1 | 1 | 0.01% | 0.01% | 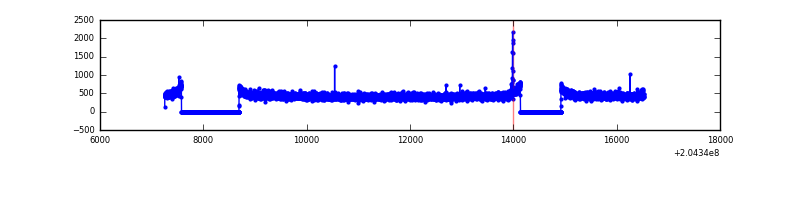 |
| D | 9272 | 7374 | 52 | 52 | 0.56% | 0.71% | 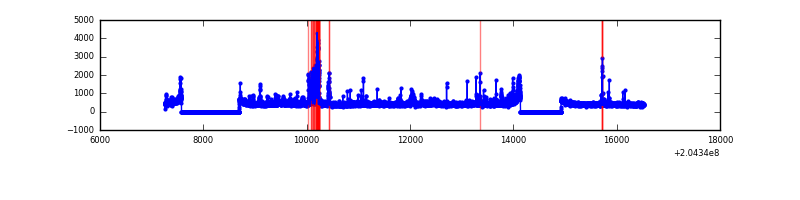 |
Top three noisy pixels from each quadrant. If the there are fewer than three noisy pixels in the level2.evt file, extra rows are filled as -1
| Pixel properties | Quadrant properties | ||||||
|---|---|---|---|---|---|---|---|
| Quadrant | DetID | PixID | Counts | Sigma | Mean | Median | Sigma |
| A | 0 | 50 | 242829 | 1435.39 | 830 | 811 | 168.6 |
| A | 3 | 1 | 65910 | 386.1 | 830 | 811 | 168.6 |
| A | 12 | 247 | 37464 | 217.39 | 830 | 811 | 168.6 |
| B | 14 | 167 | 109273 | 678.49 | 843 | 818 | 159.8 |
| B | 15 | 204 | 61150 | 377.44 | 843 | 818 | 159.8 |
| B | 3 | 0 | 44808 | 275.2 | 843 | 818 | 159.8 |
| C | 10 | 65 | 14601 | 72.78 | 820 | 821 | 189.3 |
| C | 9 | 144 | 12647 | 62.46 | 820 | 821 | 189.3 |
| C | 13 | 61 | 6846 | 31.82 | 820 | 821 | 189.3 |
| D | 10 | 246 | 406667 | 2108.02 | 806 | 781 | 192.5 |
| D | 13 | 239 | 69519 | 357.0 | 806 | 781 | 192.5 |
| D | 2 | 63 | 48971 | 250.28 | 806 | 781 | 192.5 |
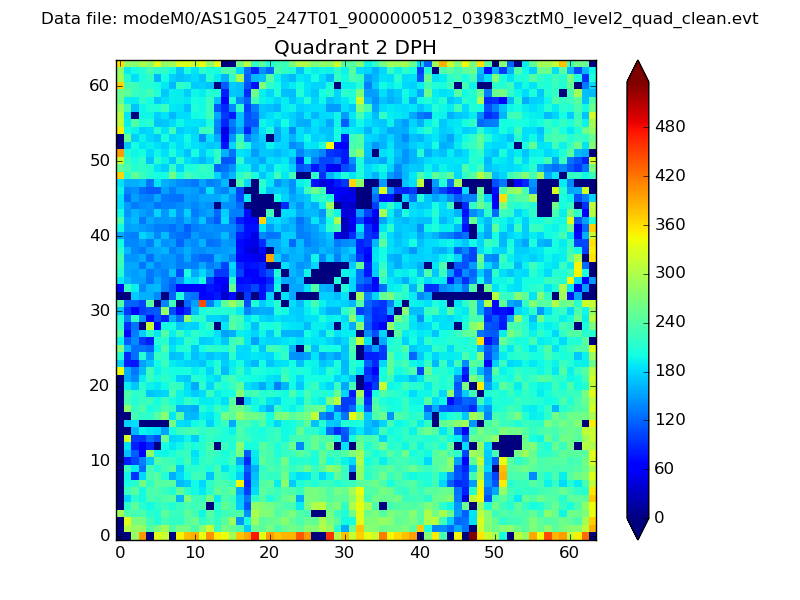
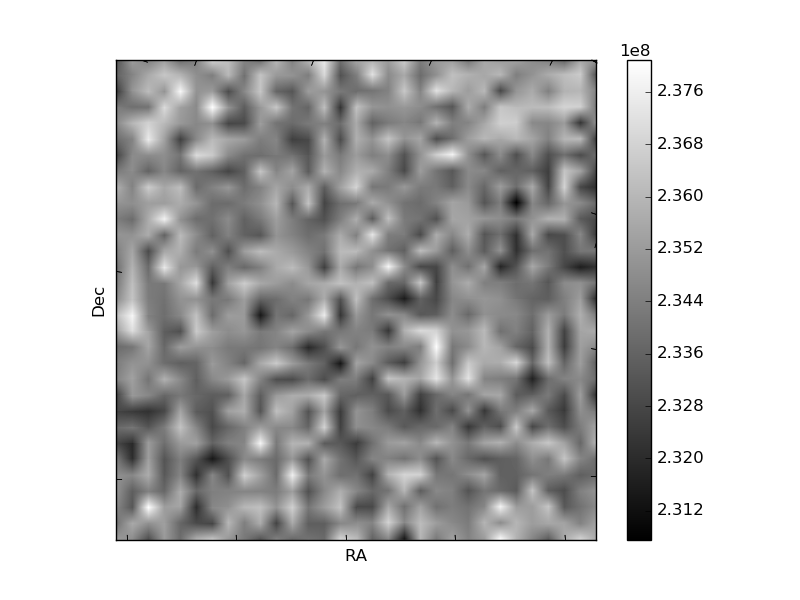
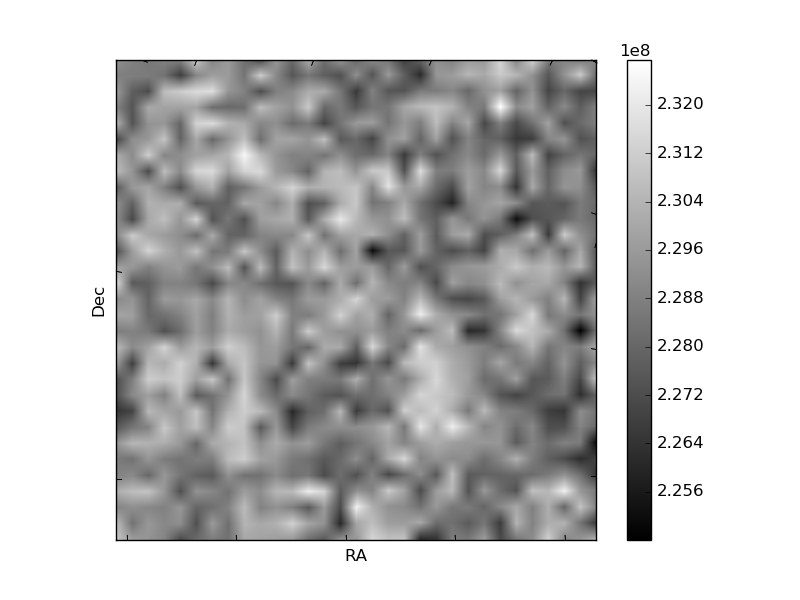
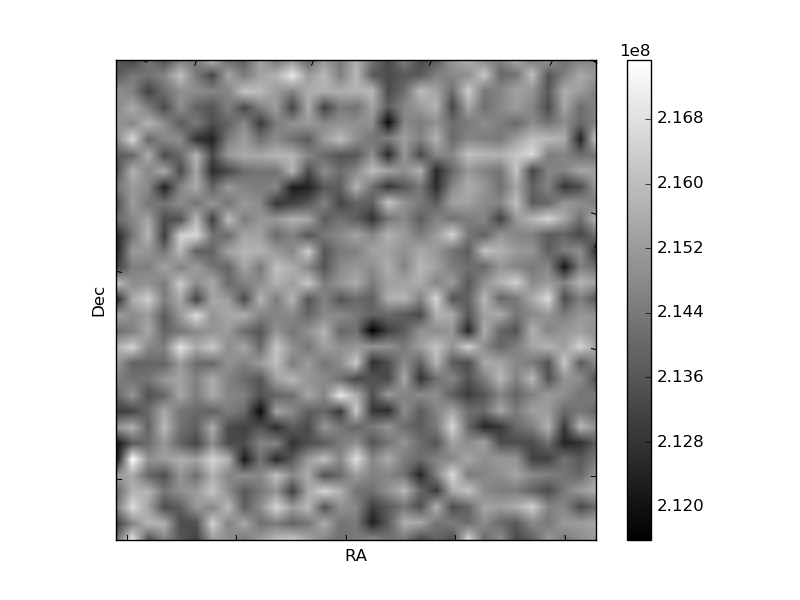
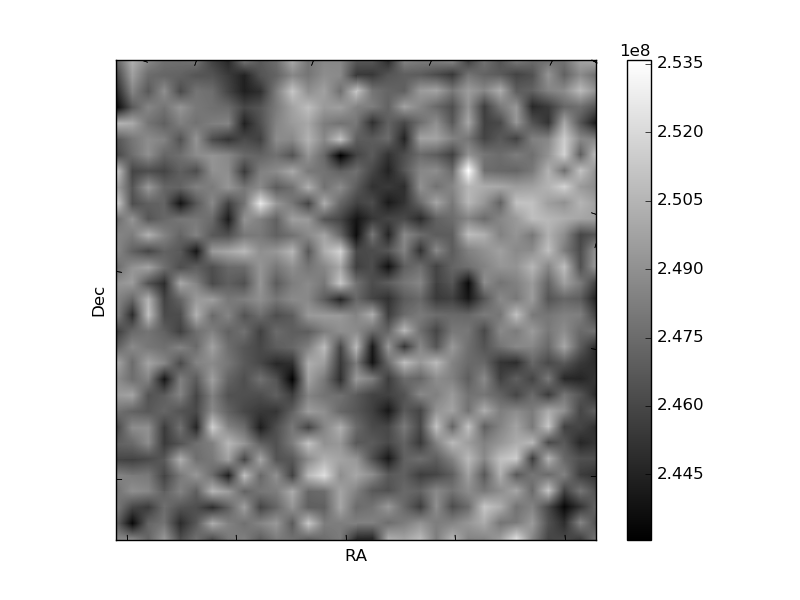
Histogram calculated using DETX and DETY for each event in the final _common_clean file
| Quadrant A | 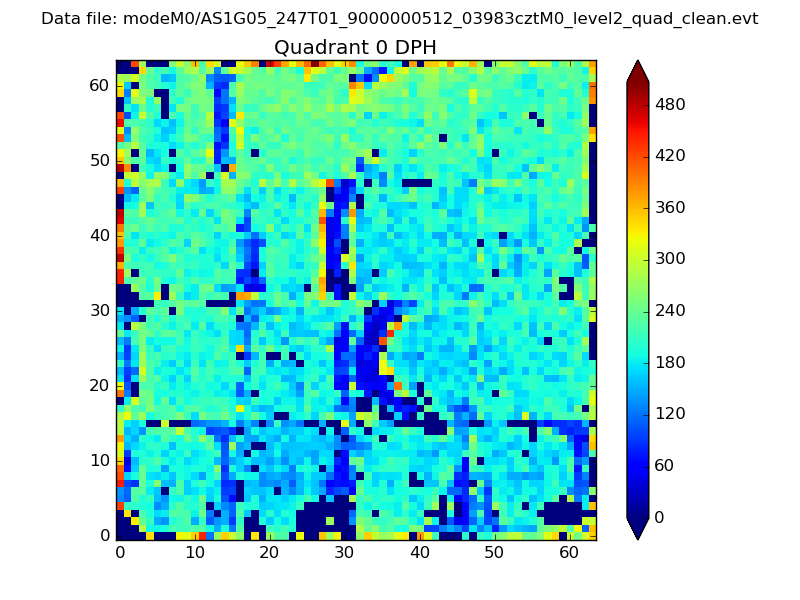 |
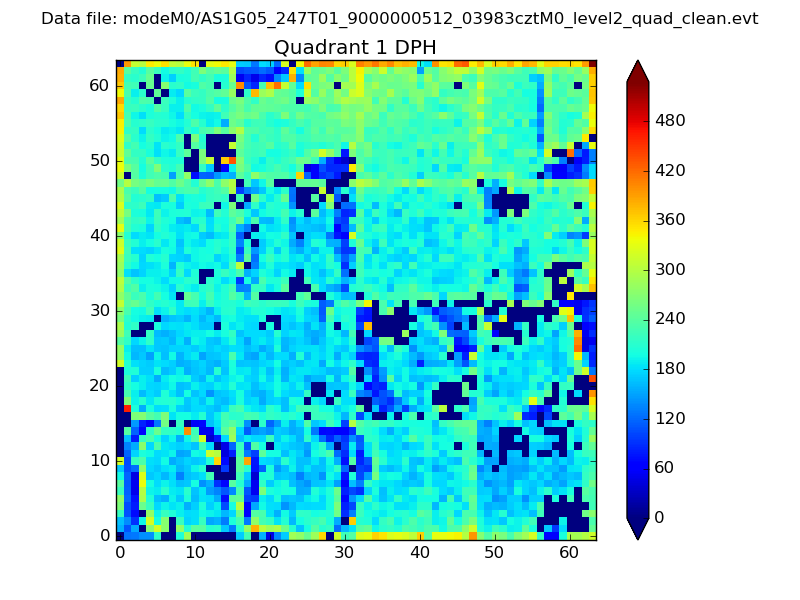 |
Quadrant B |
|---|---|---|---|
| Quadrant D | 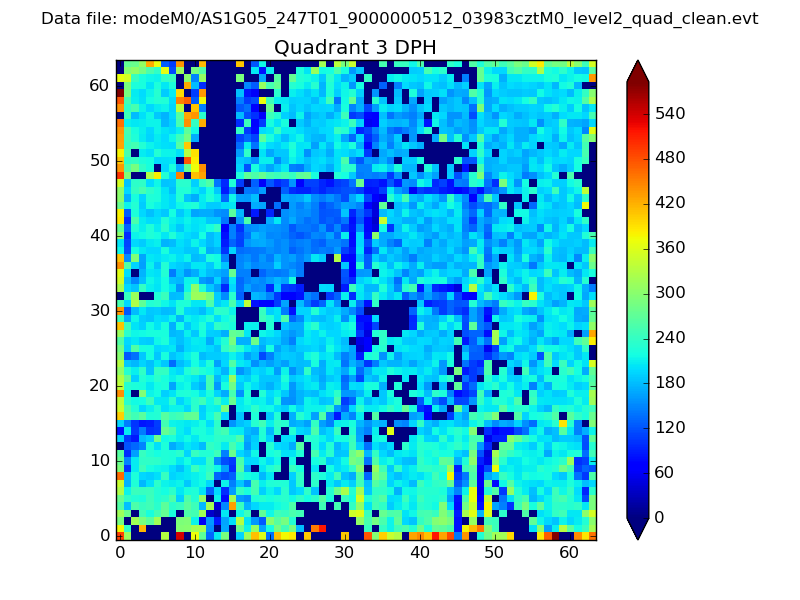 |
 |
Quadrant C |
| Plot type | Count rate plots | Images |
|---|---|---|
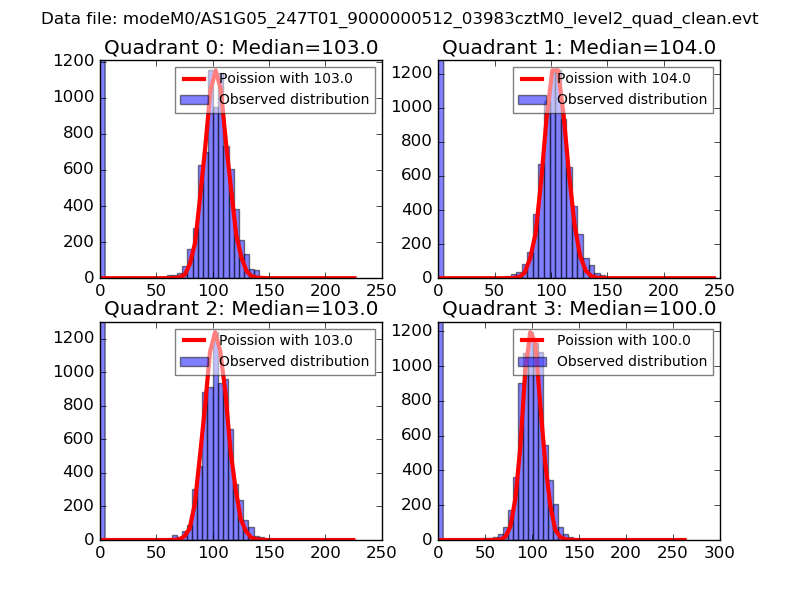
| Comparison with Poisson distribution Blue bars denote a histogram of data divided into 1 sec bins. Red curve is a Poisson curve with rate = median count rate of data. |
 |
 |
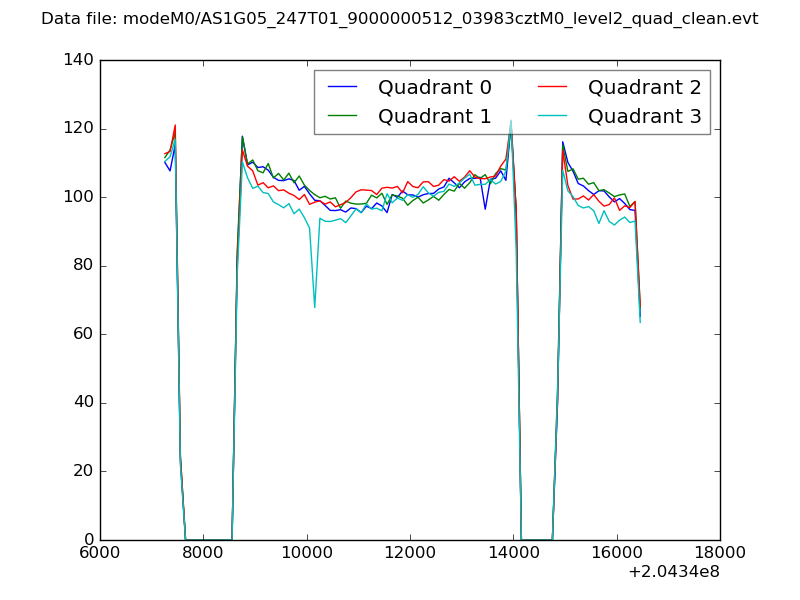
| Quadrant-wise count rates Data is divided into 100 sec bins |
 |
|
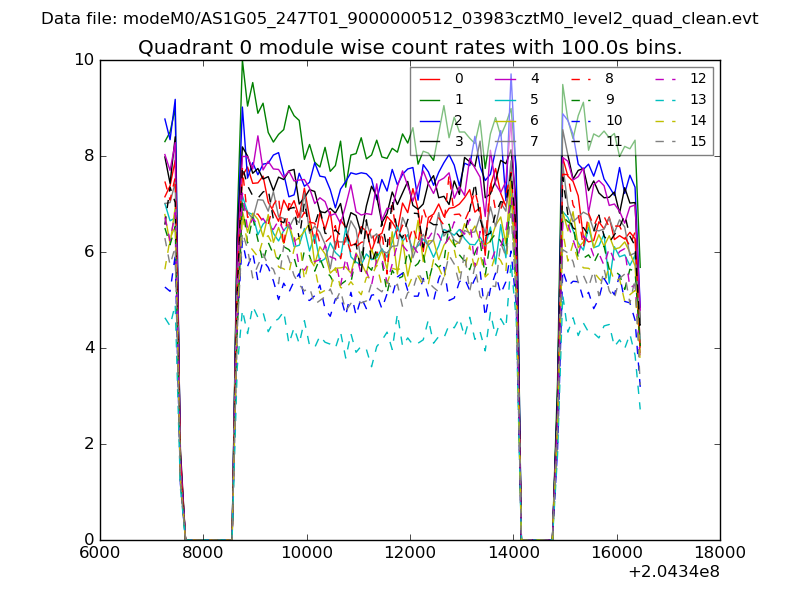
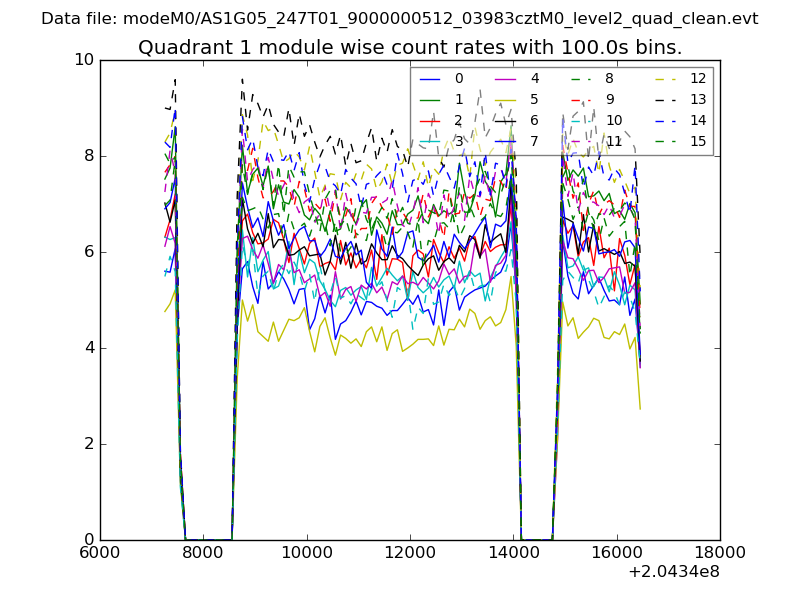
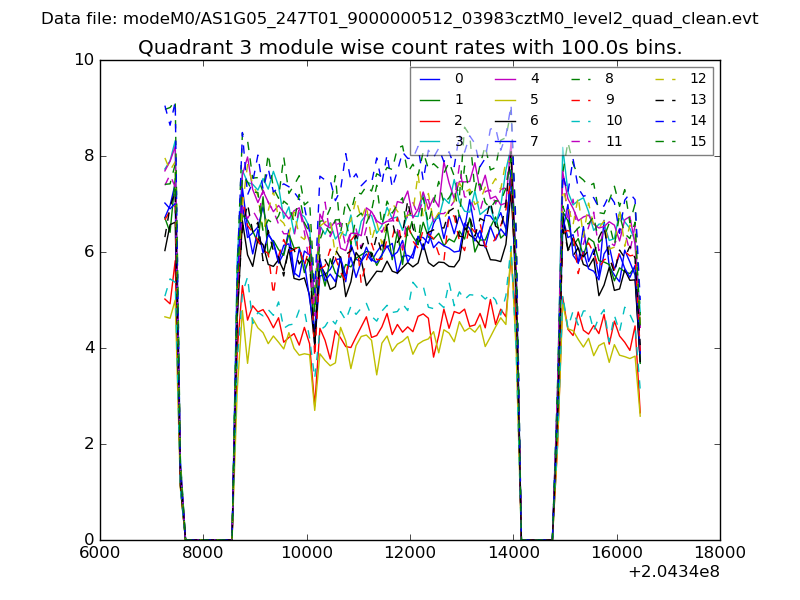
| Module-wise count rates for Quadrant A Data is divided into 100 sec bins |
 |
 |
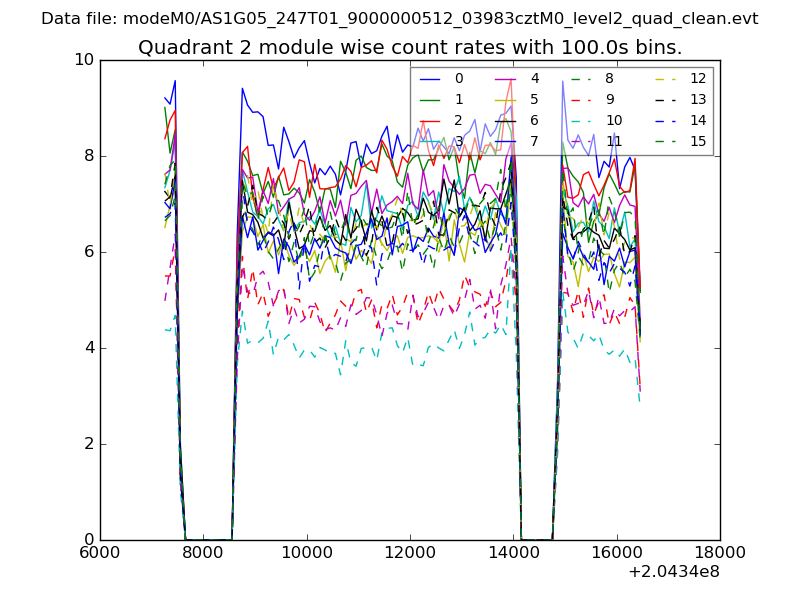
| Module-wise count rates for Quadrant B Data is divided into 100 sec bins |
 |
 |
| Module-wise count rates for Quadrant C Data is divided into 100 sec bins |
 |
 |
| Module-wise count rates for Quadrant D Data is divided into 100 sec bins |
 |
 |
| Parameter | Plot |
|---|---|
| CZT HV Monitor | 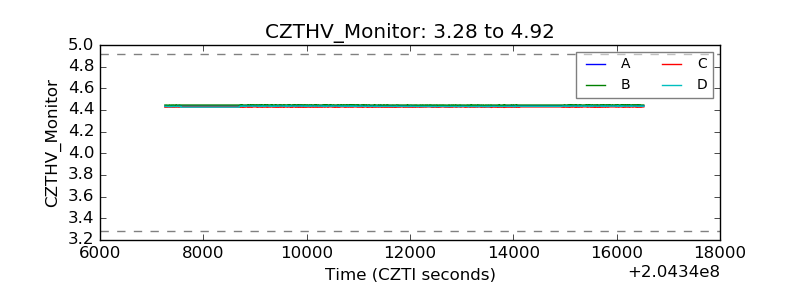 |
| D_VDD | 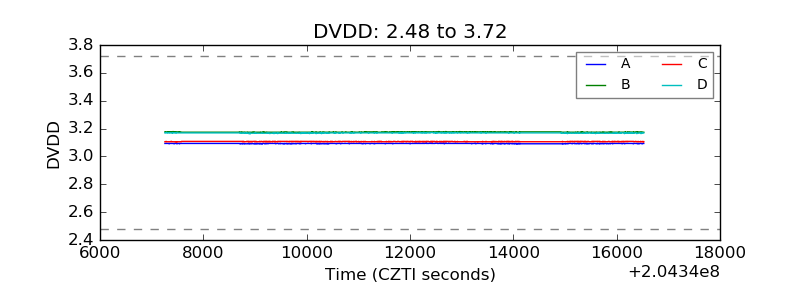 |
| Temperature 1 | 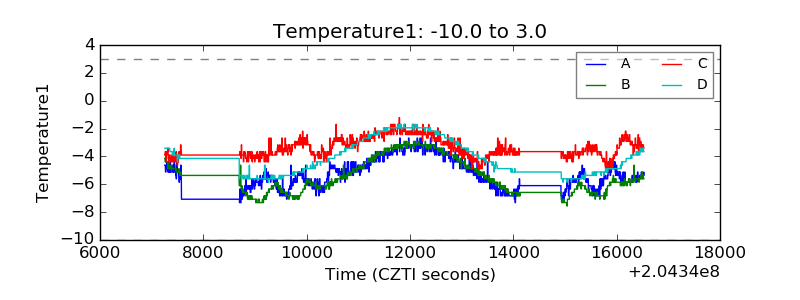 |
| Veto HV Monitor | 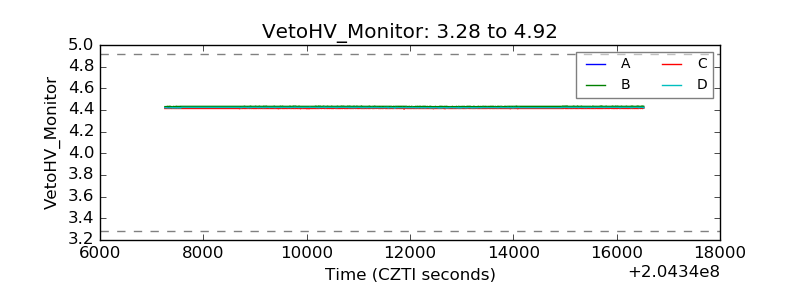 |
| Veto LLD | 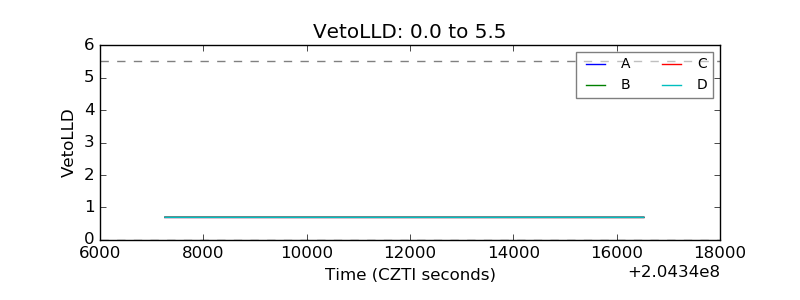 |
| Alpha Counter | 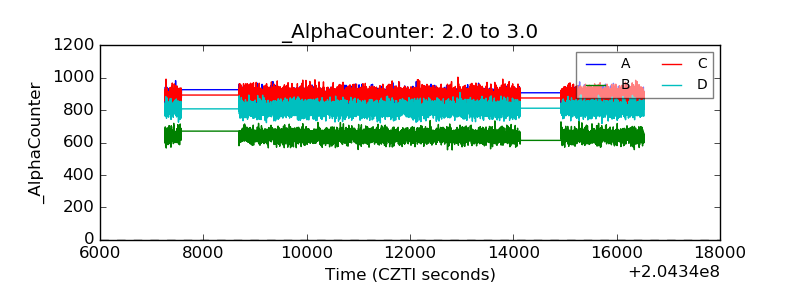 |
| _CPM_Rate | 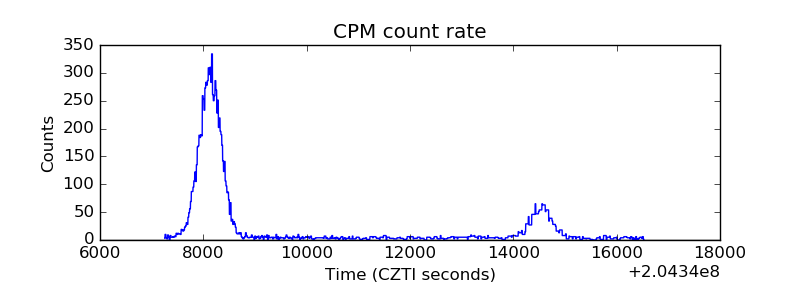 |
| CZT Counter | 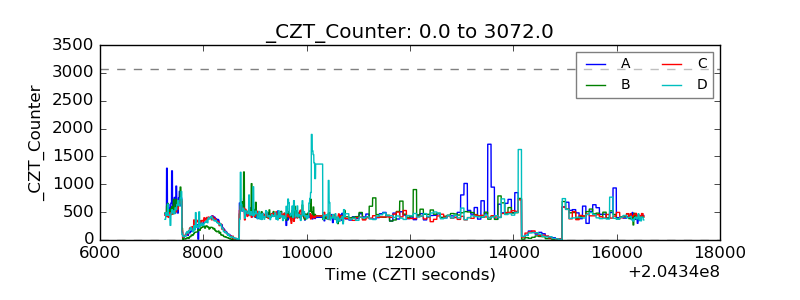 |
| +2.5 Volts monitor |  |
| +5 Volts monitor |  |
| _ROLL_ROT | 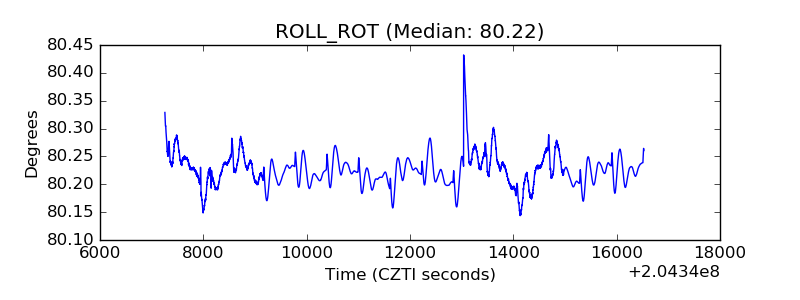 |
| _Roll_DEC | 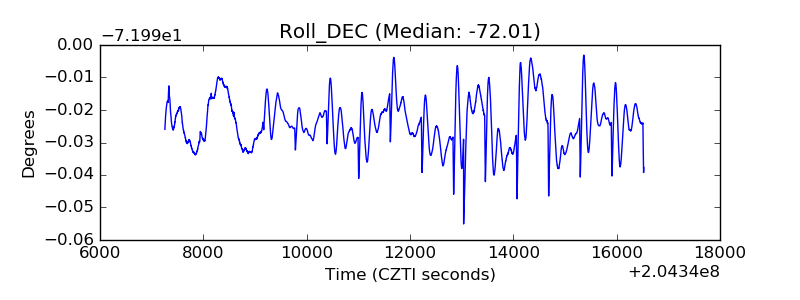 |
| _Roll_RA | 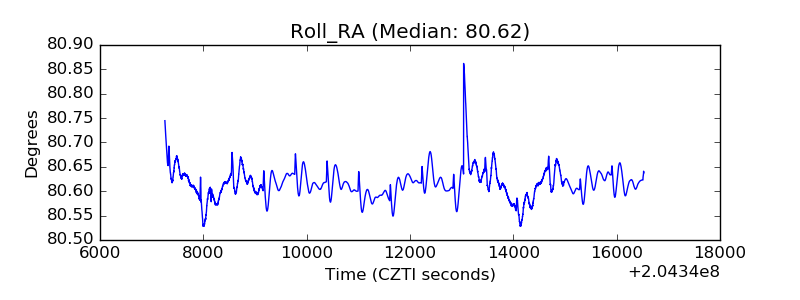 |
| Veto Counter | 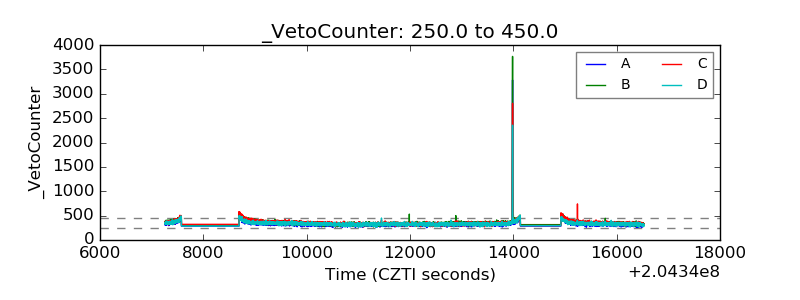 |