| Param | Original file | Final file |
|---|---|---|
| Filename | modeM0/AS1G05_247T01_9000000512_03984cztM0_level2.evt | modeM0/AS1G05_247T01_9000000512_03984cztM0_level2_quad_clean.evt |
| Size (bytes) | 451,391,040 | 105,900,480 |
| Size | 430.5 MB | 101.0 MB |
| Events in quadrant A | 3,524,124 | 678,612 |
| Events in quadrant B | 3,356,670 | 690,993 |
| Events in quadrant C | 3,052,622 | 691,701 |
| Events in quadrant D | 3,272,891 | 670,290 |
| Mode SS | |||
|---|---|---|---|
| Quadrant | BADHDUFLAG | Total packets | Discarded packets |
| A | 0 | 140 | 0 |
| B | 0 | 140 | 0 |
| C | 0 | 140 | 0 |
| D | 0 | 140 | 0 |
| Mode M9 | |||
|---|---|---|---|
| Quadrant | BADHDUFLAG | Total packets | Discarded packets |
| A | 0 | 3 | 0 |
| B | 0 | 3 | 0 |
| C | 0 | 3 | 0 |
| D | 0 | 3 | 0 |
| Mode M0 | |||
|---|---|---|---|
| Quadrant | BADHDUFLAG | Total packets | Discarded packets |
| A | 0 | 15447 | 2 |
| B | 0 | 14662 | 1 |
| C | 0 | 14074 | 1 |
| D | 0 | 14902 | 1 |
| Quadrant | Total seconds | Saturated seconds | Saturation percentage |
|---|---|---|---|
| A | 6822 | 311 | 4.558780% |
| B | 6822 | 170 | 2.491938% |
| C | 6822 | 132 | 1.934916% |
| D | 6822 | 155 | 2.272061% |
Noise dominated data is calculated using 1-second bins in cleaned event files. If a bin has >2000 counts, and if more than 50% of those come from <1% of pixels, then it is considered to be noise-dominated and hence unusable.
| Quadrant | # 1 sec bins | Bins with >0 counts | Bins with >2000 counts | High rate bins dominated by noise | Noise dominated (total time) | Noise dominated (detector-on time) | Marked lightcurve |
|---|---|---|---|---|---|---|---|
| A | 7067 | 6824 | 125 | 125 | 1.77% | 1.83% | 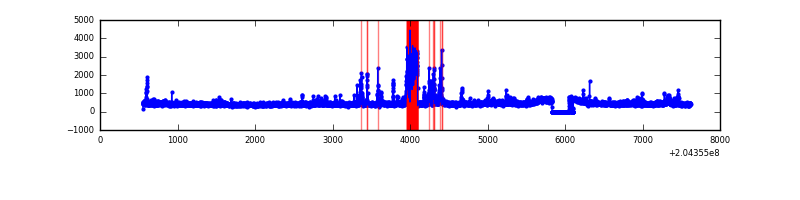 |
| B | 7067 | 6824 | 15 | 15 | 0.21% | 0.22% | 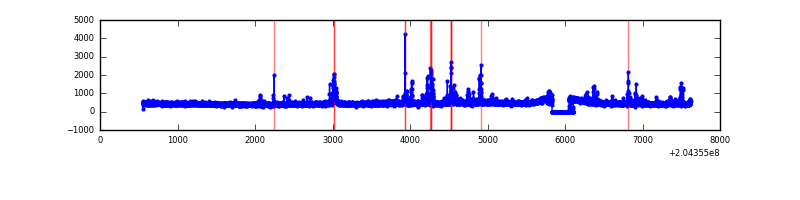 |
| C | 7067 | 6824 | 0 | 0 | 0.00% | 0.00% | 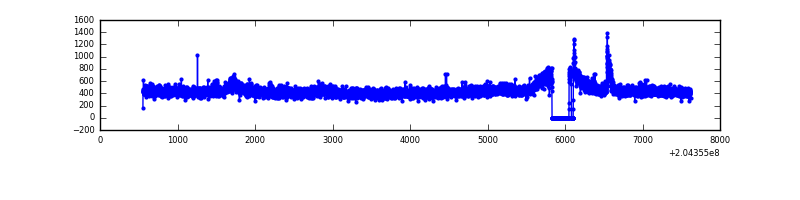 |
| D | 7067 | 6824 | 13 | 13 | 0.18% | 0.19% | 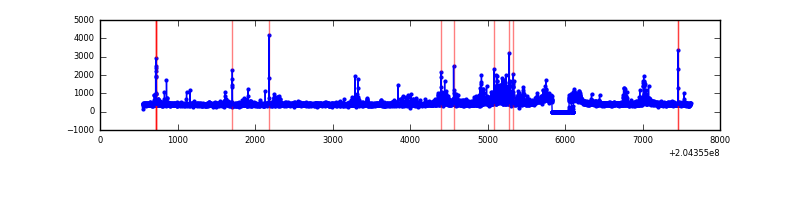 |
Top three noisy pixels from each quadrant. If the there are fewer than three noisy pixels in the level2.evt file, extra rows are filled as -1
| Pixel properties | Quadrant properties | ||||||
|---|---|---|---|---|---|---|---|
| Quadrant | DetID | PixID | Counts | Sigma | Mean | Median | Sigma |
| A | 15 | 236 | 267227 | 1719.61 | 753 | 734 | 155.0 |
| A | 0 | 50 | 144497 | 927.66 | 753 | 734 | 155.0 |
| A | 0 | 118 | 99844 | 639.53 | 753 | 734 | 155.0 |
| B | 14 | 167 | 239095 | 1630.03 | 766 | 744 | 146.2 |
| B | 15 | 204 | 67149 | 454.13 | 766 | 744 | 146.2 |
| B | 7 | 252 | 31434 | 209.88 | 766 | 744 | 146.2 |
| C | 9 | 144 | 128113 | 732.96 | 748 | 749 | 173.8 |
| C | 13 | 61 | 6158 | 31.13 | 748 | 749 | 173.8 |
| C | 3 | 202 | 1831 | 6.23 | 748 | 749 | 173.8 |
| D | 2 | 63 | 223393 | 1255.13 | 742 | 720 | 177.4 |
| D | 13 | 239 | 91155 | 509.75 | 742 | 720 | 177.4 |
| D | 10 | 246 | 33360 | 183.98 | 742 | 720 | 177.4 |
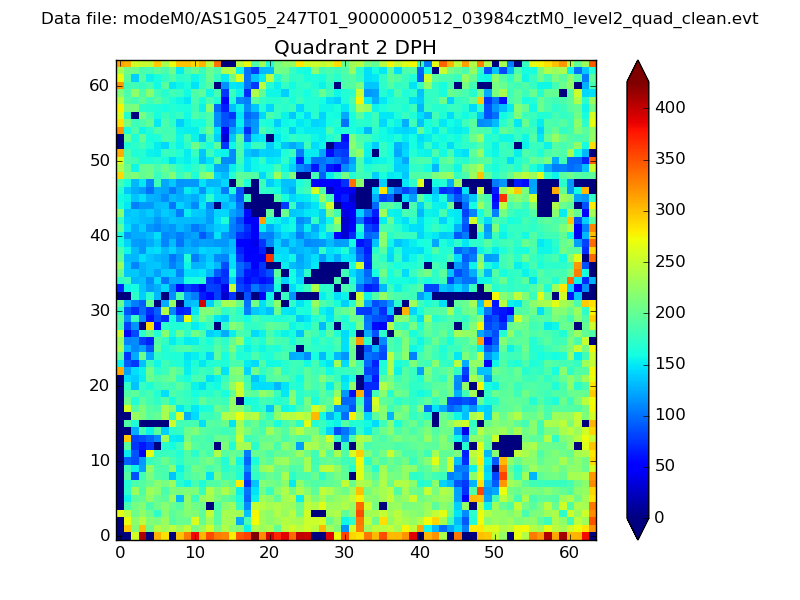
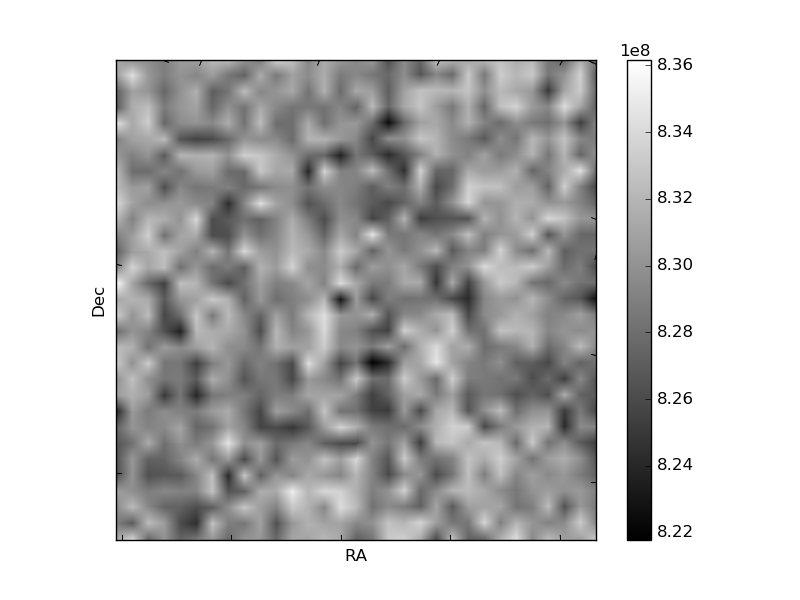
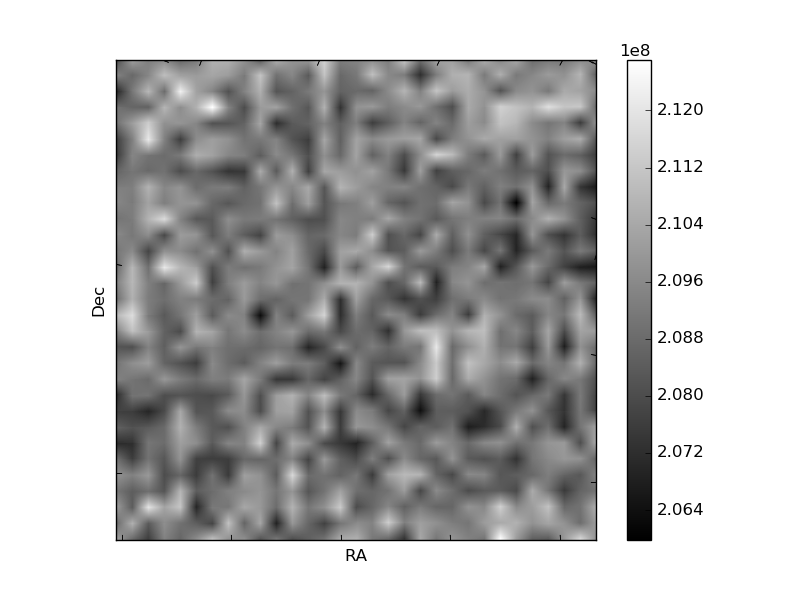
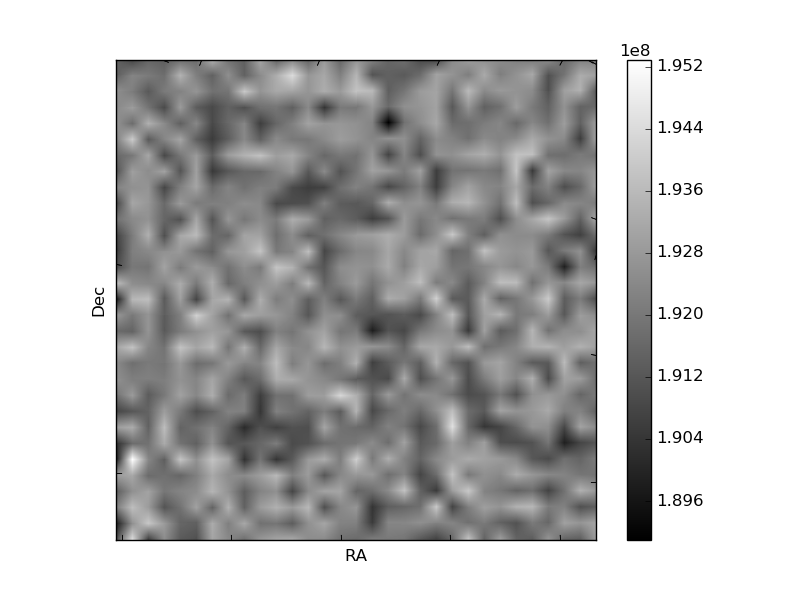
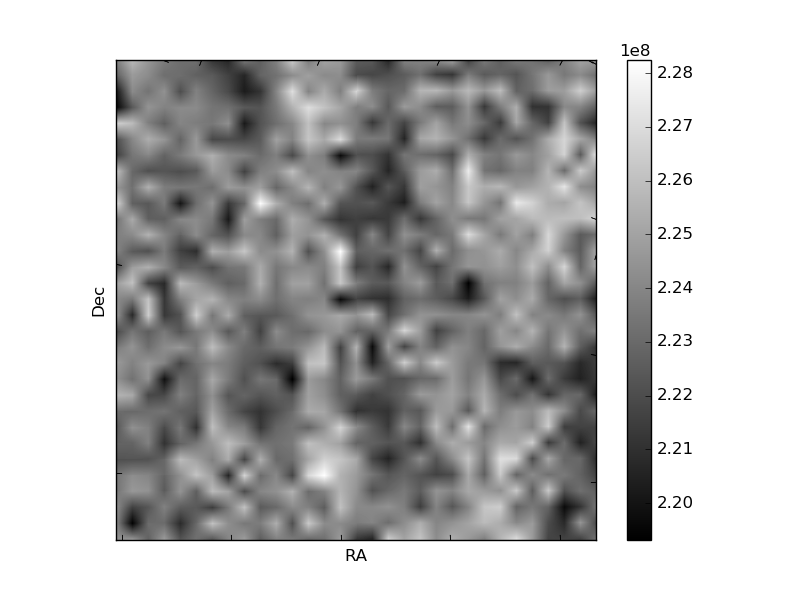
Histogram calculated using DETX and DETY for each event in the final _common_clean file
| Quadrant A | 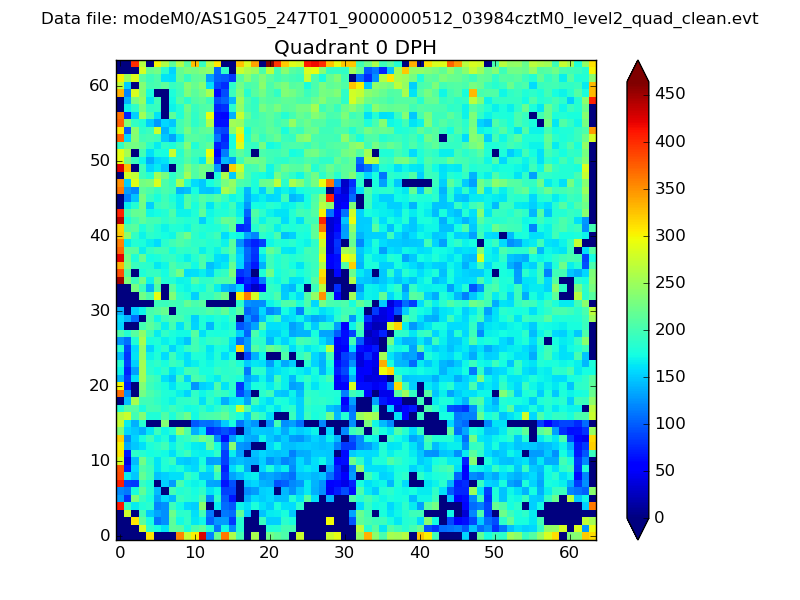 |
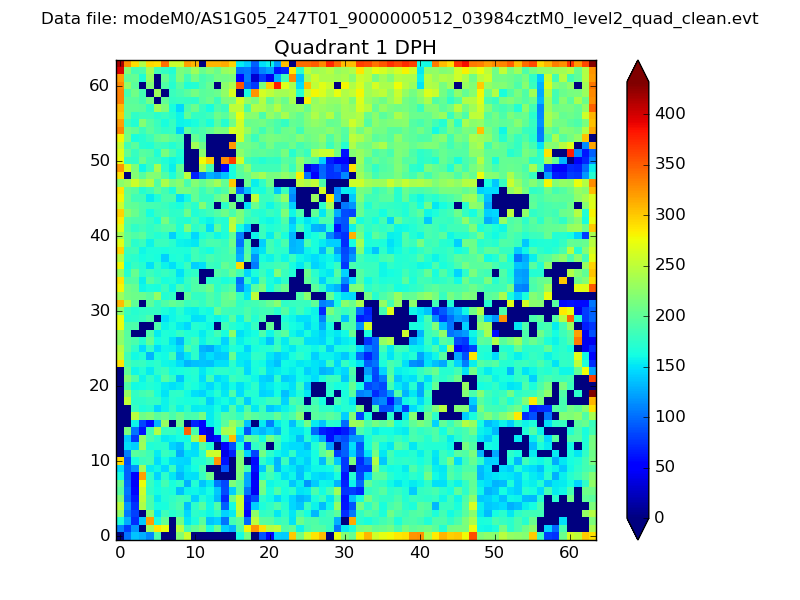 |
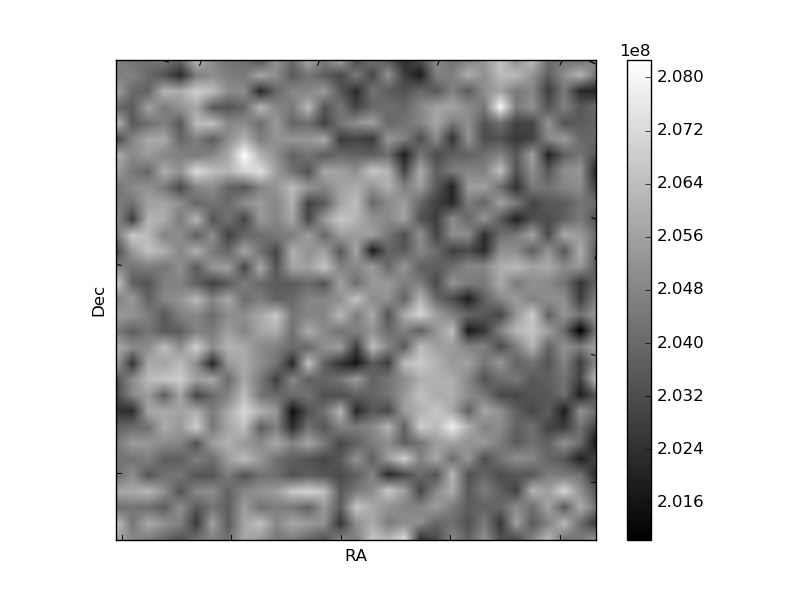
Quadrant B |
|---|---|---|---|
| Quadrant D | 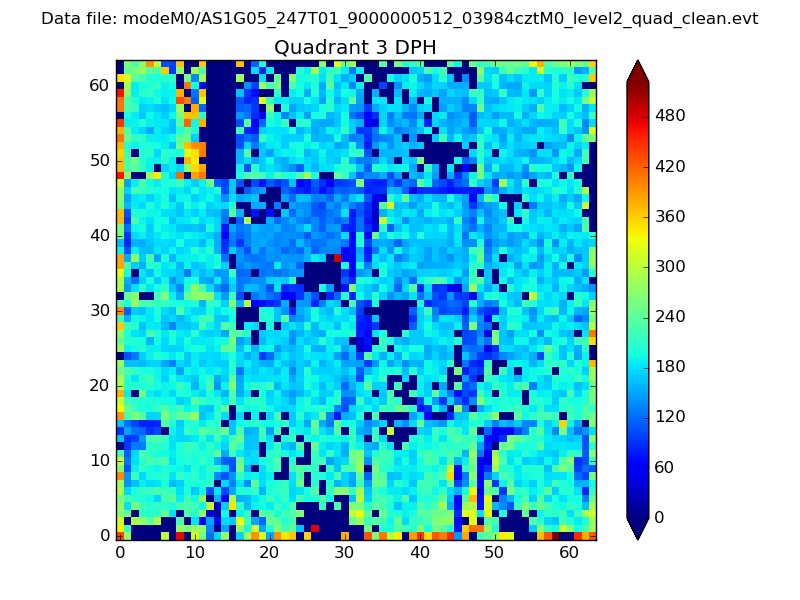 |
 |
Quadrant C |
| Plot type | Count rate plots | Images |
|---|---|---|
| Comparison with Poisson distribution Blue bars denote a histogram of data divided into 1 sec bins. Red curve is a Poisson curve with rate = median count rate of data. |
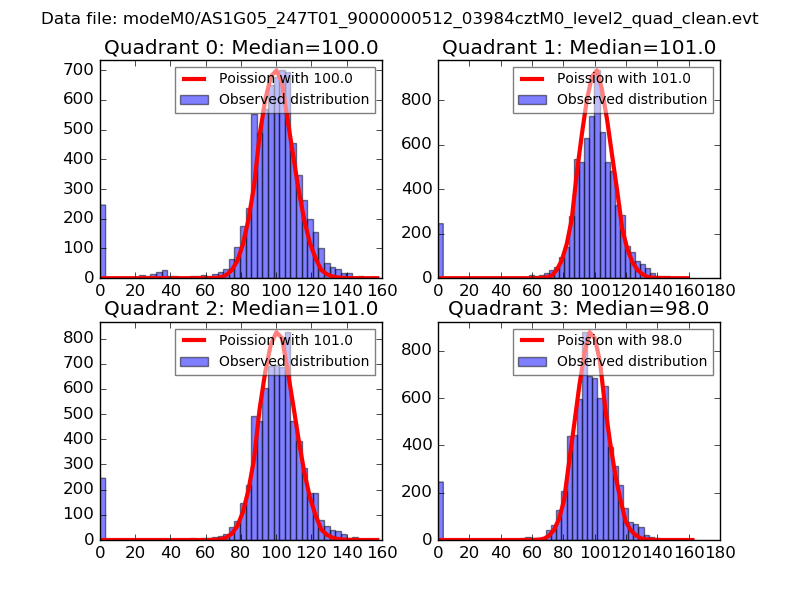 |
 |
| Quadrant-wise count rates Data is divided into 100 sec bins |
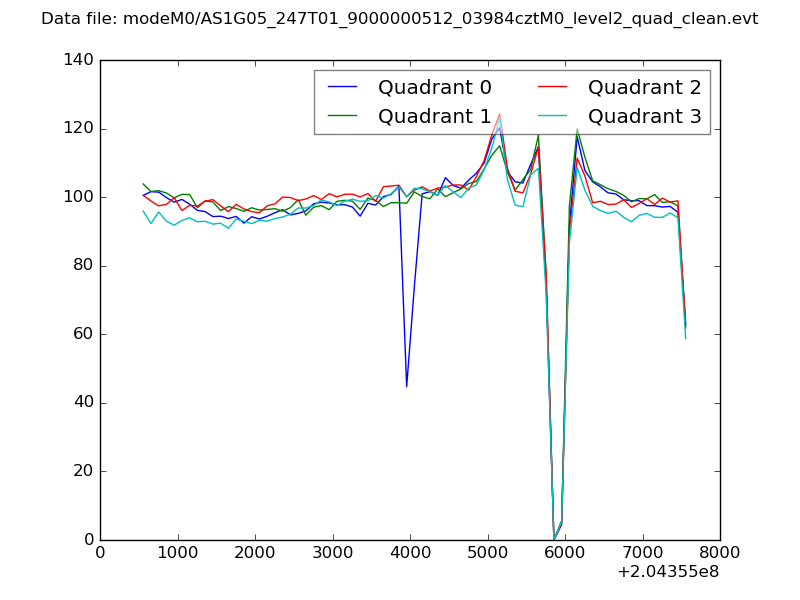 |
|
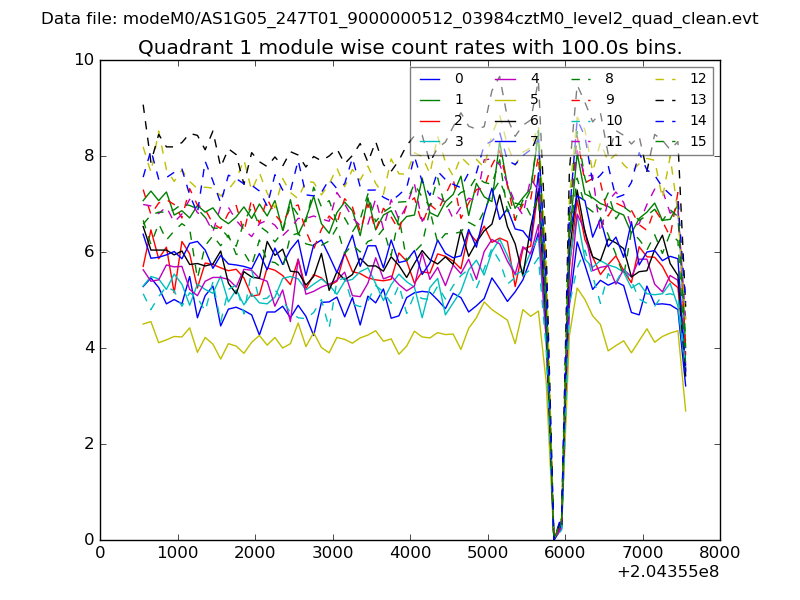
| Module-wise count rates for Quadrant A Data is divided into 100 sec bins |
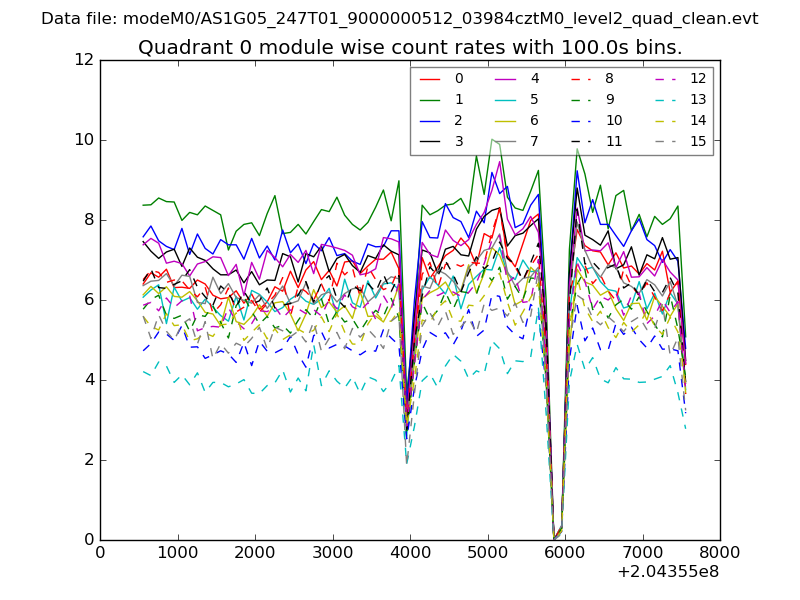 |
 |
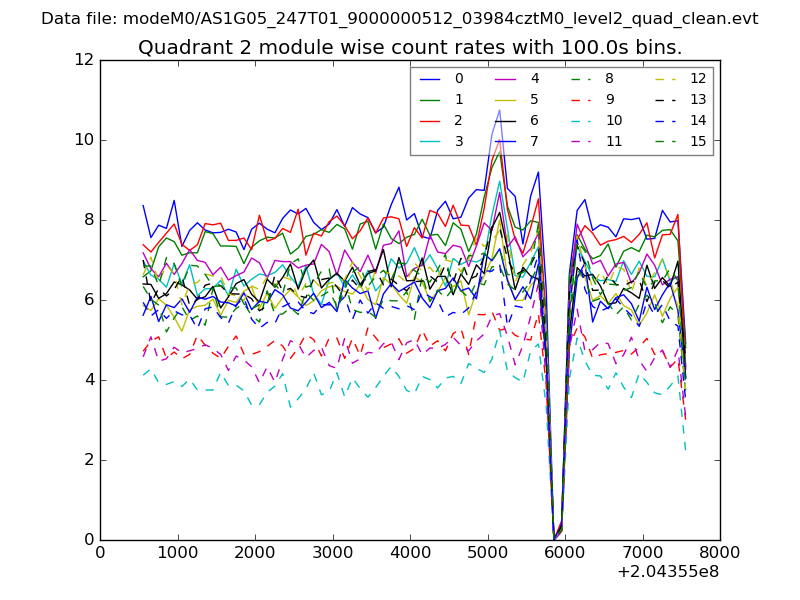
| Module-wise count rates for Quadrant B Data is divided into 100 sec bins |
 |
 |
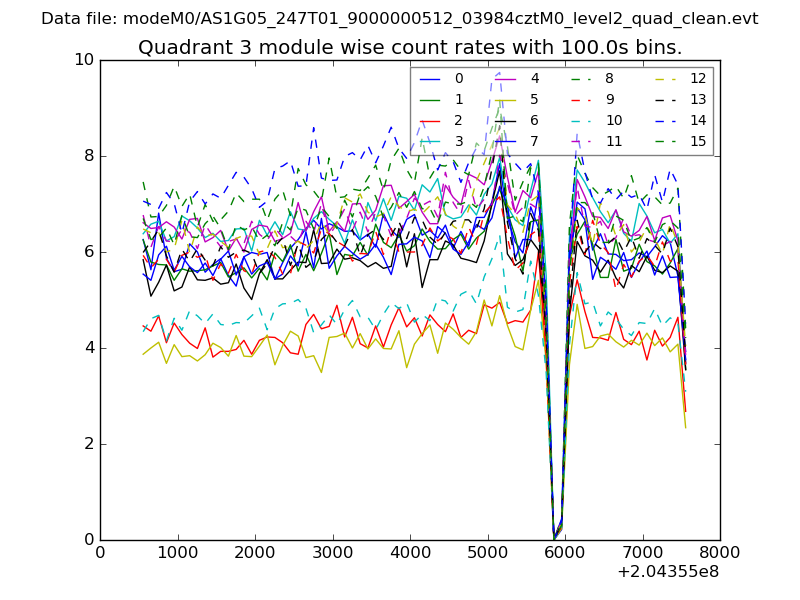
| Module-wise count rates for Quadrant C Data is divided into 100 sec bins |
 |
 |
| Module-wise count rates for Quadrant D Data is divided into 100 sec bins |
 |
 |
| Parameter | Plot |
|---|---|
| CZT HV Monitor | 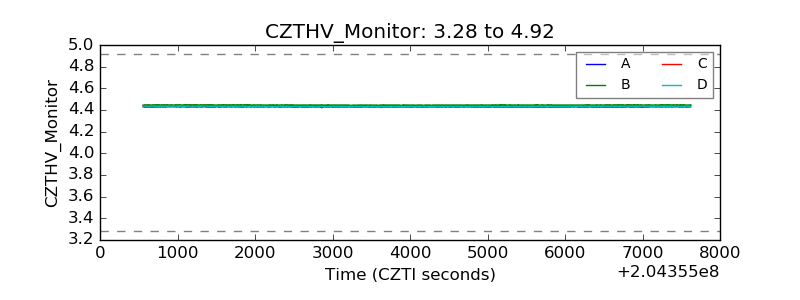 |
| D_VDD | 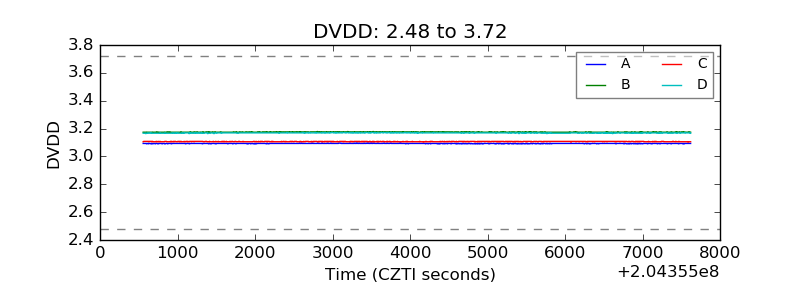 |
| Temperature 1 | 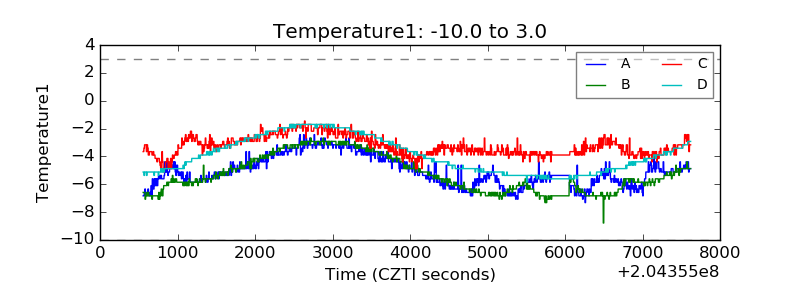 |
| Veto HV Monitor | 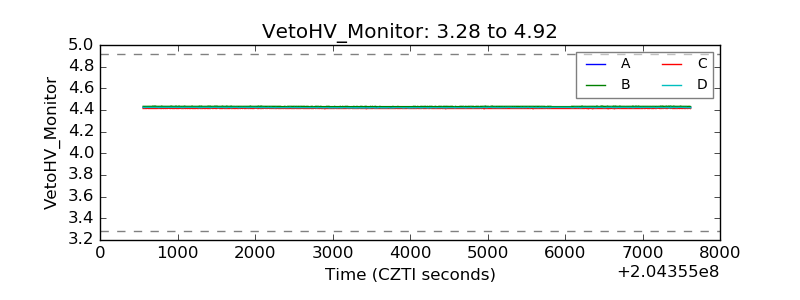 |
| Veto LLD | 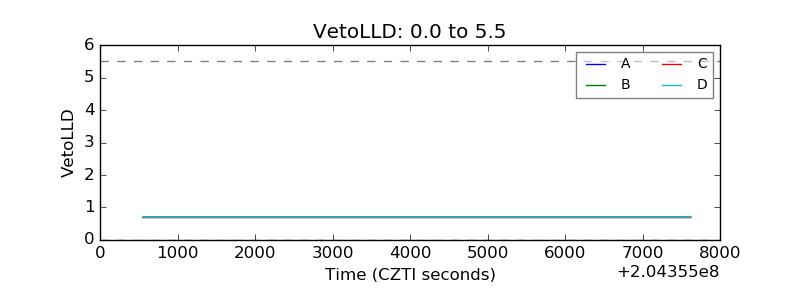 |
| Alpha Counter | 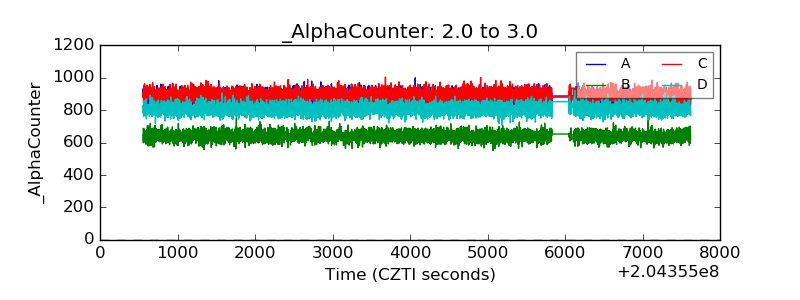 |
| _CPM_Rate | 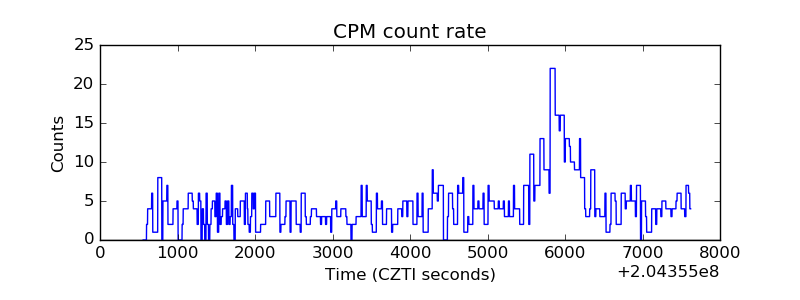 |
| CZT Counter | 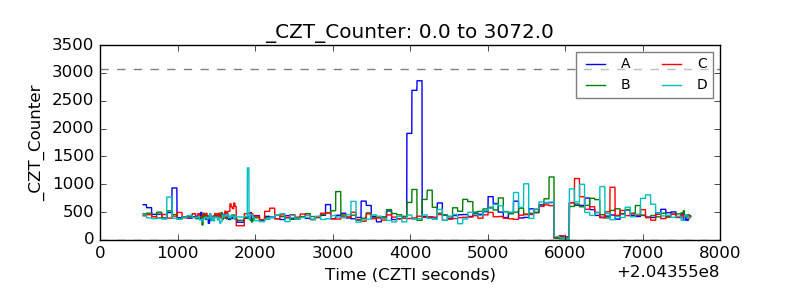 |
| +2.5 Volts monitor |  |
| +5 Volts monitor | 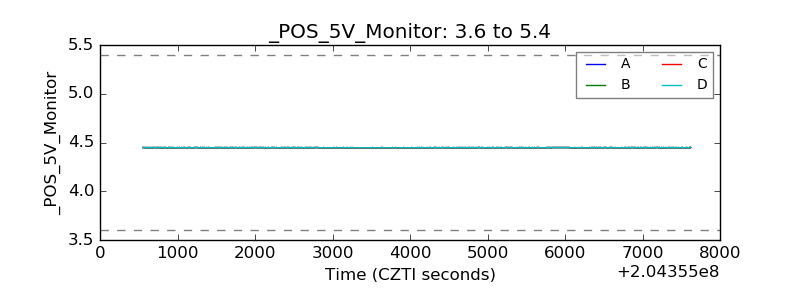 |
| _ROLL_ROT | 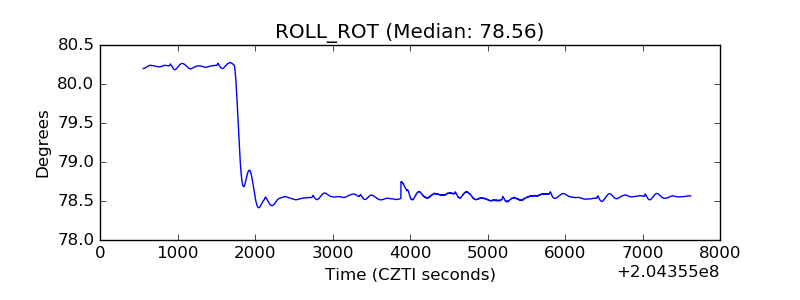 |
| _Roll_DEC | 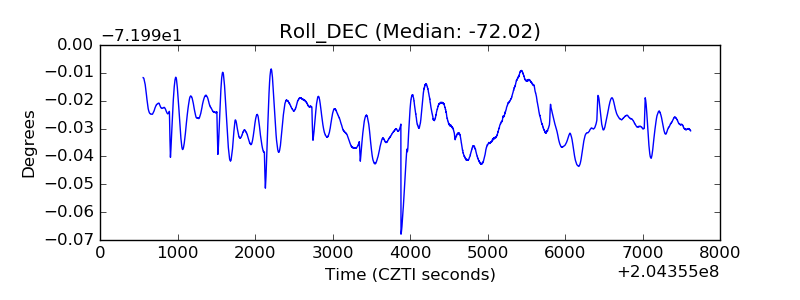 |
| _Roll_RA | 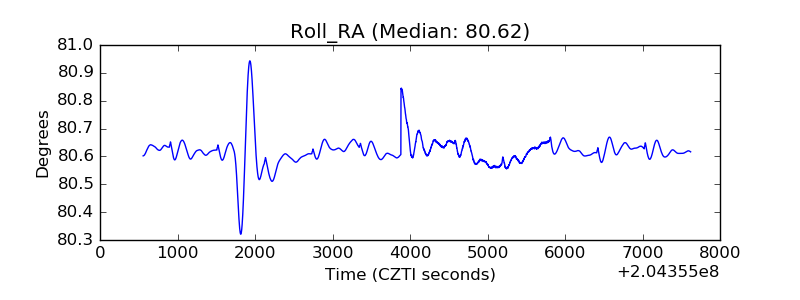 |
| Veto Counter | 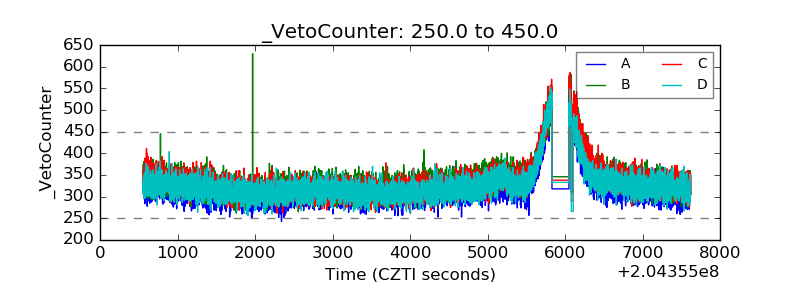 |