| Param | Original file | Final file |
|---|---|---|
| Filename | modeM0/AS1G05_247T01_9000000512_03985cztM0_level2.evt | modeM0/AS1G05_247T01_9000000512_03985cztM0_level2_quad_clean.evt |
| Size (bytes) | 569,240,640 | 116,858,880 |
| Size | 542.9 MB | 111.4 MB |
| Events in quadrant A | 4,021,723 | 757,199 |
| Events in quadrant B | 3,988,802 | 763,758 |
| Events in quadrant C | 3,304,876 | 770,322 |
| Events in quadrant D | 5,405,506 | 716,323 |
| Mode SS | |||
|---|---|---|---|
| Quadrant | BADHDUFLAG | Total packets | Discarded packets |
| A | 0 | 152 | 0 |
| B | 0 | 152 | 0 |
| C | 0 | 152 | 0 |
| D | 0 | 152 | 0 |
| Mode M0 | |||
|---|---|---|---|
| Quadrant | BADHDUFLAG | Total packets | Discarded packets |
| A | 0 | 17477 | 1 |
| B | 0 | 17070 | 0 |
| C | 0 | 15654 | 0 |
| D | 0 | 21597 | 0 |
| Quadrant | Total seconds | Saturated seconds | Saturation percentage |
|---|---|---|---|
| A | 7637 | 299 | 3.915150% |
| B | 7637 | 221 | 2.893806% |
| C | 7637 | 84 | 1.099908% |
| D | 7637 | 722 | 9.453974% |
Noise dominated data is calculated using 1-second bins in cleaned event files. If a bin has >2000 counts, and if more than 50% of those come from <1% of pixels, then it is considered to be noise-dominated and hence unusable.
| Quadrant | # 1 sec bins | Bins with >0 counts | Bins with >2000 counts | High rate bins dominated by noise | Noise dominated (total time) | Noise dominated (detector-on time) | Marked lightcurve |
|---|---|---|---|---|---|---|---|
| A | 7637 | 7637 | 74 | 74 | 0.97% | 0.97% | 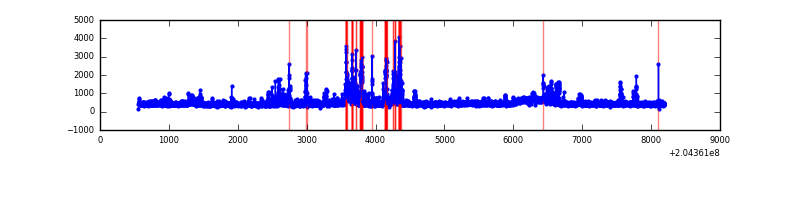 |
| B | 7637 | 7637 | 57 | 57 | 0.75% | 0.75% | 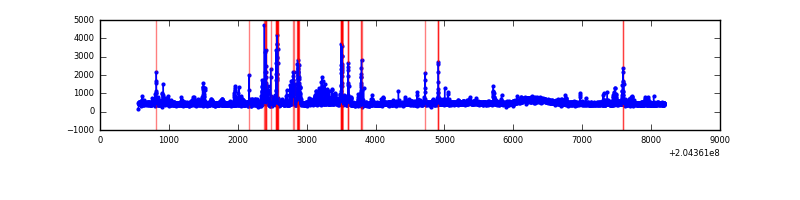 |
| C | 7637 | 7637 | 0 | 0 | 0.00% | 0.00% | 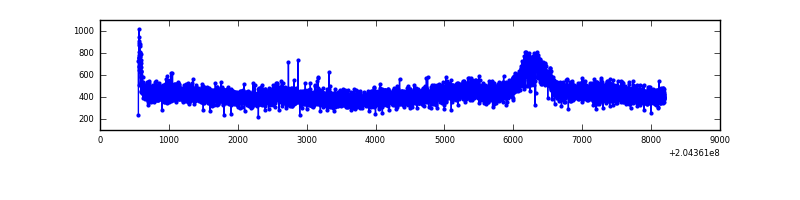 |
| D | 7637 | 7637 | 603 | 603 | 7.90% | 7.90% | 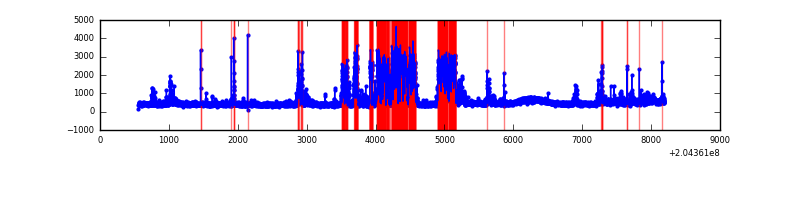 |
Top three noisy pixels from each quadrant. If the there are fewer than three noisy pixels in the level2.evt file, extra rows are filled as -1
| Pixel properties | Quadrant properties | ||||||
|---|---|---|---|---|---|---|---|
| Quadrant | DetID | PixID | Counts | Sigma | Mean | Median | Sigma |
| A | 0 | 50 | 412424 | 2358.37 | 848 | 828 | 174.5 |
| A | 4 | 48 | 148858 | 848.19 | 848 | 828 | 174.5 |
| A | 0 | 118 | 125773 | 715.91 | 848 | 828 | 174.5 |
| B | 14 | 167 | 472273 | 2886.04 | 858 | 836 | 163.4 |
| B | 15 | 204 | 88229 | 535.0 | 858 | 836 | 163.4 |
| B | 7 | 252 | 45889 | 275.8 | 858 | 836 | 163.4 |
| C | 9 | 144 | 19236 | 94.74 | 837 | 837 | 194.2 |
| C | 10 | 65 | 12017 | 57.57 | 837 | 837 | 194.2 |
| C | 13 | 61 | 7188 | 32.7 | 837 | 837 | 194.2 |
| D | 12 | 110 | 1671783 | 8522.13 | 815 | 790 | 196.1 |
| D | 2 | 63 | 195677 | 993.93 | 815 | 790 | 196.1 |
| D | 13 | 239 | 124981 | 633.38 | 815 | 790 | 196.1 |
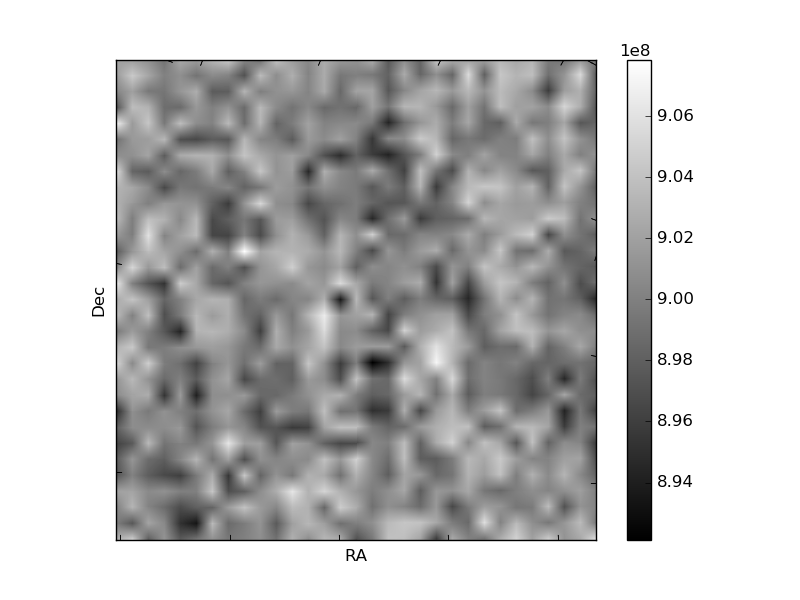
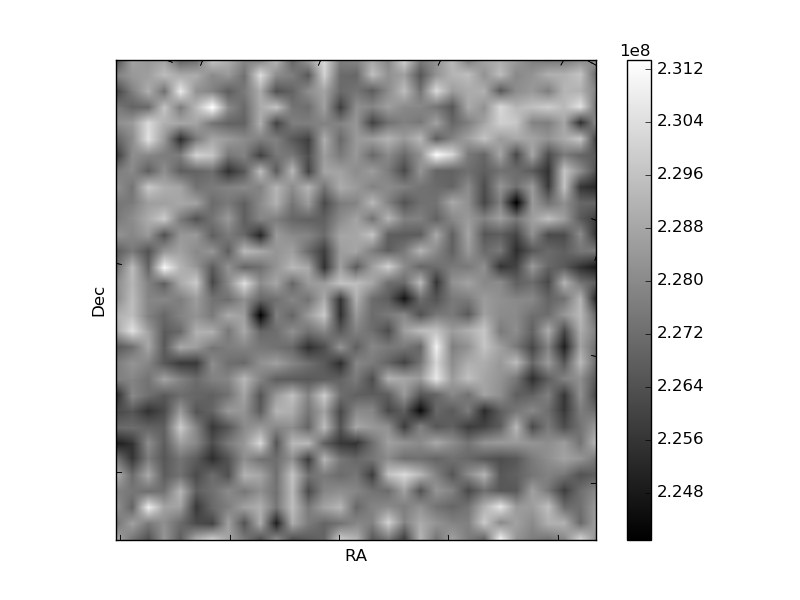
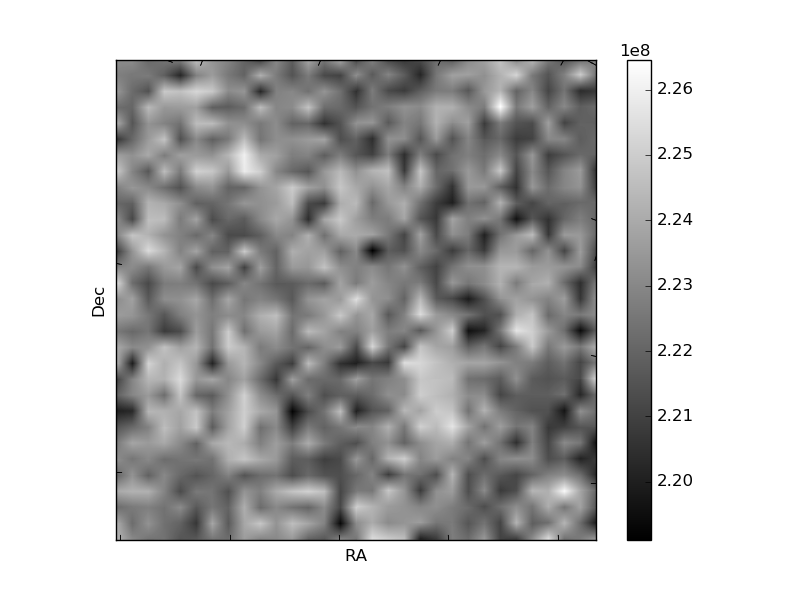
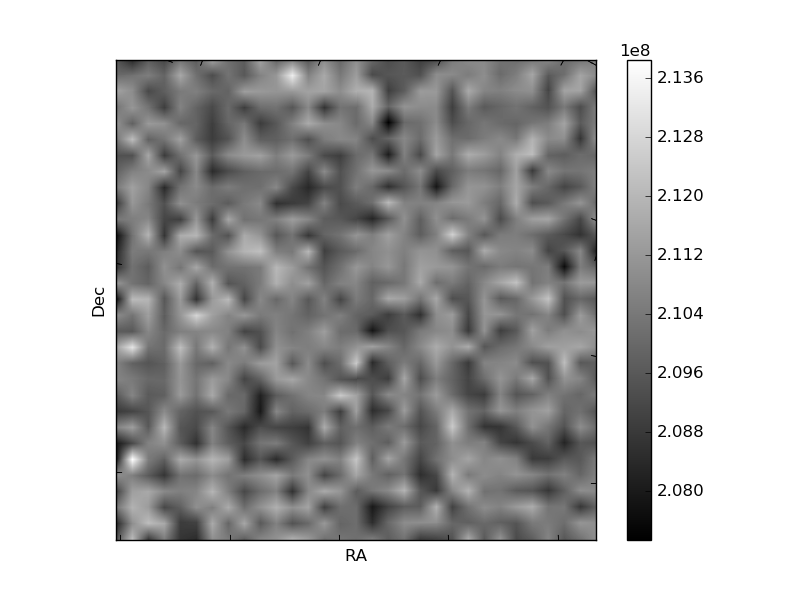
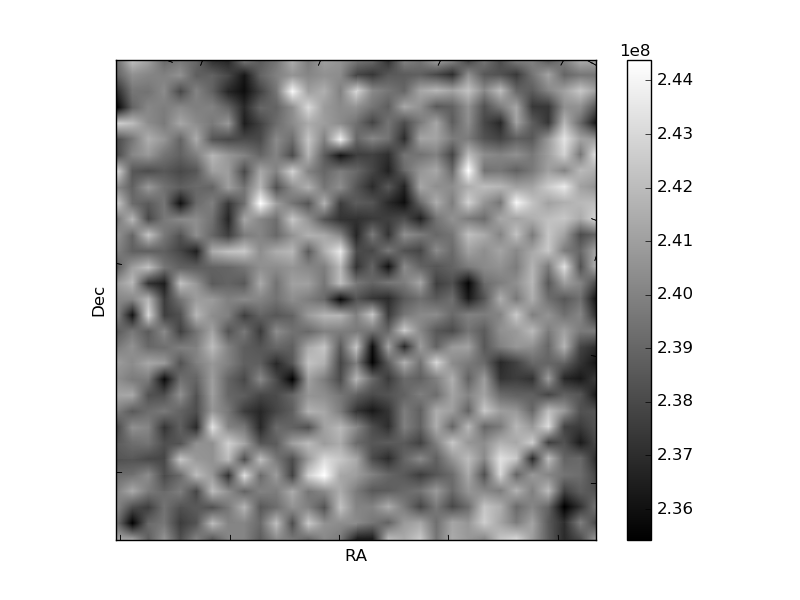
Histogram calculated using DETX and DETY for each event in the final _common_clean file
| Quadrant A | 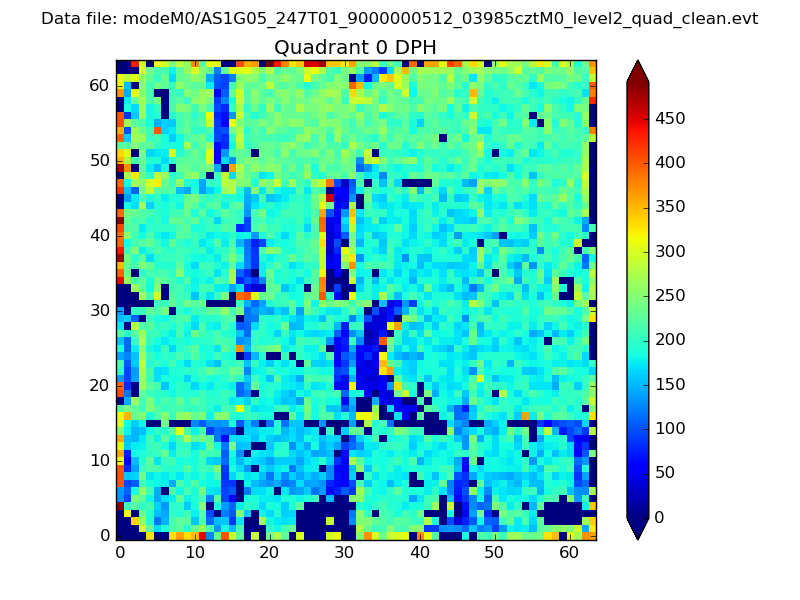 |
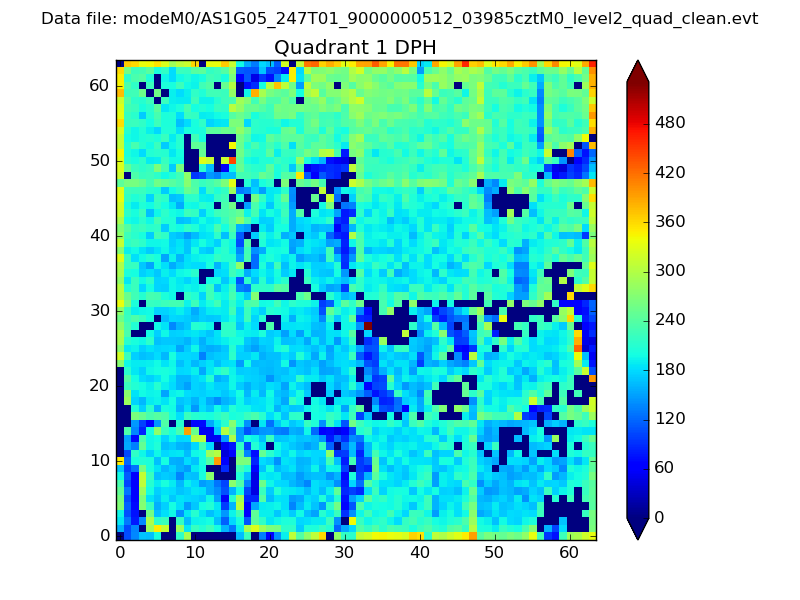 |
Quadrant B |
|---|---|---|---|
| Quadrant D | 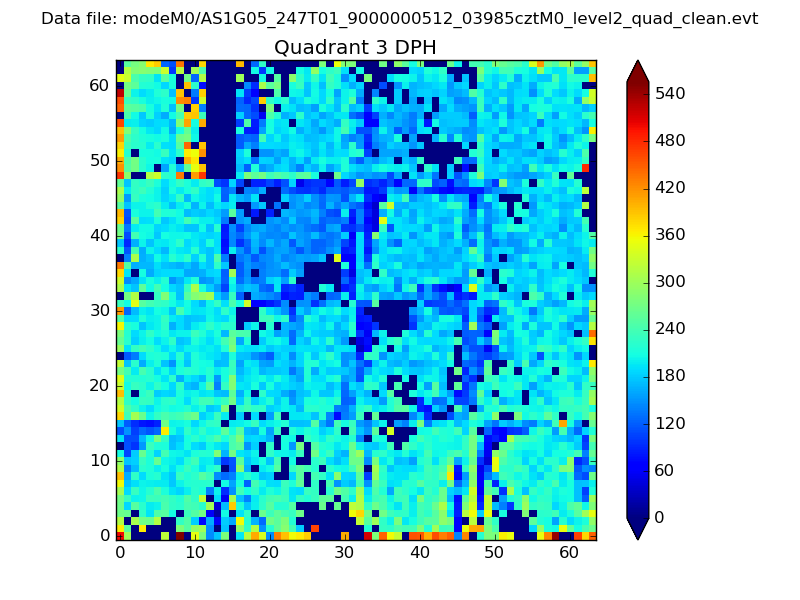 |
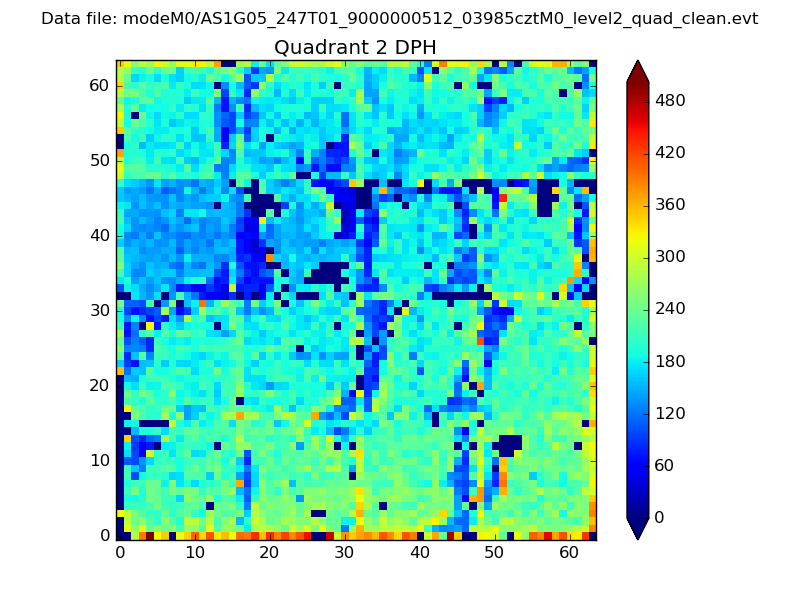 |
Quadrant C |
| Plot type | Count rate plots | Images |
|---|---|---|
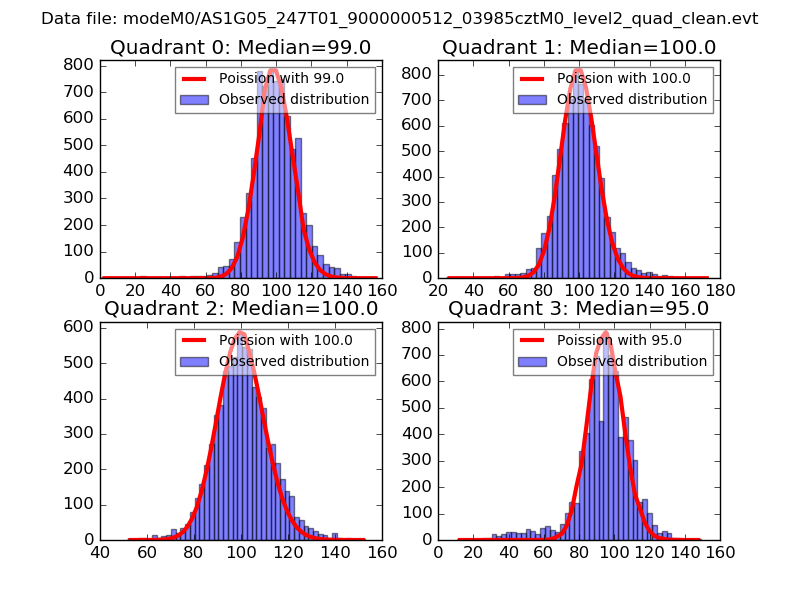
| Comparison with Poisson distribution Blue bars denote a histogram of data divided into 1 sec bins. Red curve is a Poisson curve with rate = median count rate of data. |
 |
 |
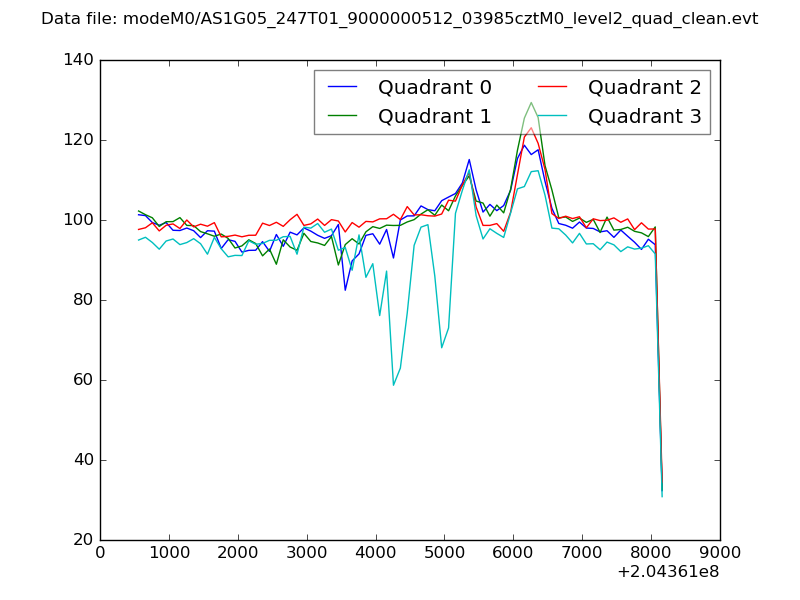
| Quadrant-wise count rates Data is divided into 100 sec bins |
 |
|
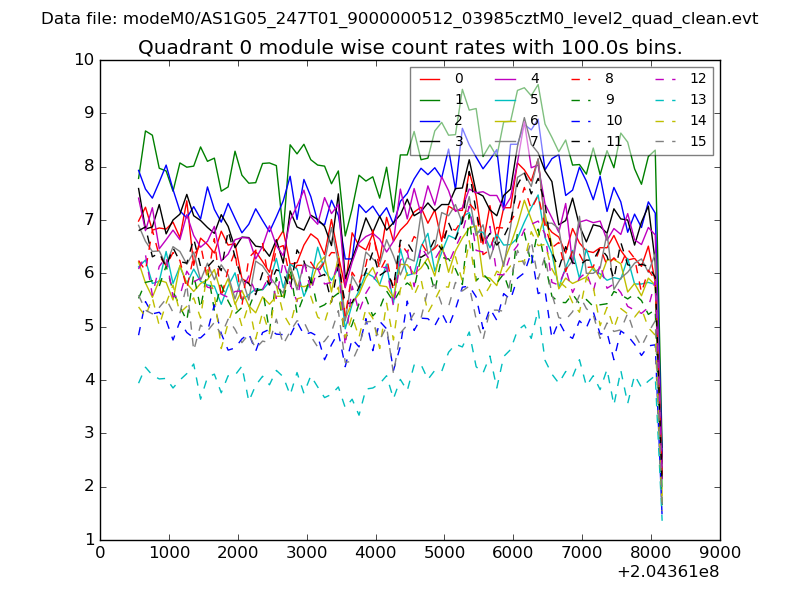
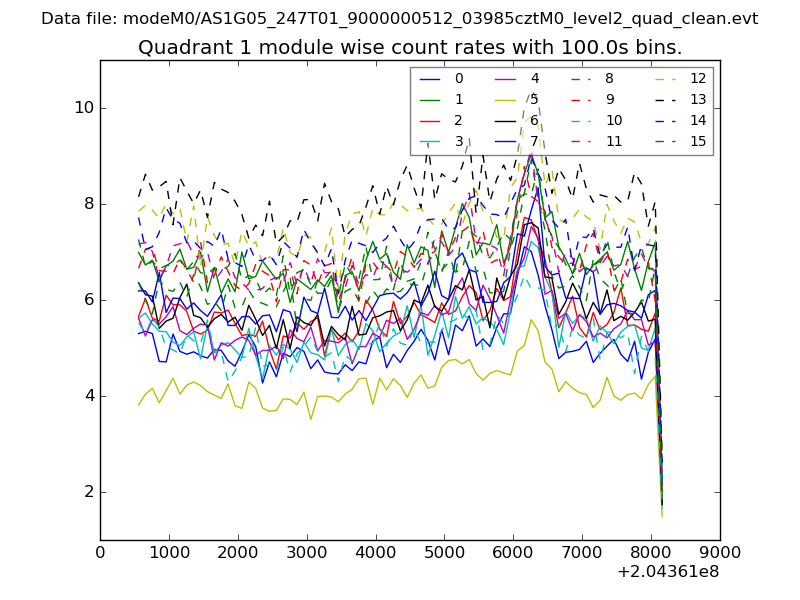
| Module-wise count rates for Quadrant A Data is divided into 100 sec bins |
 |
 |
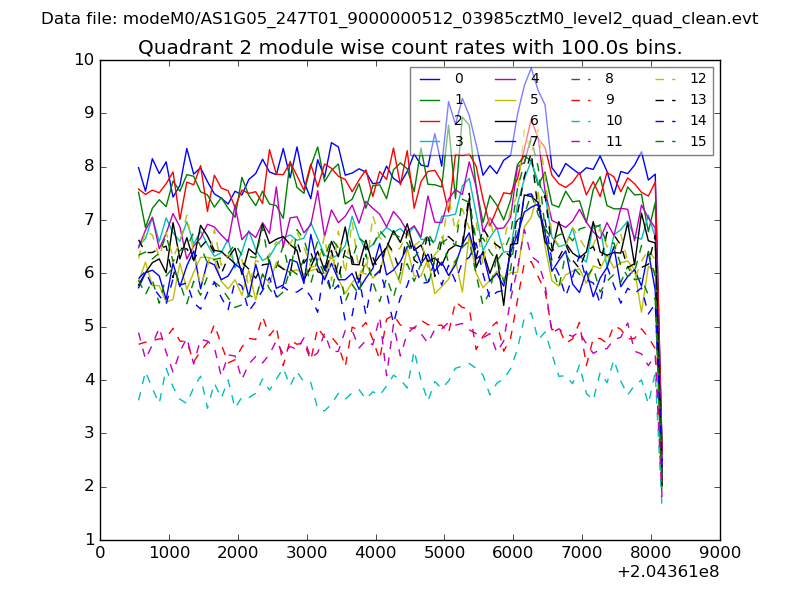
| Module-wise count rates for Quadrant B Data is divided into 100 sec bins |
 |
 |
| Module-wise count rates for Quadrant C Data is divided into 100 sec bins |
 |
 |
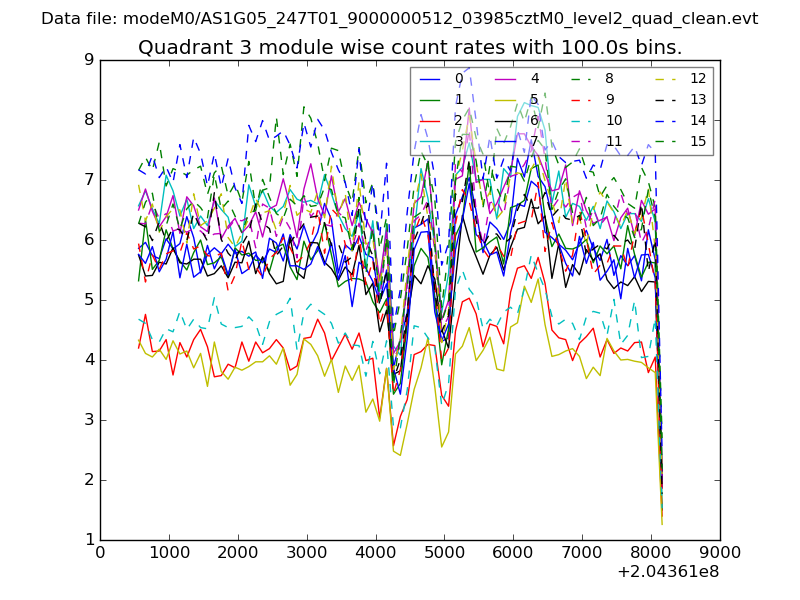
| Module-wise count rates for Quadrant D Data is divided into 100 sec bins |
 |
 |
| Parameter | Plot |
|---|---|
| CZT HV Monitor | 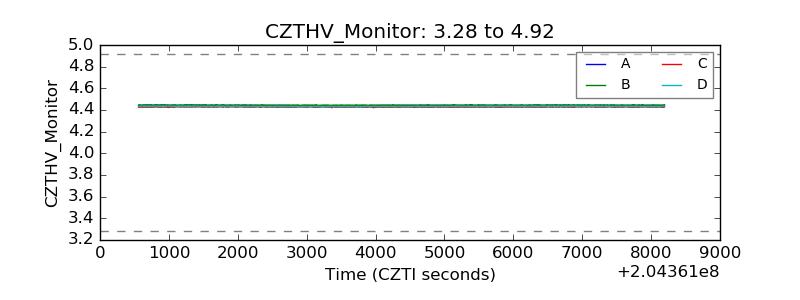 |
| D_VDD | 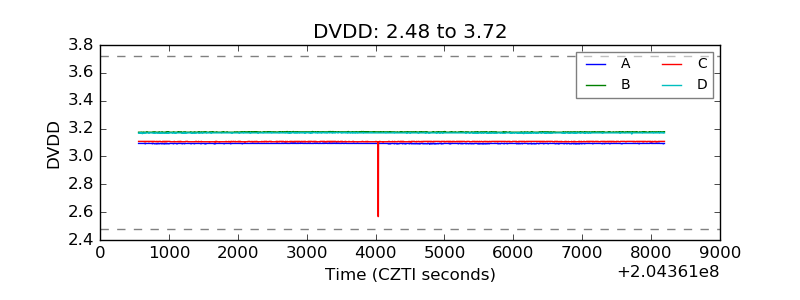 |
| Temperature 1 | 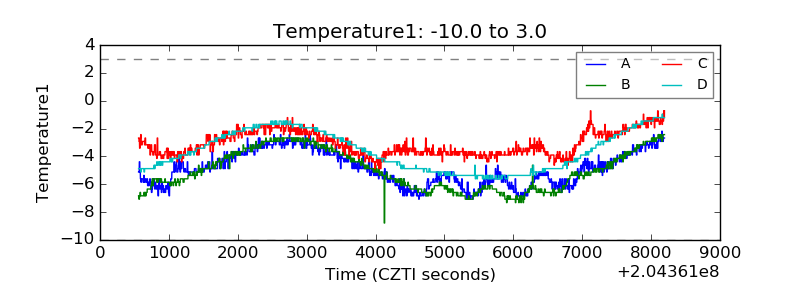 |
| Veto HV Monitor | 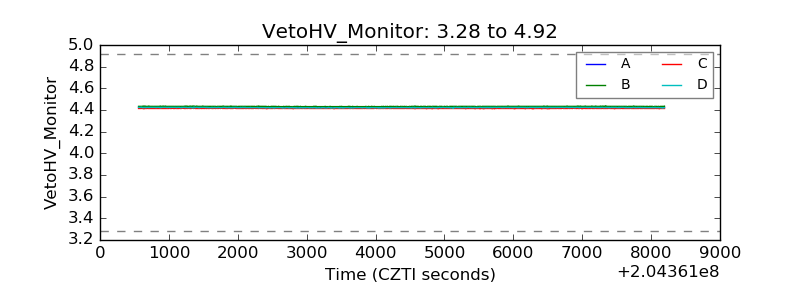 |
| Veto LLD |  |
| Alpha Counter | 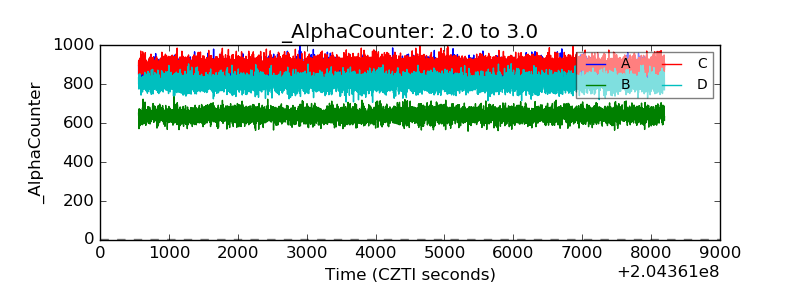 |
| _CPM_Rate | 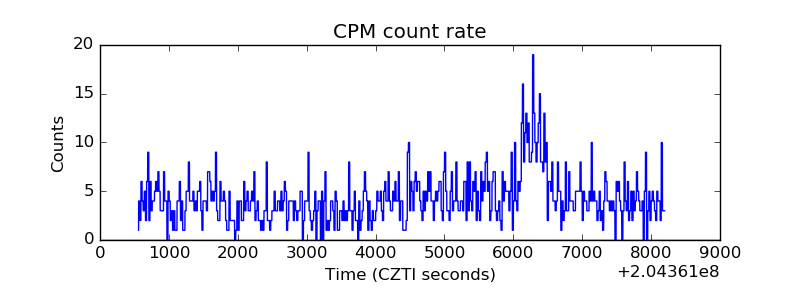 |
| CZT Counter | 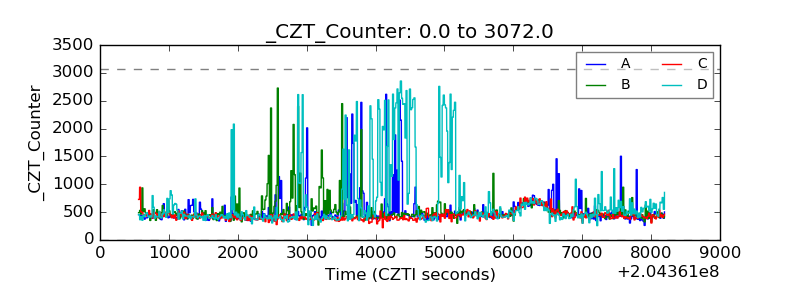 |
| +2.5 Volts monitor |  |
| +5 Volts monitor |  |
| _ROLL_ROT | 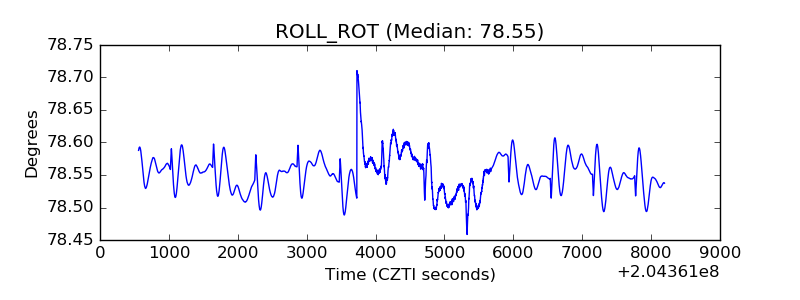 |
| _Roll_DEC | 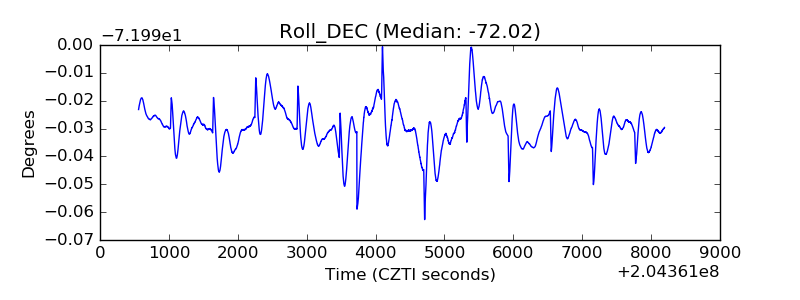 |
| _Roll_RA | 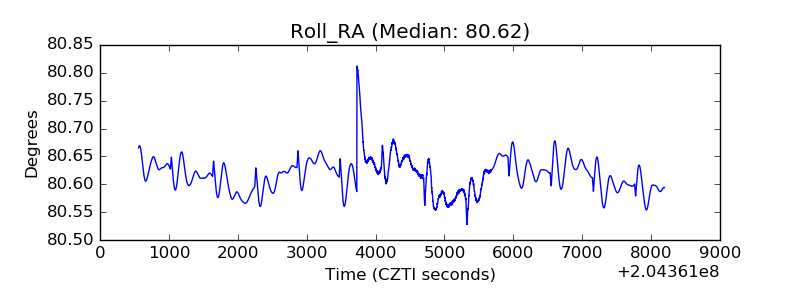 |
| Veto Counter | 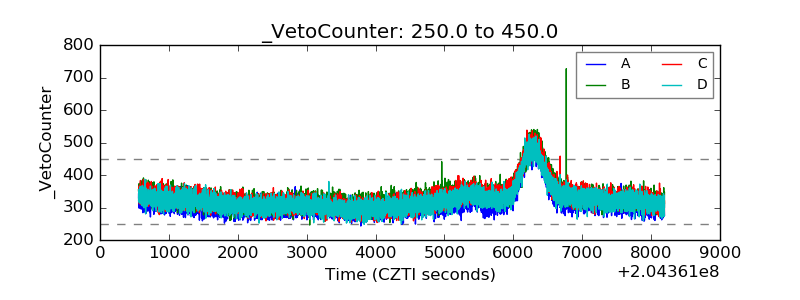 |