| Param | Original file | Final file |
|---|---|---|
| Filename | modeM0/AS1G05_247T01_9000000512_03988cztM0_level2.evt | modeM0/AS1G05_247T01_9000000512_03988cztM0_level2_quad_clean.evt |
| Size (bytes) | 912,939,840 | 191,476,800 |
| Size | 870.6 MB | 182.6 MB |
| Events in quadrant A | 7,925,003 | 1,224,791 |
| Events in quadrant B | 6,722,993 | 1,242,473 |
| Events in quadrant C | 5,323,581 | 1,254,116 |
| Events in quadrant D | 6,821,902 | 1,204,643 |
| Mode SS | |||
|---|---|---|---|
| Quadrant | BADHDUFLAG | Total packets | Discarded packets |
| A | 0 | 256 | 0 |
| B | 0 | 256 | 0 |
| C | 0 | 256 | 0 |
| D | 0 | 256 | 0 |
| Mode M9 | |||
|---|---|---|---|
| Quadrant | BADHDUFLAG | Total packets | Discarded packets |
| A | 0 | 12 | 0 |
| B | 0 | 12 | 0 |
| C | 0 | 12 | 0 |
| D | 0 | 12 | 0 |
| Mode M0 | |||
|---|---|---|---|
| Quadrant | BADHDUFLAG | Total packets | Discarded packets |
| A | 0 | 32541 | 3 |
| B | 0 | 28306 | 2 |
| C | 0 | 25493 | 2 |
| D | 0 | 29381 | 2 |
| Quadrant | Total seconds | Saturated seconds | Saturation percentage |
|---|---|---|---|
| A | 12632 | 538 | 4.259025% |
| B | 12632 | 233 | 1.844522% |
| C | 12632 | 99 | 0.783724% |
| D | 12632 | 398 | 3.150728% |
Noise dominated data is calculated using 1-second bins in cleaned event files. If a bin has >2000 counts, and if more than 50% of those come from <1% of pixels, then it is considered to be noise-dominated and hence unusable.
| Quadrant | # 1 sec bins | Bins with >0 counts | Bins with >2000 counts | High rate bins dominated by noise | Noise dominated (total time) | Noise dominated (detector-on time) | Marked lightcurve |
|---|---|---|---|---|---|---|---|
| A | 13792 | 12634 | 296 | 296 | 2.15% | 2.34% | 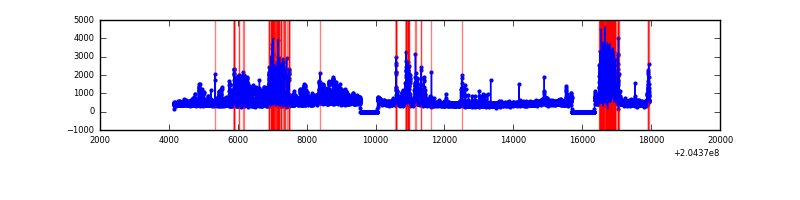 |
| B | 13792 | 12634 | 88 | 88 | 0.64% | 0.70% |  |
| C | 13792 | 12634 | 0 | 0 | 0.00% | 0.00% | 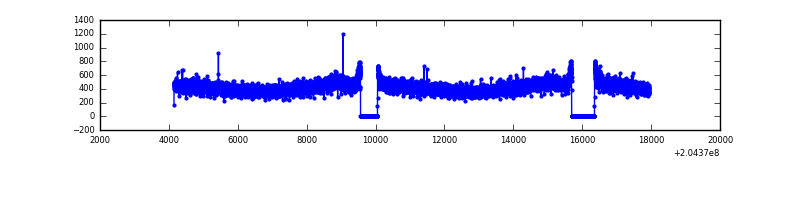 |
| D | 13792 | 12634 | 243 | 243 | 1.76% | 1.92% | 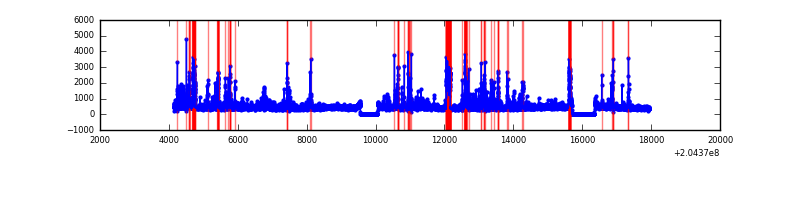 |
Top three noisy pixels from each quadrant. If the there are fewer than three noisy pixels in the level2.evt file, extra rows are filled as -1
| Pixel properties | Quadrant properties | ||||||
|---|---|---|---|---|---|---|---|
| Quadrant | DetID | PixID | Counts | Sigma | Mean | Median | Sigma |
| A | 0 | 50 | 1155446 | 4108.78 | 1373 | 1339 | 280.9 |
| A | 4 | 48 | 1151239 | 4093.8 | 1373 | 1339 | 280.9 |
| A | 0 | 118 | 165947 | 586.03 | 1373 | 1339 | 280.9 |
| B | 14 | 167 | 635145 | 2363.31 | 1402 | 1365 | 268.2 |
| B | 3 | 0 | 323781 | 1202.26 | 1402 | 1365 | 268.2 |
| B | 15 | 204 | 163565 | 604.83 | 1402 | 1365 | 268.2 |
| C | 9 | 144 | 12664 | 36.05 | 1353 | 1355 | 313.7 |
| C | 13 | 61 | 11515 | 32.38 | 1353 | 1355 | 313.7 |
| C | 8 | 128 | 7280 | 18.88 | 1353 | 1355 | 313.7 |
| D | 2 | 63 | 783602 | 2419.45 | 1342 | 1301 | 323.3 |
| D | 10 | 246 | 319933 | 985.44 | 1342 | 1301 | 323.3 |
| D | 2 | 232 | 279419 | 860.15 | 1342 | 1301 | 323.3 |
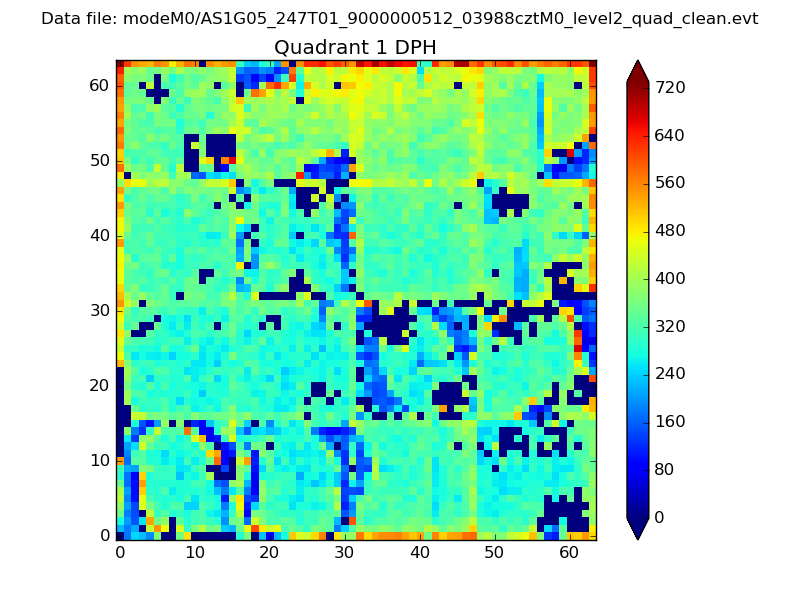
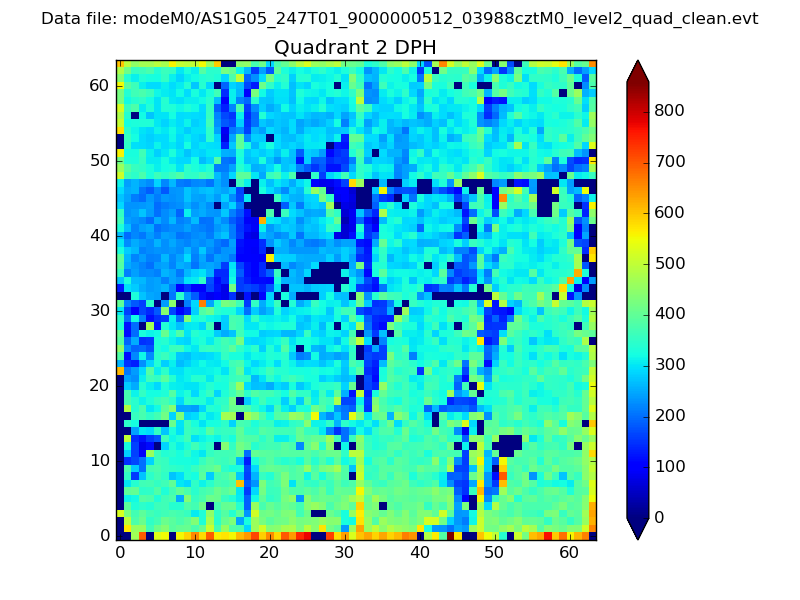
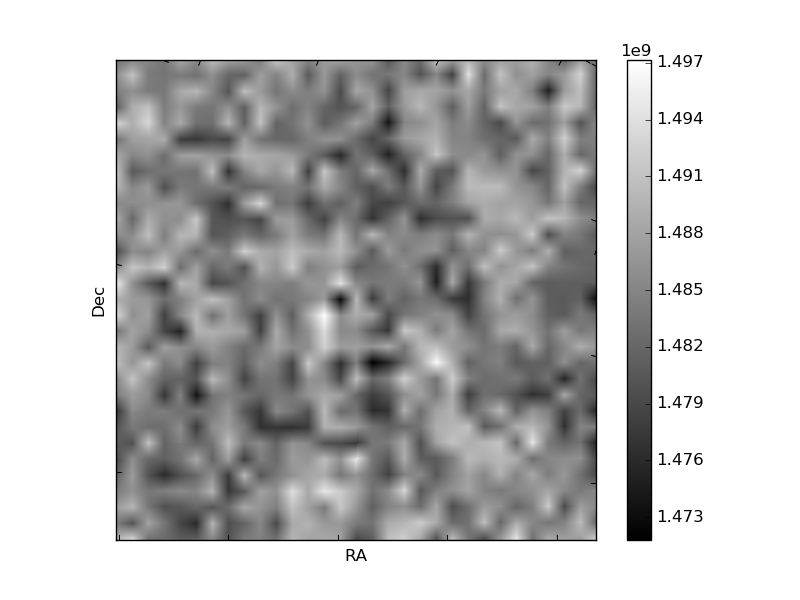
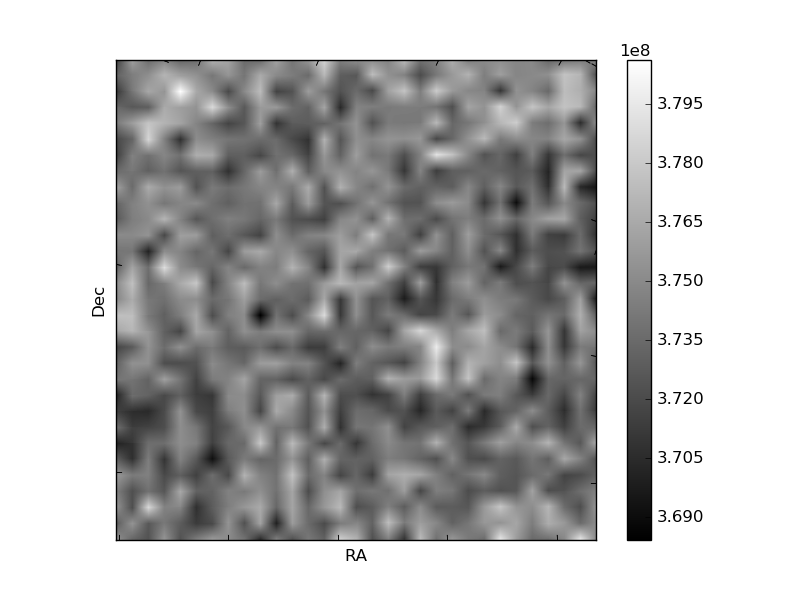
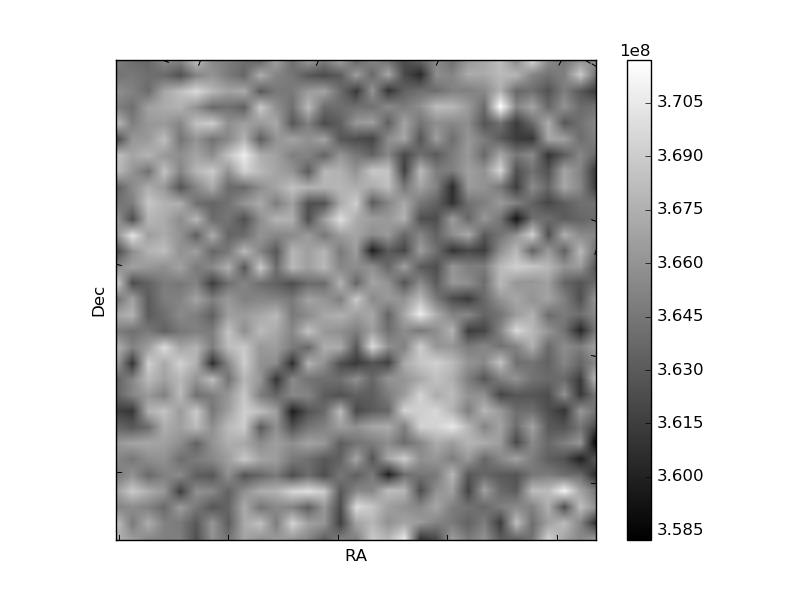
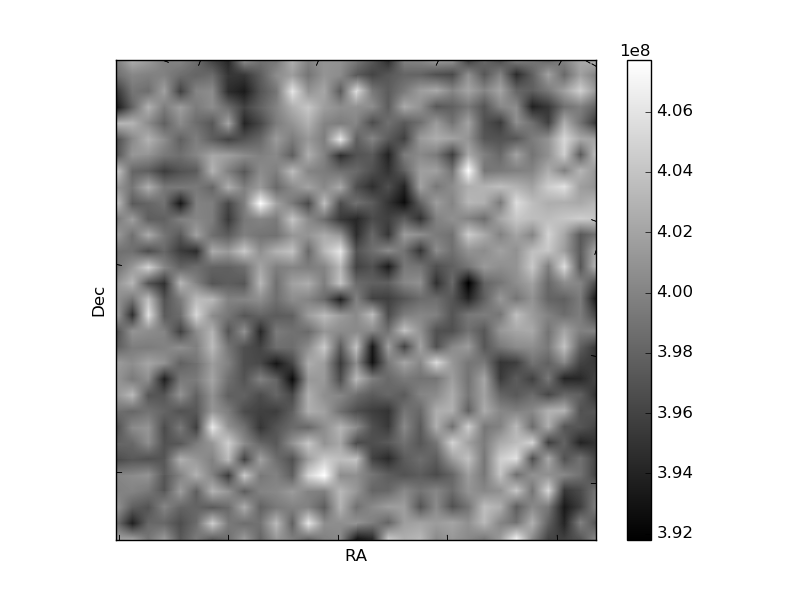
Histogram calculated using DETX and DETY for each event in the final _common_clean file
| Quadrant A | 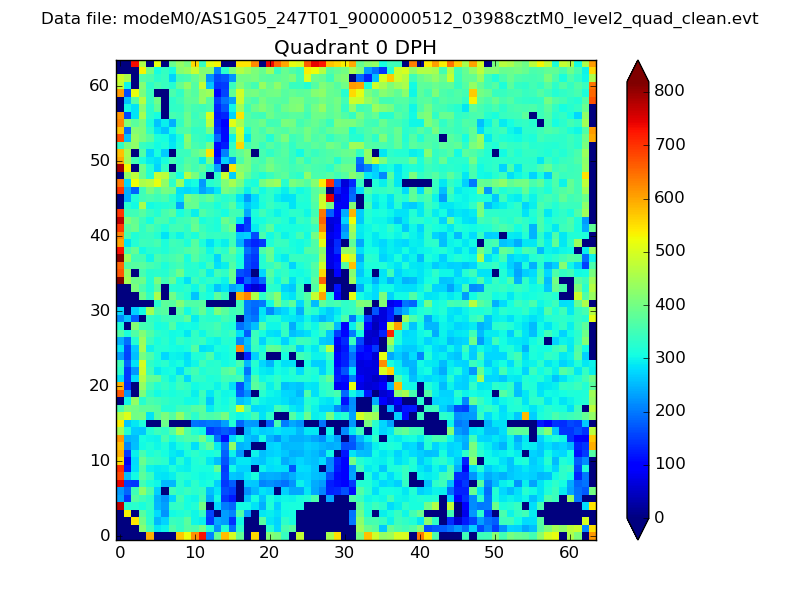 |
 |
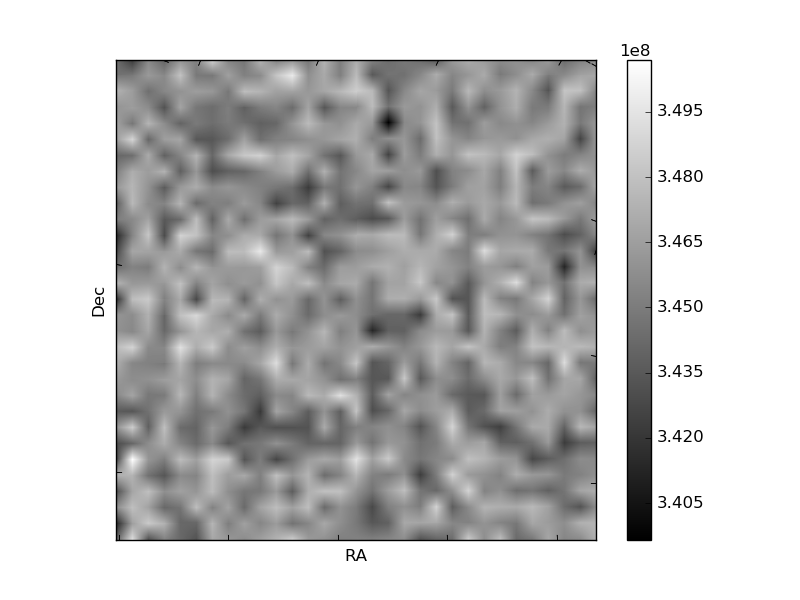
Quadrant B |
|---|---|---|---|
| Quadrant D | 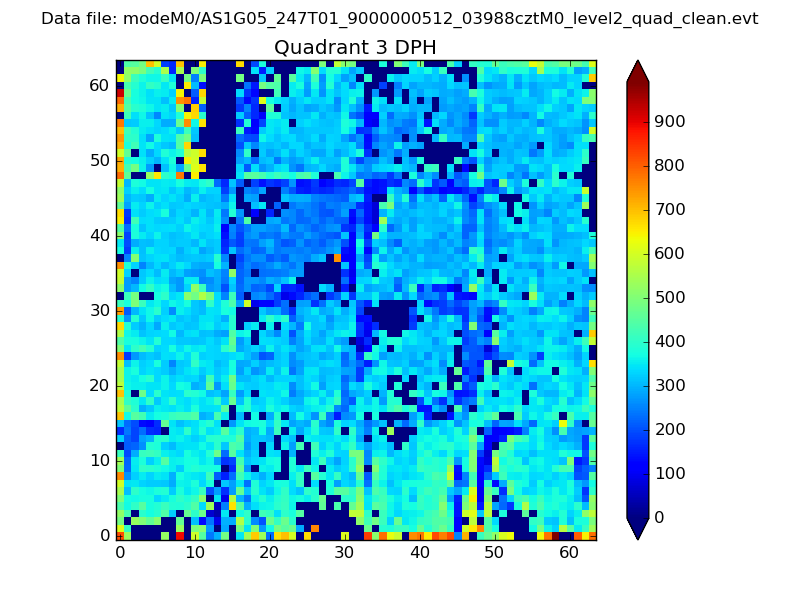 |
 |
Quadrant C |
| Plot type | Count rate plots | Images |
|---|---|---|
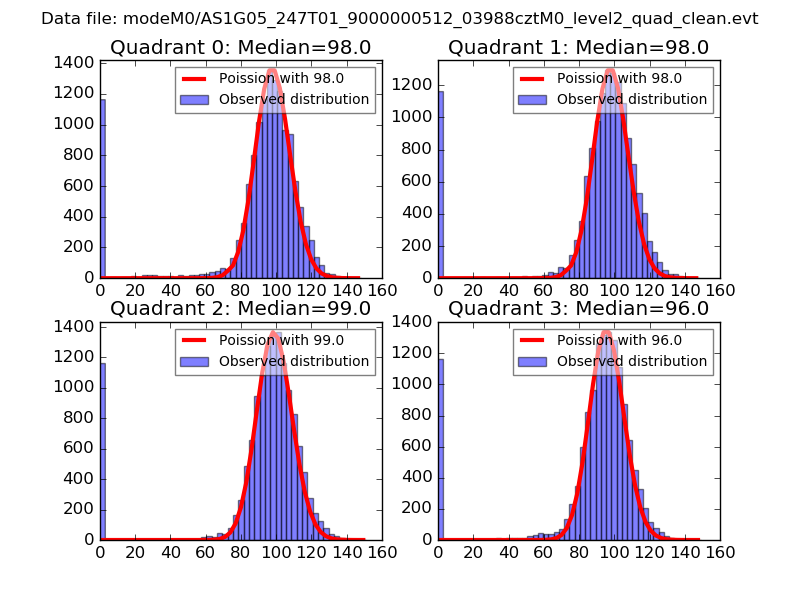
| Comparison with Poisson distribution Blue bars denote a histogram of data divided into 1 sec bins. Red curve is a Poisson curve with rate = median count rate of data. |
 |
 |
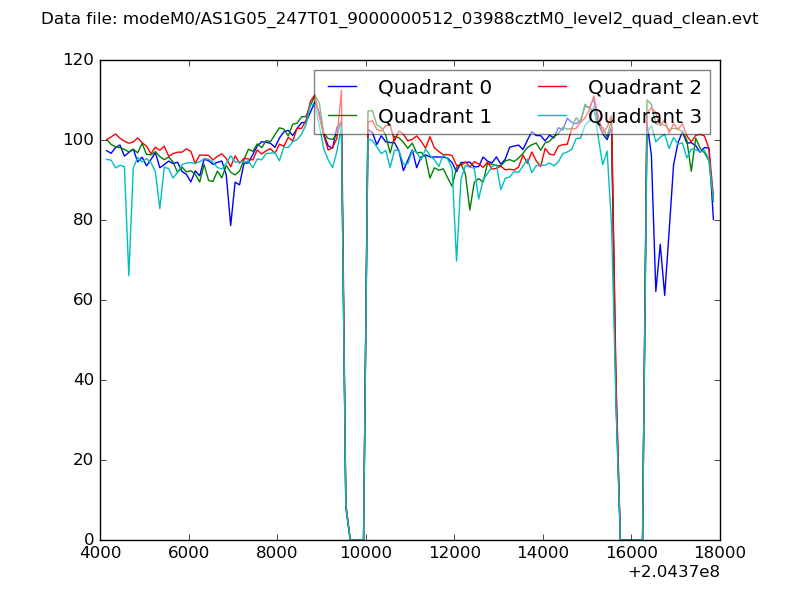
| Quadrant-wise count rates Data is divided into 100 sec bins |
 |
|
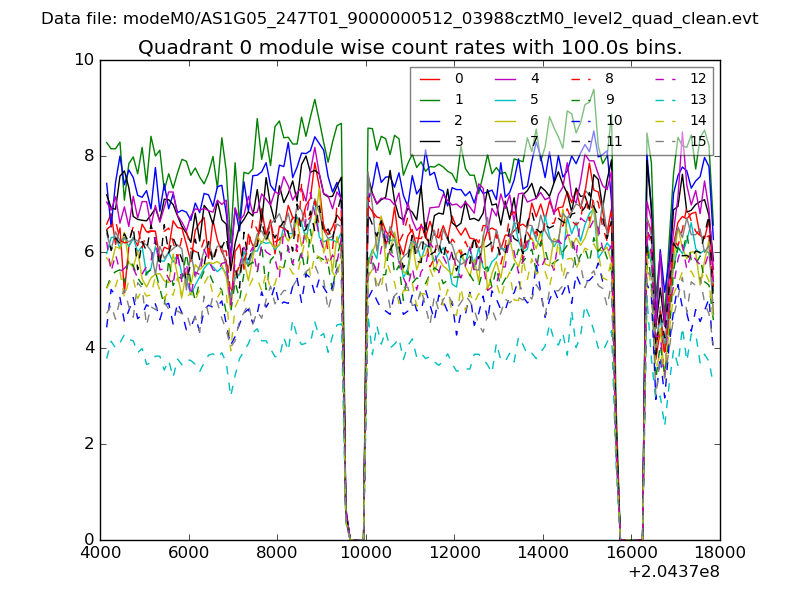
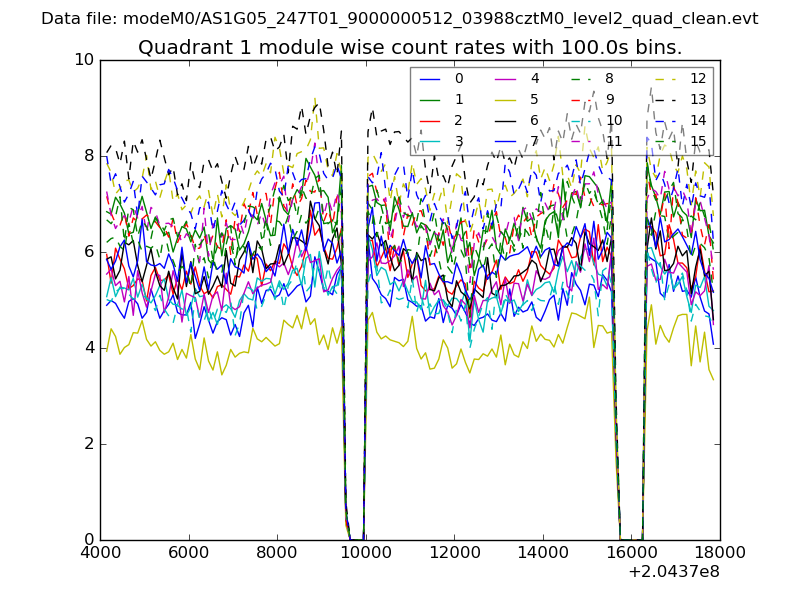
| Module-wise count rates for Quadrant A Data is divided into 100 sec bins |
 |
 |
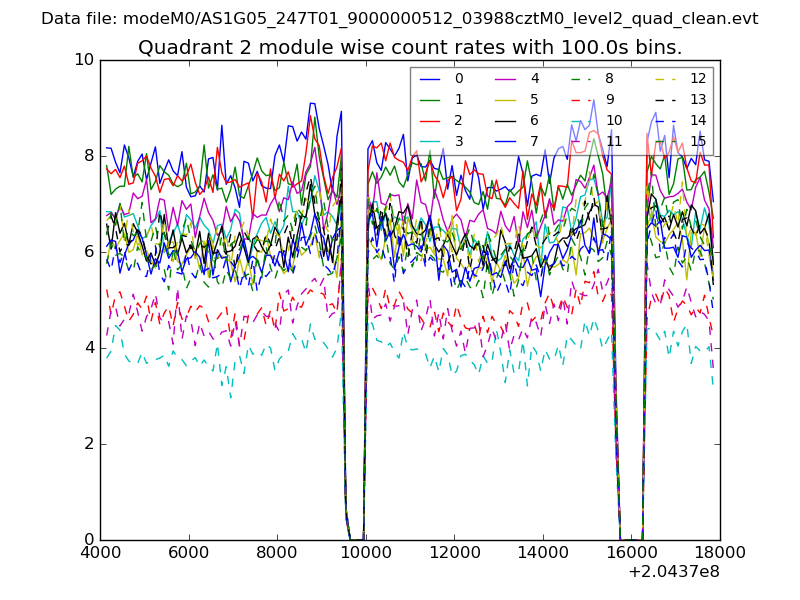
| Module-wise count rates for Quadrant B Data is divided into 100 sec bins |
 |
 |
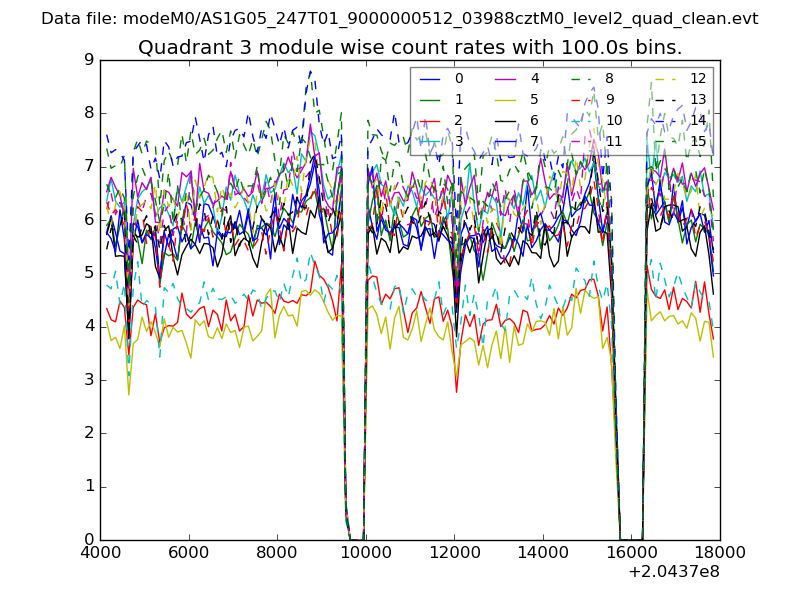
| Module-wise count rates for Quadrant C Data is divided into 100 sec bins |
 |
 |
| Module-wise count rates for Quadrant D Data is divided into 100 sec bins |
 |
 |
| Parameter | Plot |
|---|---|
| CZT HV Monitor | 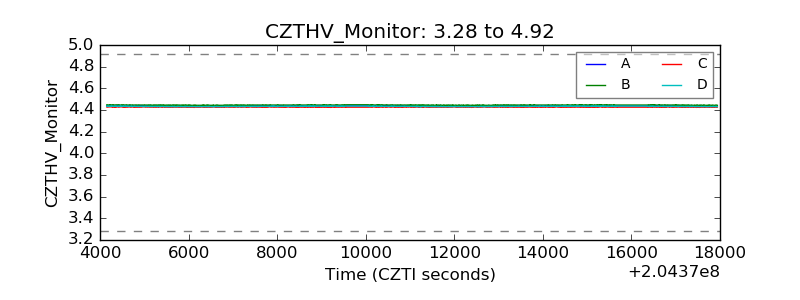 |
| D_VDD | 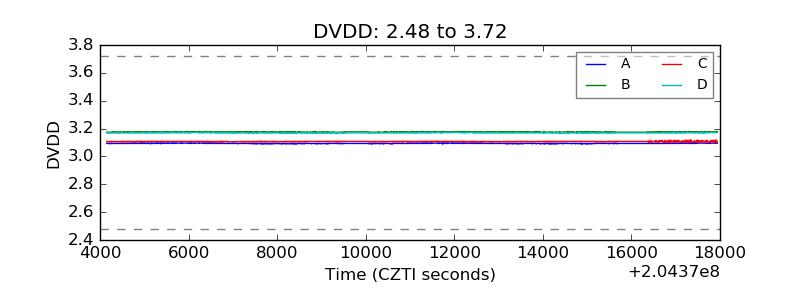 |
| Temperature 1 | 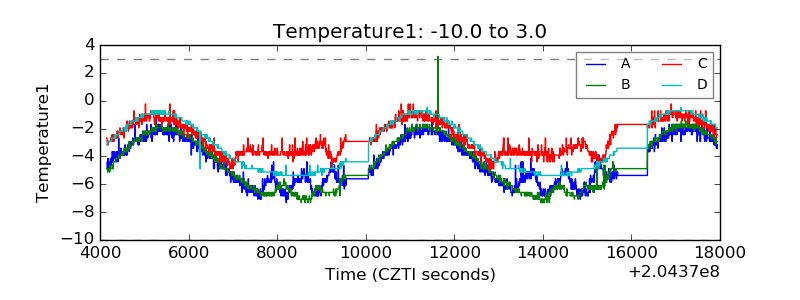 |
| Veto HV Monitor | 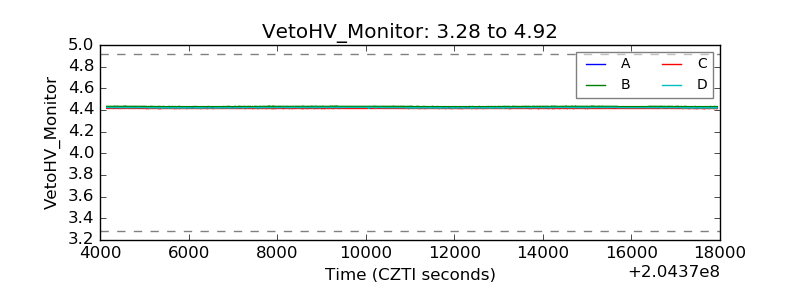 |
| Veto LLD |  |
| Alpha Counter | 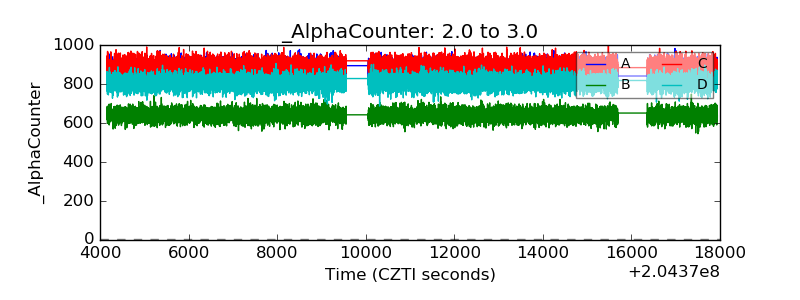 |
| _CPM_Rate | 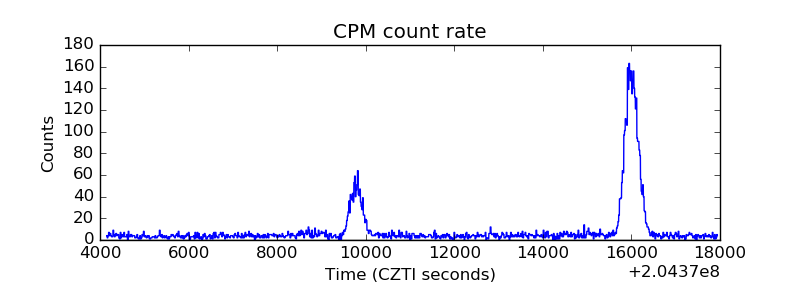 |
| CZT Counter | 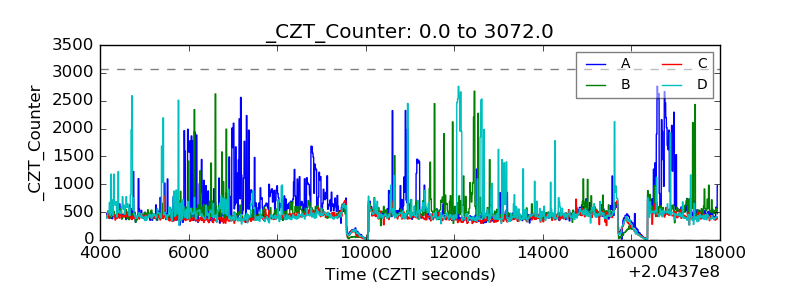 |
| +2.5 Volts monitor |  |
| +5 Volts monitor |  |
| _ROLL_ROT | 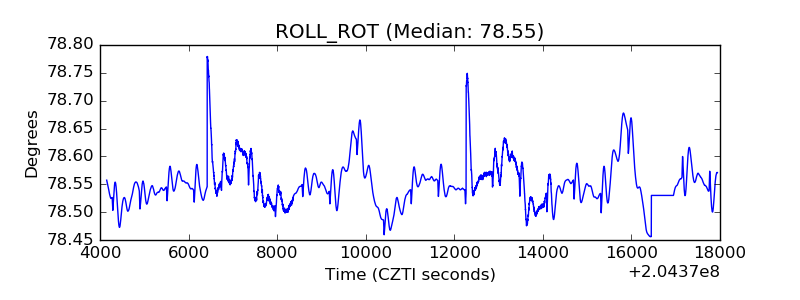 |
| _Roll_DEC | 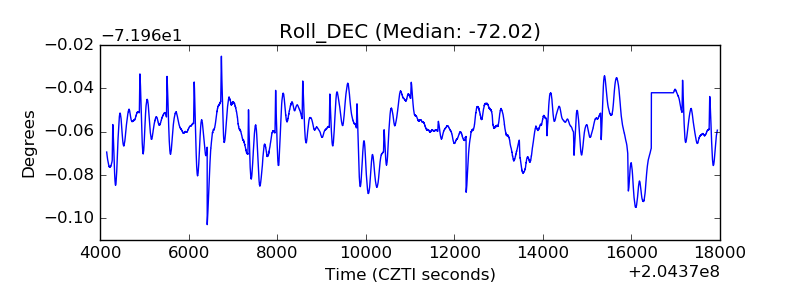 |
| _Roll_RA | 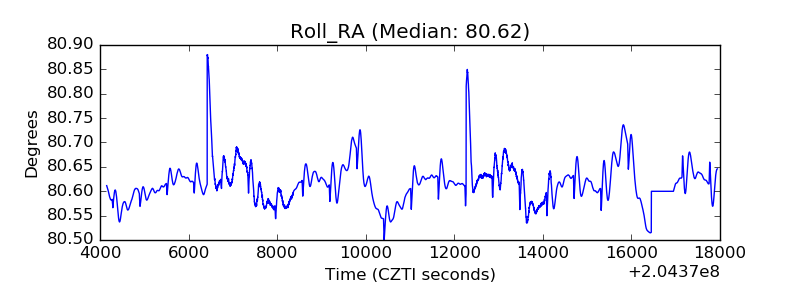 |
| Veto Counter | 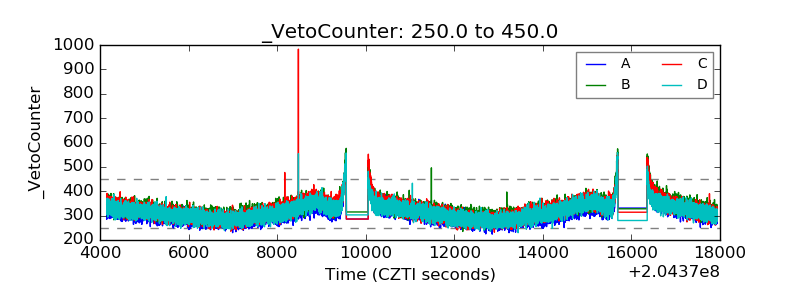 |