| Param | Original file | Final file |
|---|---|---|
| Filename | modeM0/AS1G05_247T01_9000000512_03990cztM0_level2.evt | modeM0/AS1G05_247T01_9000000512_03990cztM0_level2_quad_clean.evt |
| Size (bytes) | 446,146,560 | 96,033,600 |
| Size | 425.5 MB | 91.6 MB |
| Events in quadrant A | 4,367,305 | 607,404 |
| Events in quadrant B | 2,835,767 | 632,436 |
| Events in quadrant C | 2,679,405 | 629,147 |
| Events in quadrant D | 3,208,517 | 607,596 |
| Mode SS | |||
|---|---|---|---|
| Quadrant | BADHDUFLAG | Total packets | Discarded packets |
| A | 0 | 126 | 0 |
| B | 0 | 126 | 0 |
| C | 0 | 126 | 0 |
| D | 0 | 126 | 0 |
| Mode M9 | |||
|---|---|---|---|
| Quadrant | BADHDUFLAG | Total packets | Discarded packets |
| A | 0 | 10 | 0 |
| B | 0 | 10 | 0 |
| C | 0 | 10 | 0 |
| D | 0 | 10 | 0 |
| Mode M0 | |||
|---|---|---|---|
| Quadrant | BADHDUFLAG | Total packets | Discarded packets |
| A | 0 | 17513 | 2 |
| B | 0 | 12783 | 1 |
| C | 0 | 12662 | 1 |
| D | 0 | 13669 | 1 |
| Quadrant | Total seconds | Saturated seconds | Saturation percentage |
|---|---|---|---|
| A | 6181 | 595 | 9.626274% |
| B | 6181 | 40 | 0.647144% |
| C | 6181 | 36 | 0.582430% |
| D | 6181 | 115 | 1.860540% |
Noise dominated data is calculated using 1-second bins in cleaned event files. If a bin has >2000 counts, and if more than 50% of those come from <1% of pixels, then it is considered to be noise-dominated and hence unusable.
| Quadrant | # 1 sec bins | Bins with >0 counts | Bins with >2000 counts | High rate bins dominated by noise | Noise dominated (total time) | Noise dominated (detector-on time) | Marked lightcurve |
|---|---|---|---|---|---|---|---|
| A | 7186 | 6182 | 357 | 357 | 4.97% | 5.77% | 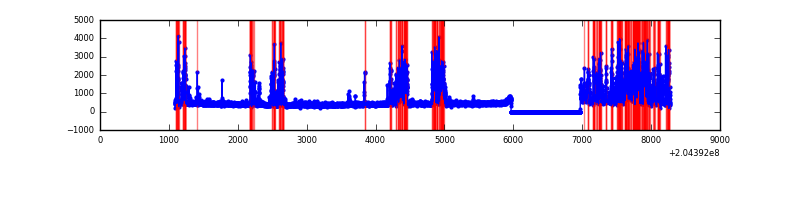 |
| B | 7186 | 6182 | 0 | 0 | 0.00% | 0.00% | 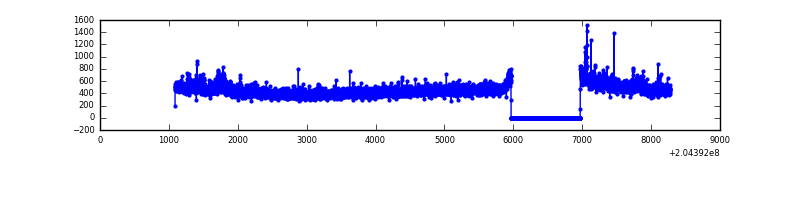 |
| C | 7186 | 6182 | 3 | 3 | 0.04% | 0.05% | 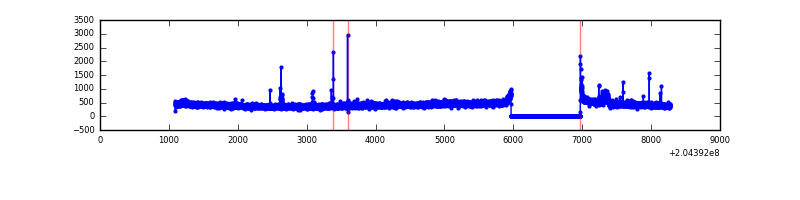 |
| D | 7186 | 6182 | 62 | 62 | 0.86% | 1.00% | 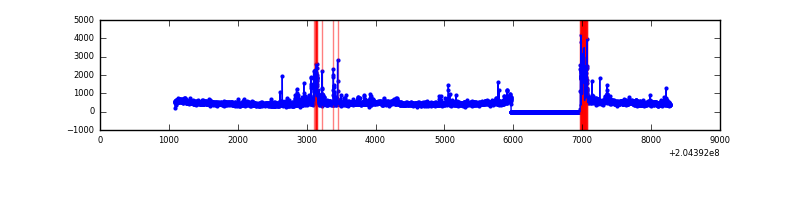 |
Top three noisy pixels from each quadrant. If the there are fewer than three noisy pixels in the level2.evt file, extra rows are filled as -1
| Pixel properties | Quadrant properties | ||||||
|---|---|---|---|---|---|---|---|
| Quadrant | DetID | PixID | Counts | Sigma | Mean | Median | Sigma |
| A | 0 | 50 | 1750240 | 12992.08 | 663 | 646 | 134.7 |
| A | 0 | 118 | 25128 | 181.79 | 663 | 646 | 134.7 |
| A | 8 | 15 | 20740 | 149.21 | 663 | 646 | 134.7 |
| B | 15 | 204 | 80098 | 600.03 | 693 | 677 | 132.4 |
| B | 3 | 0 | 18098 | 131.62 | 693 | 677 | 132.4 |
| B | 10 | 16 | 11445 | 81.35 | 693 | 677 | 132.4 |
| C | 9 | 144 | 62869 | 406.63 | 659 | 661 | 153.0 |
| C | 1 | 16 | 25218 | 160.52 | 659 | 661 | 153.0 |
| C | 10 | 65 | 8219 | 49.4 | 659 | 661 | 153.0 |
| D | 9 | 82 | 352533 | 2232.42 | 655 | 634 | 157.6 |
| D | 2 | 232 | 169824 | 1073.33 | 655 | 634 | 157.6 |
| D | 1 | 7 | 151712 | 958.43 | 655 | 634 | 157.6 |
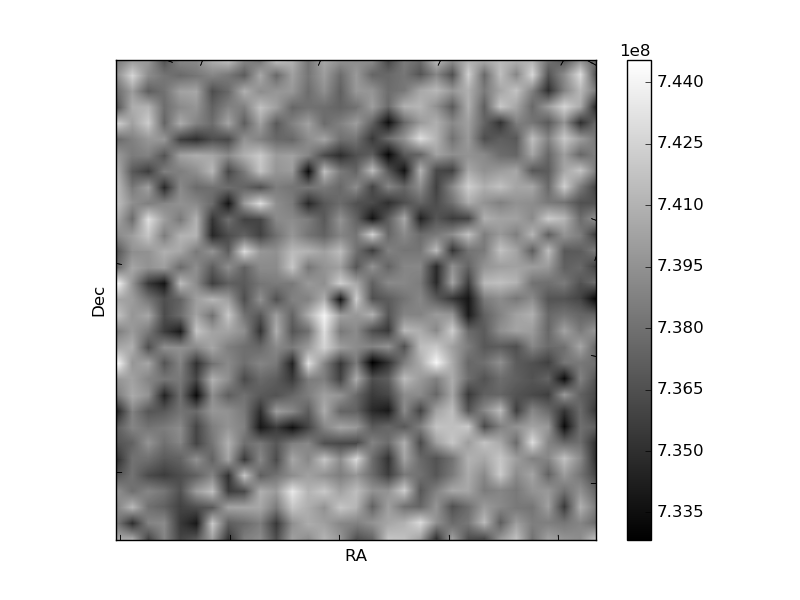
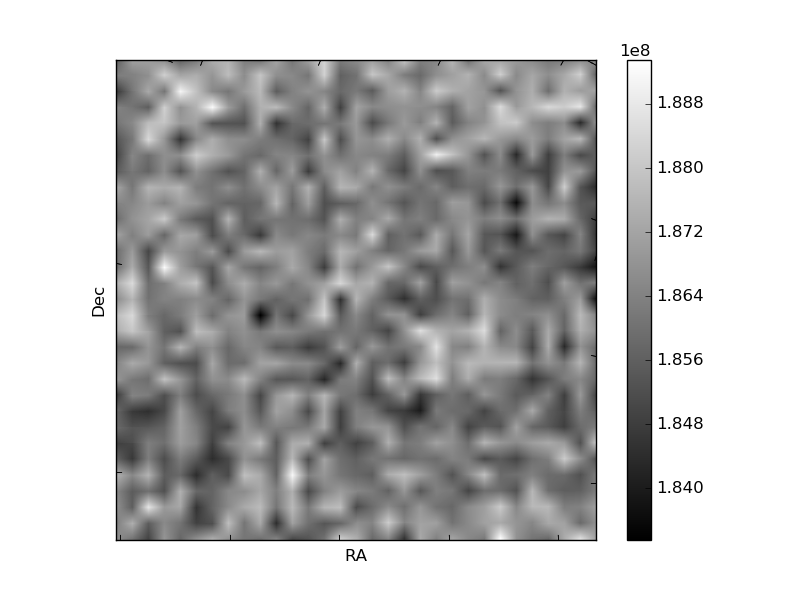
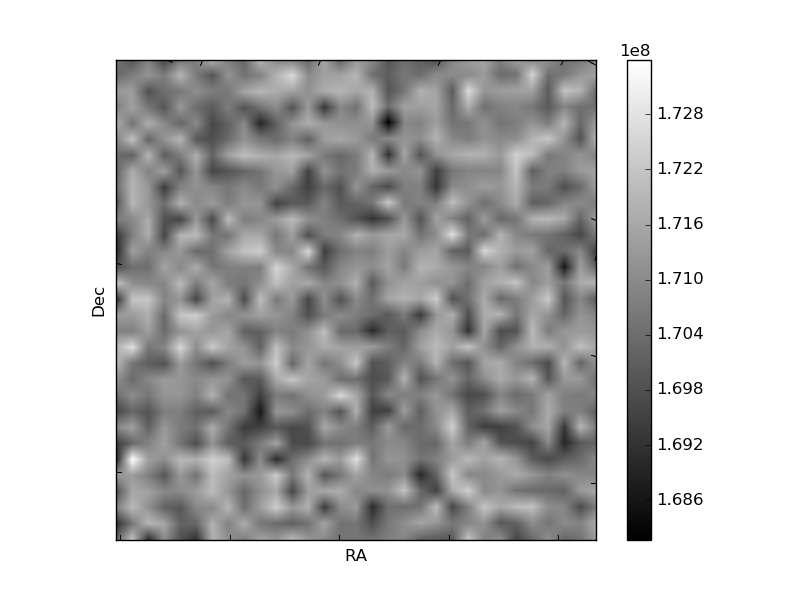
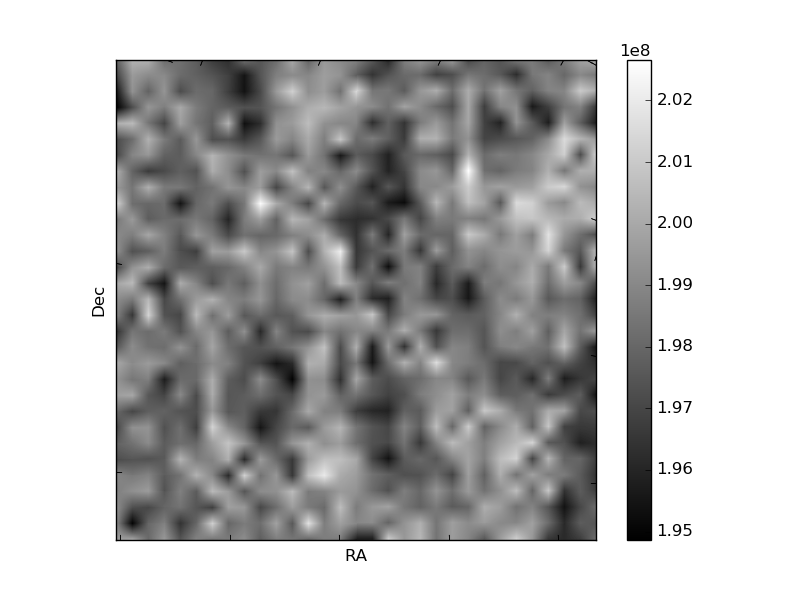
Histogram calculated using DETX and DETY for each event in the final _common_clean file
| Quadrant A | 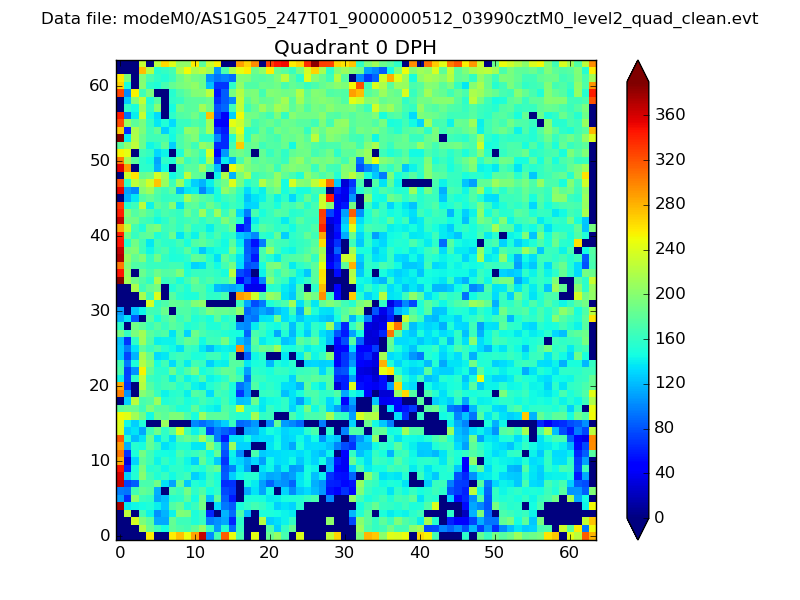 |
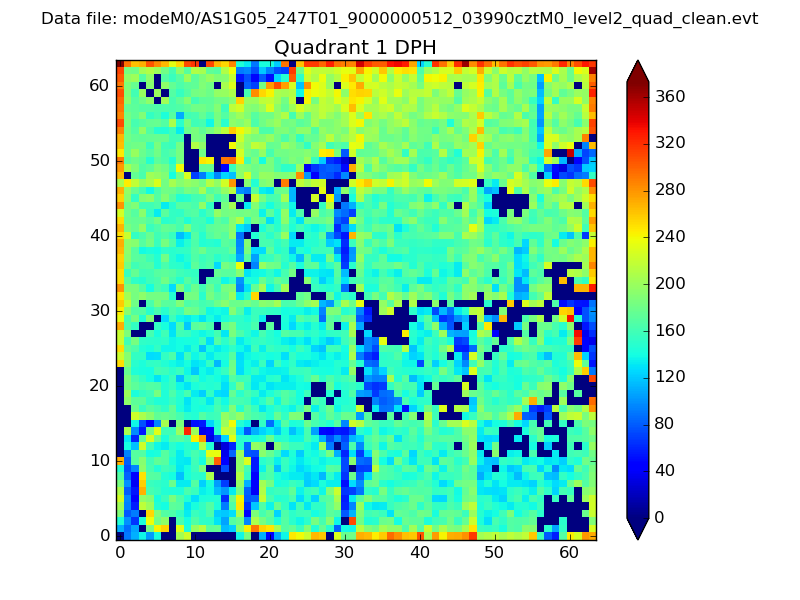 |
Quadrant B |
|---|---|---|---|
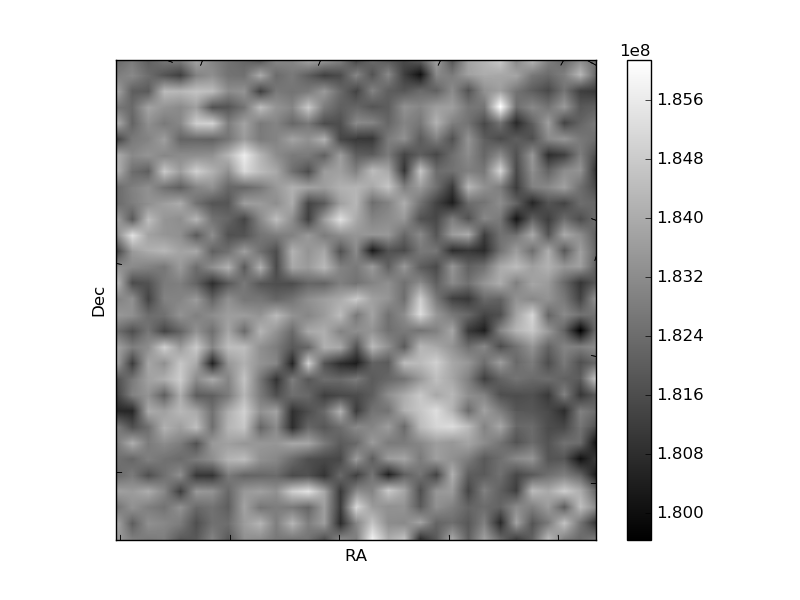
| Quadrant D | 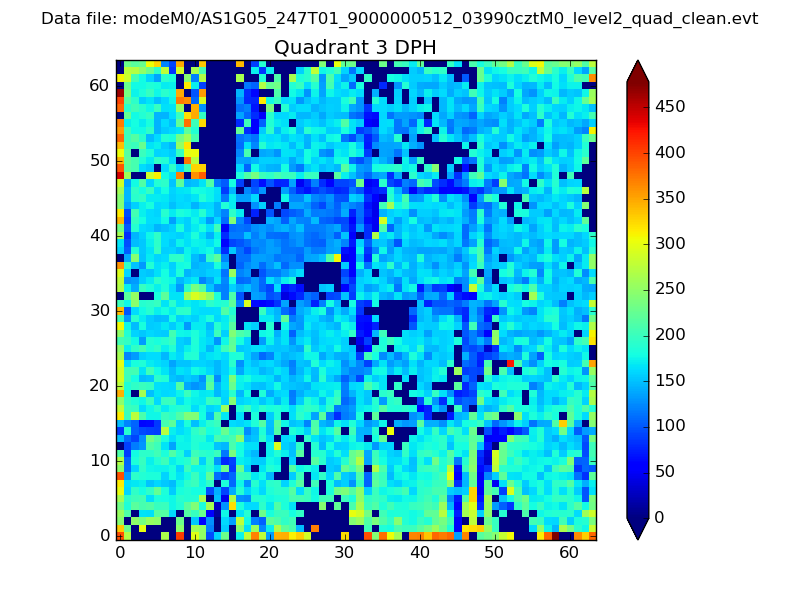 |
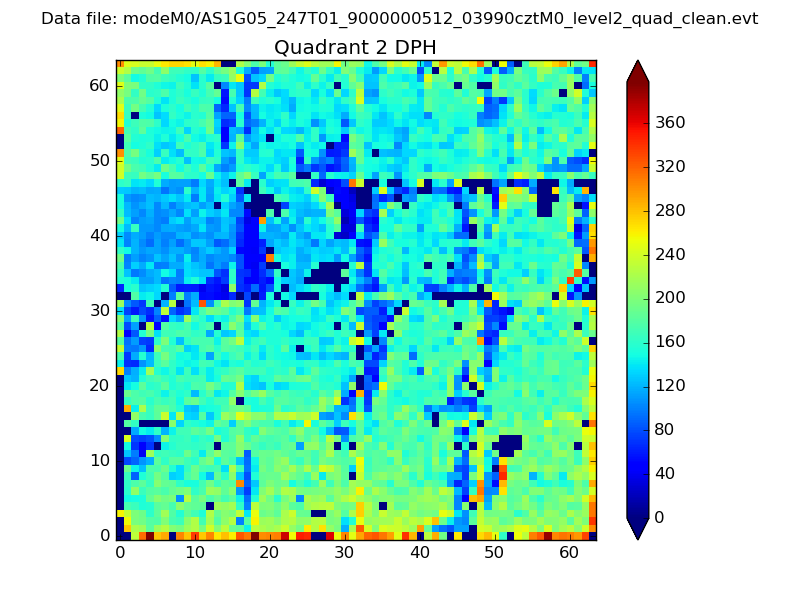 |
Quadrant C |
| Plot type | Count rate plots | Images |
|---|---|---|
| Comparison with Poisson distribution Blue bars denote a histogram of data divided into 1 sec bins. Red curve is a Poisson curve with rate = median count rate of data. |
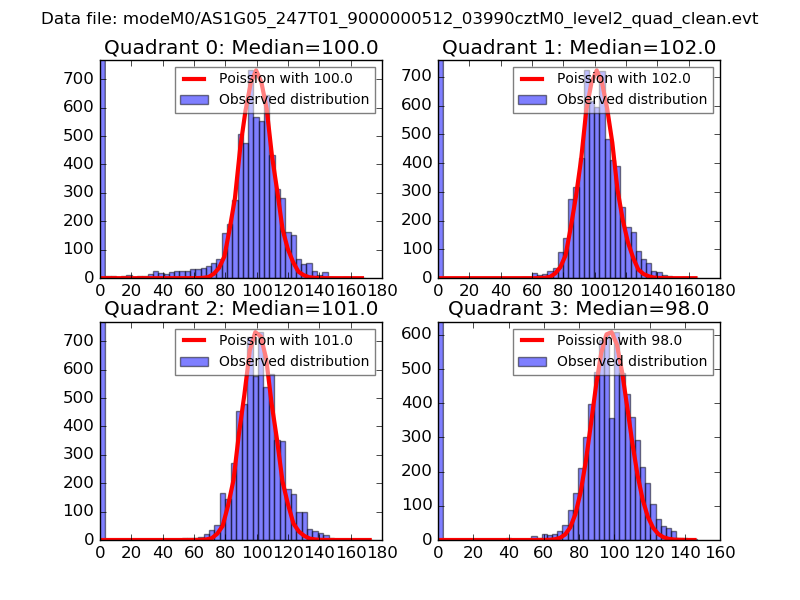 |
 |
| Quadrant-wise count rates Data is divided into 100 sec bins |
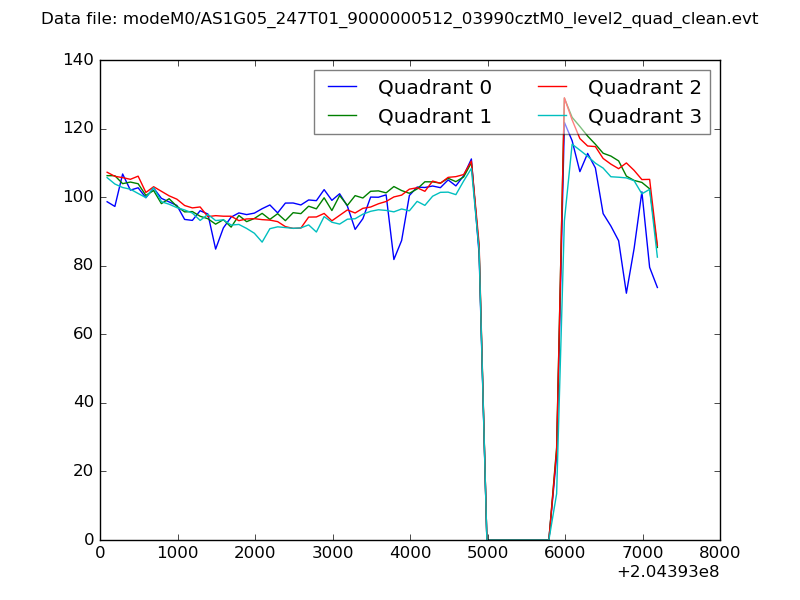 |
|
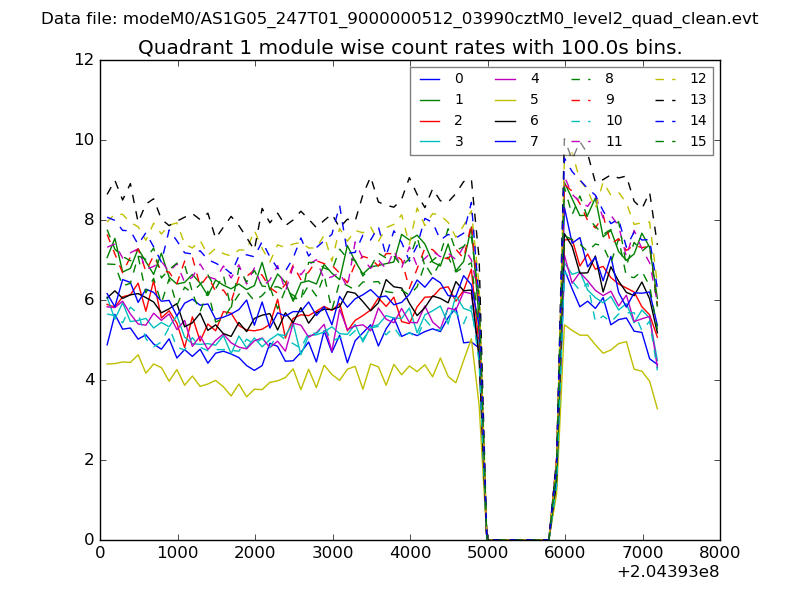
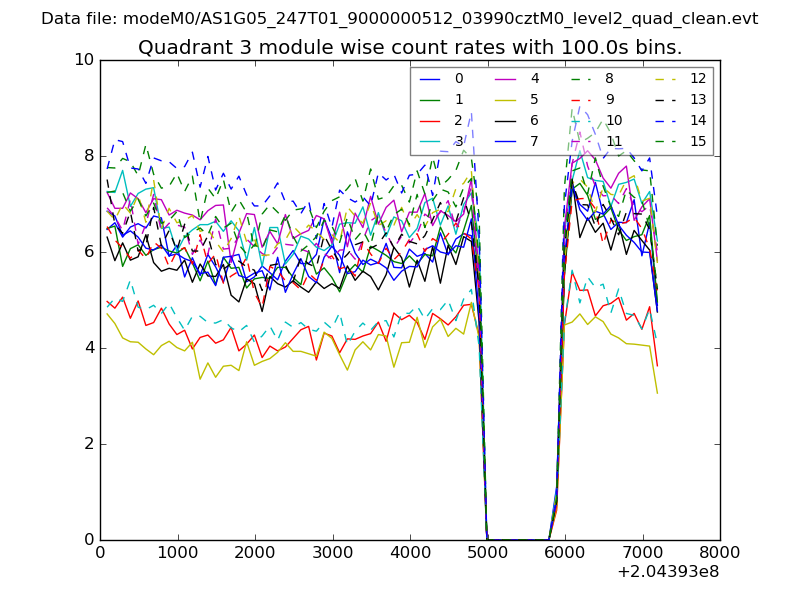
| Module-wise count rates for Quadrant A Data is divided into 100 sec bins |
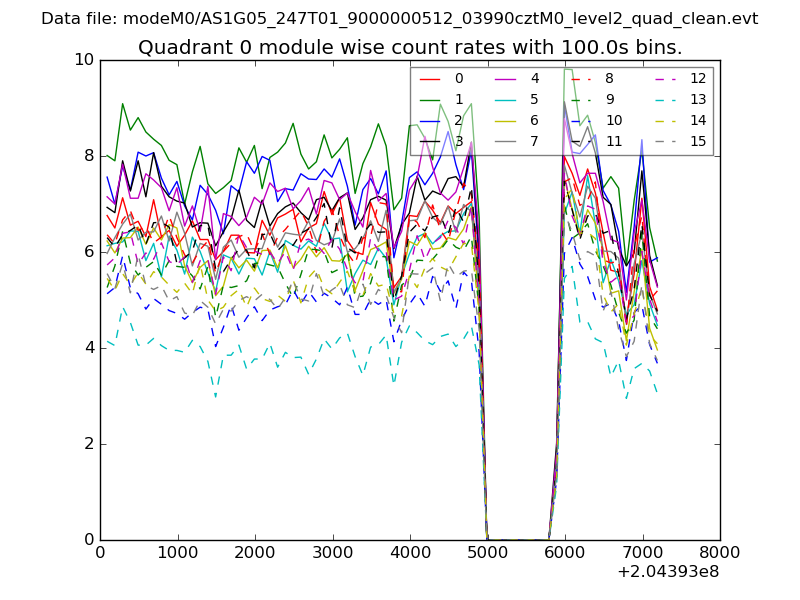 |
 |
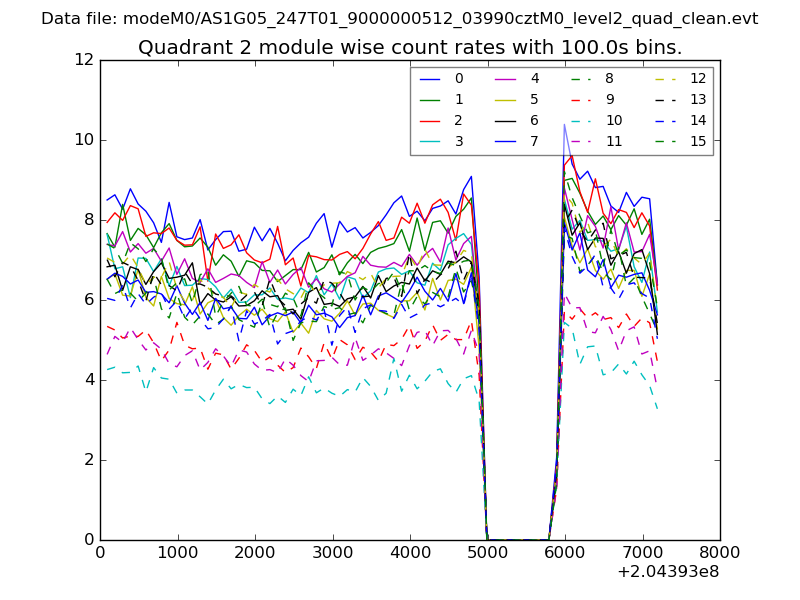
| Module-wise count rates for Quadrant B Data is divided into 100 sec bins |
 |
 |
| Module-wise count rates for Quadrant C Data is divided into 100 sec bins |
 |
 |
| Module-wise count rates for Quadrant D Data is divided into 100 sec bins |
 |
 |
| Parameter | Plot |
|---|---|
| CZT HV Monitor | 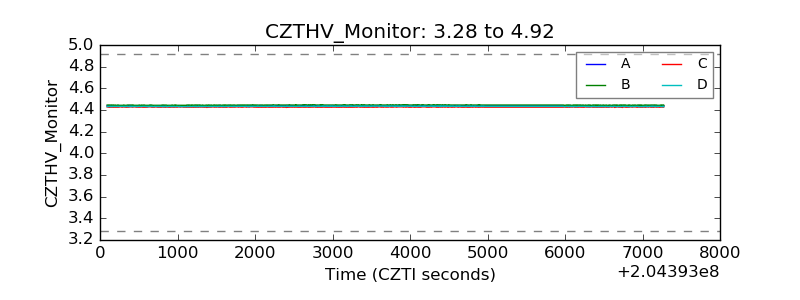 |
| D_VDD | 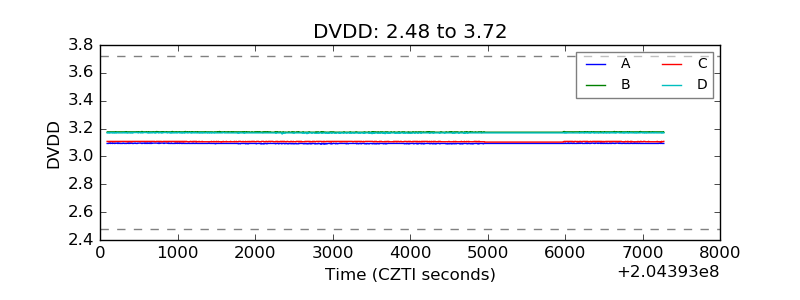 |
| Temperature 1 | 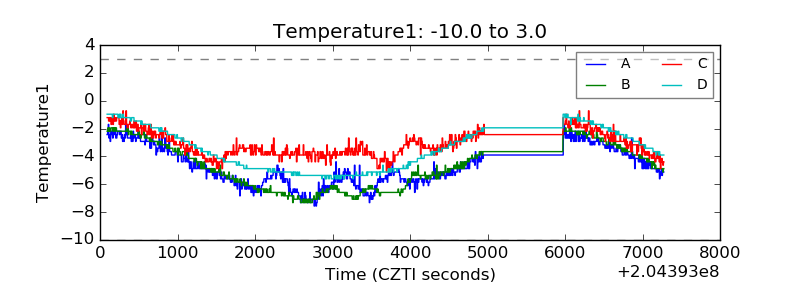 |
| Veto HV Monitor | 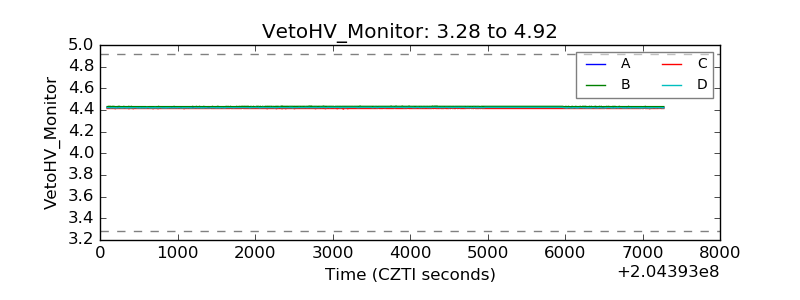 |
| Veto LLD | 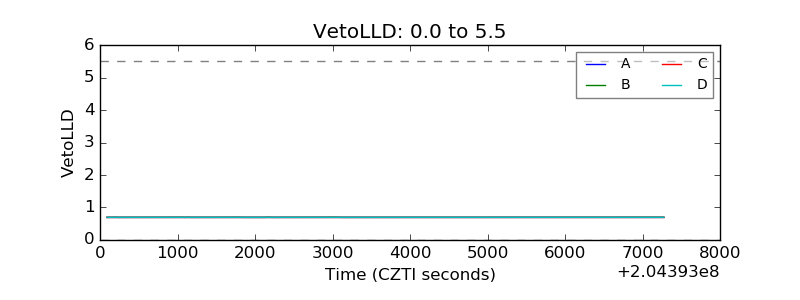 |
| Alpha Counter | 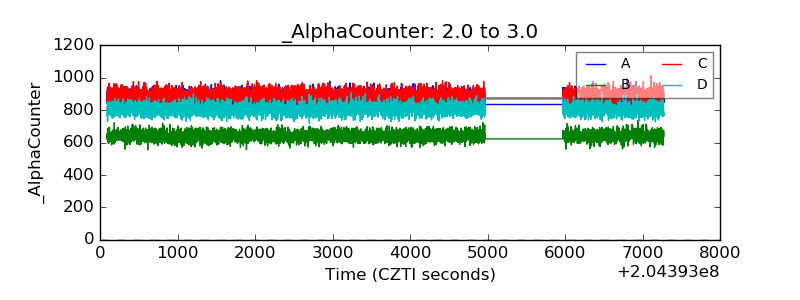 |
| _CPM_Rate | 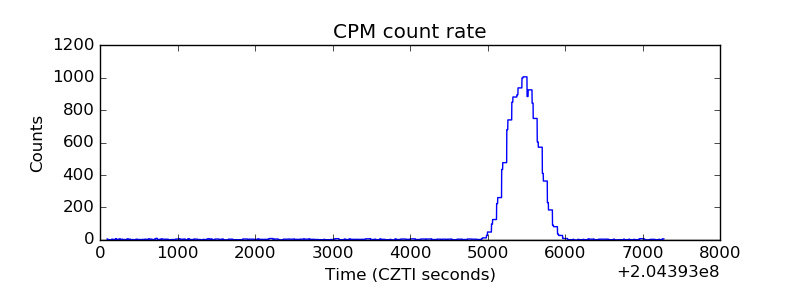 |
| CZT Counter | 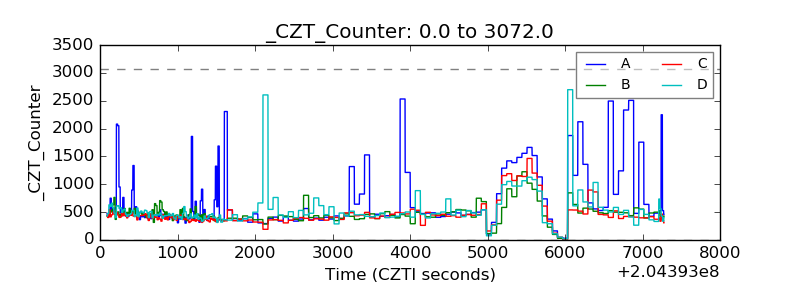 |
| +2.5 Volts monitor |  |
| +5 Volts monitor |  |
| _ROLL_ROT | 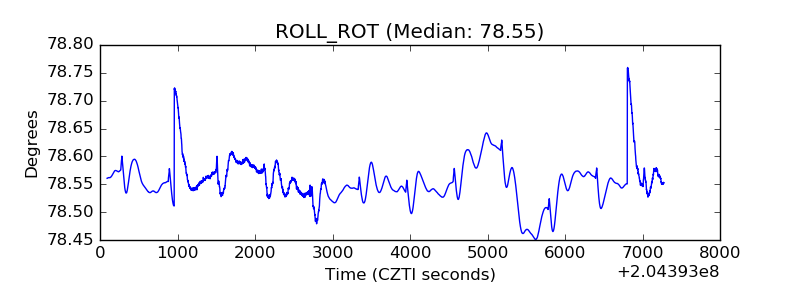 |
| _Roll_DEC | 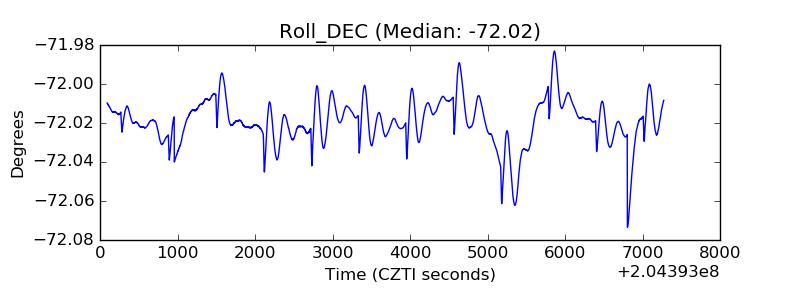 |
| _Roll_RA | 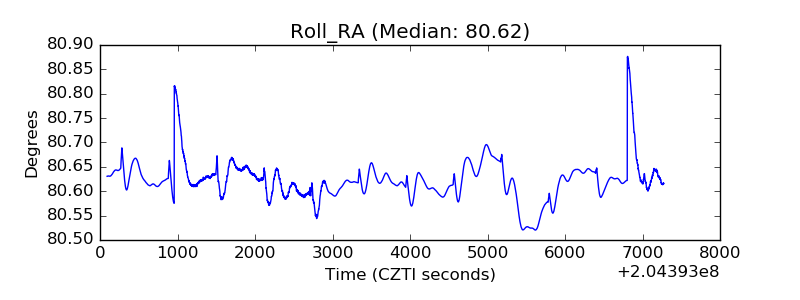 |
| Veto Counter | 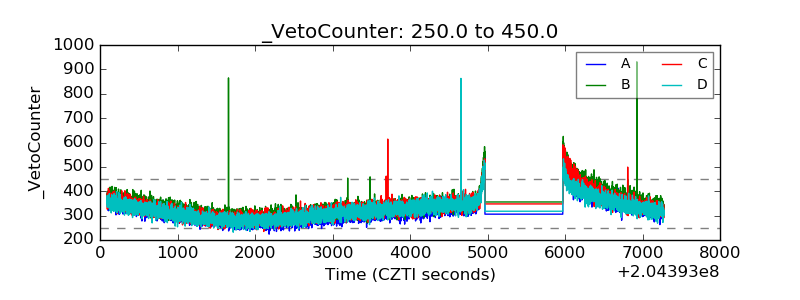 |