| Param | Original file | Final file |
|---|---|---|
| Filename | modeM0/AS1G05_247T01_9000000512_03994cztM0_level2.evt | modeM0/AS1G05_247T01_9000000512_03994cztM0_level2_quad_clean.evt |
| Size (bytes) | 465,756,480 | 106,467,840 |
| Size | 444.2 MB | 101.5 MB |
| Events in quadrant A | 3,351,002 | 709,361 |
| Events in quadrant B | 3,061,427 | 721,413 |
| Events in quadrant C | 2,771,199 | 702,074 |
| Events in quadrant D | 4,499,610 | 657,659 |
| Mode SS | |||
|---|---|---|---|
| Quadrant | BADHDUFLAG | Total packets | Discarded packets |
| A | 0 | 126 | 0 |
| B | 0 | 126 | 0 |
| C | 0 | 126 | 0 |
| D | 0 | 126 | 0 |
| Mode M9 | |||
|---|---|---|---|
| Quadrant | BADHDUFLAG | Total packets | Discarded packets |
| A | 0 | 21 | 0 |
| B | 0 | 21 | 0 |
| C | 0 | 21 | 0 |
| D | 0 | 22 | 0 |
| Mode M0 | |||
|---|---|---|---|
| Quadrant | BADHDUFLAG | Total packets | Discarded packets |
| A | 0 | 14207 | 3 |
| B | 0 | 13095 | 2 |
| C | 0 | 12601 | 2 |
| D | 0 | 17738 | 2 |
| Quadrant | Total seconds | Saturated seconds | Saturation percentage |
|---|---|---|---|
| A | 6215 | 135 | 2.172164% |
| B | 6215 | 16 | 0.257442% |
| C | 6215 | 9 | 0.144811% |
| D | 6215 | 390 | 6.275141% |
Noise dominated data is calculated using 1-second bins in cleaned event files. If a bin has >2000 counts, and if more than 50% of those come from <1% of pixels, then it is considered to be noise-dominated and hence unusable.
| Quadrant | # 1 sec bins | Bins with >0 counts | Bins with >2000 counts | High rate bins dominated by noise | Noise dominated (total time) | Noise dominated (detector-on time) | Marked lightcurve |
|---|---|---|---|---|---|---|---|
| A | 7560 | 6216 | 79 | 79 | 1.04% | 1.27% | 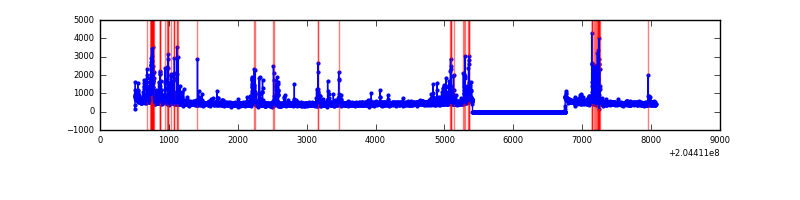 |
| B | 7560 | 6216 | 0 | 0 | 0.00% | 0.00% | 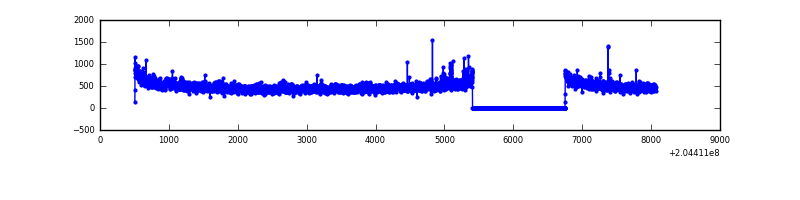 |
| C | 7560 | 6216 | 2 | 2 | 0.03% | 0.03% | 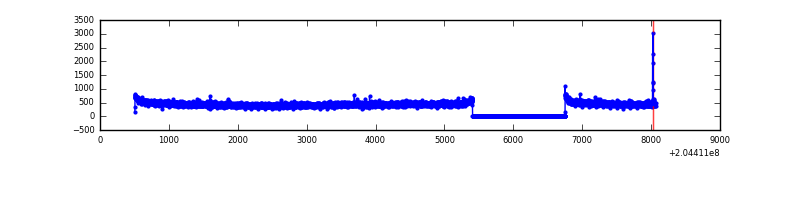 |
| D | 7560 | 6216 | 348 | 348 | 4.60% | 5.60% | 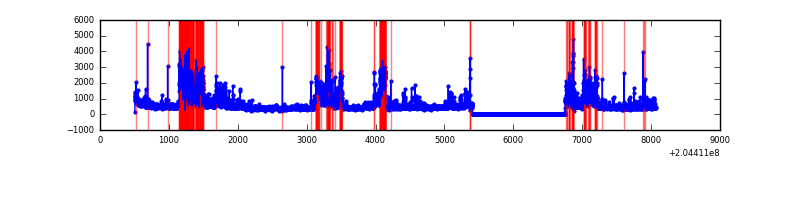 |
Top three noisy pixels from each quadrant. If the there are fewer than three noisy pixels in the level2.evt file, extra rows are filled as -1
| Pixel properties | Quadrant properties | ||||||
|---|---|---|---|---|---|---|---|
| Quadrant | DetID | PixID | Counts | Sigma | Mean | Median | Sigma |
| A | 0 | 50 | 468218 | 3224.63 | 721 | 708 | 145.0 |
| A | 0 | 118 | 63586 | 433.7 | 721 | 708 | 145.0 |
| A | 8 | 15 | 13545 | 88.54 | 721 | 708 | 145.0 |
| B | 3 | 0 | 126667 | 901.09 | 739 | 722 | 139.8 |
| B | 15 | 204 | 42099 | 296.04 | 739 | 722 | 139.8 |
| B | 4 | 81 | 18400 | 126.48 | 739 | 722 | 139.8 |
| C | 12 | 4 | 12373 | 72.27 | 705 | 709 | 161.4 |
| C | 13 | 61 | 5910 | 32.23 | 705 | 709 | 161.4 |
| C | 9 | 247 | 1835 | 6.98 | 705 | 709 | 161.4 |
| D | 2 | 63 | 977258 | 6030.39 | 682 | 662 | 161.9 |
| D | 10 | 246 | 712010 | 4392.51 | 682 | 662 | 161.9 |
| D | 8 | 112 | 86469 | 529.85 | 682 | 662 | 161.9 |
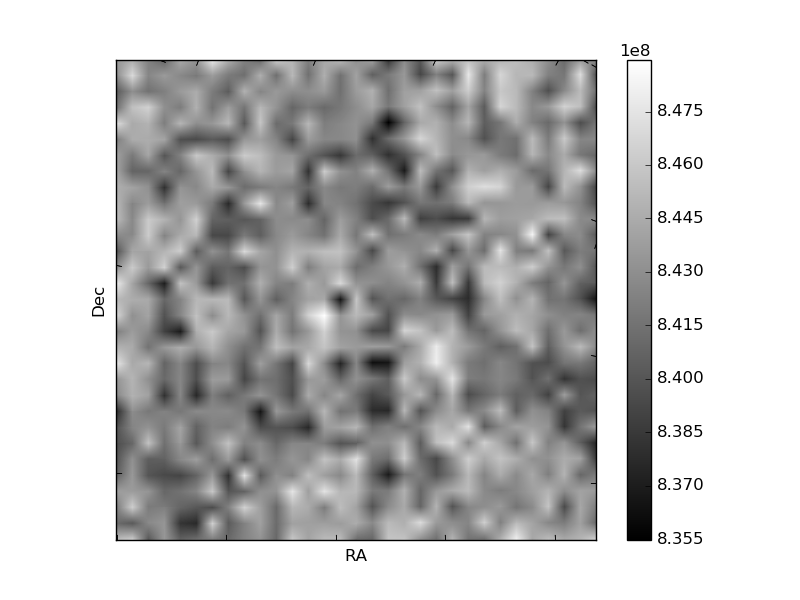
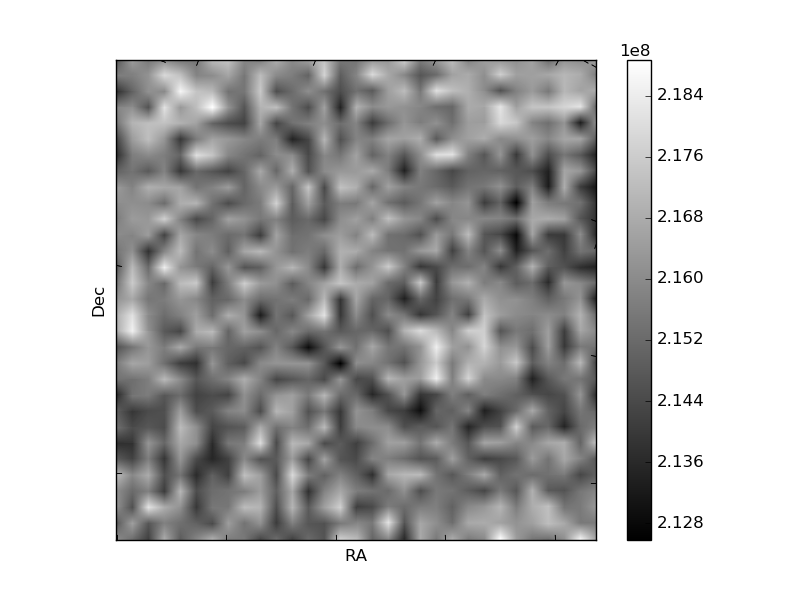
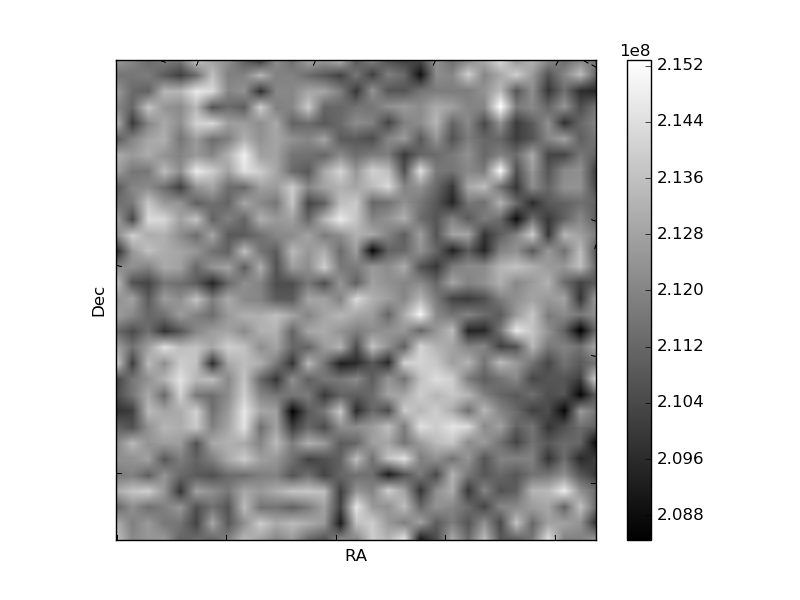
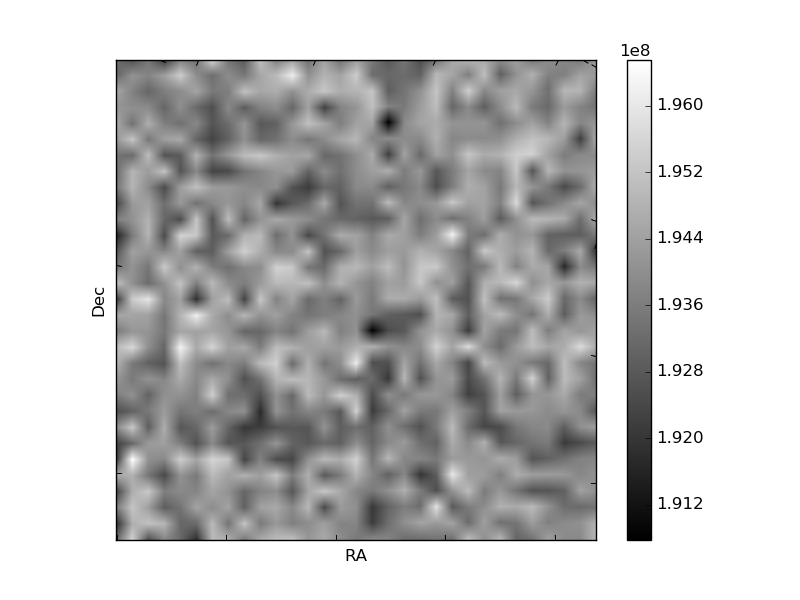
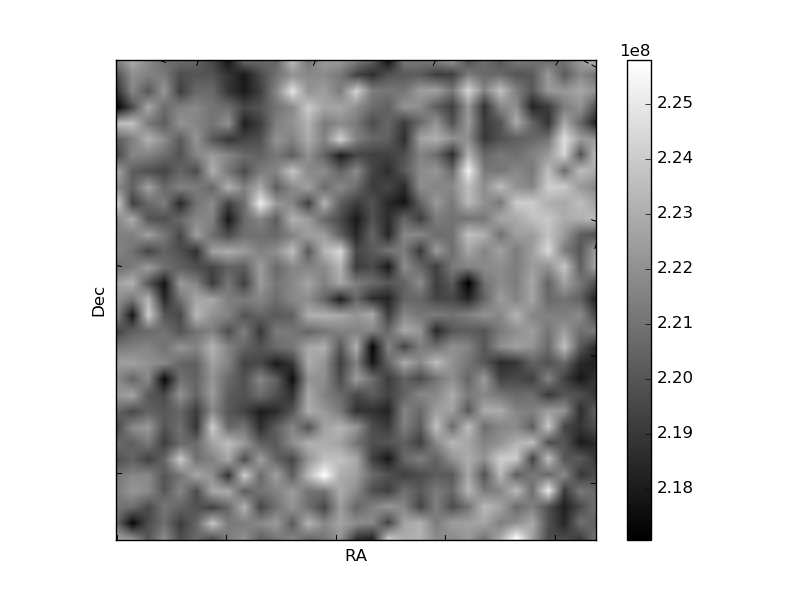
Histogram calculated using DETX and DETY for each event in the final _common_clean file
| Quadrant A | 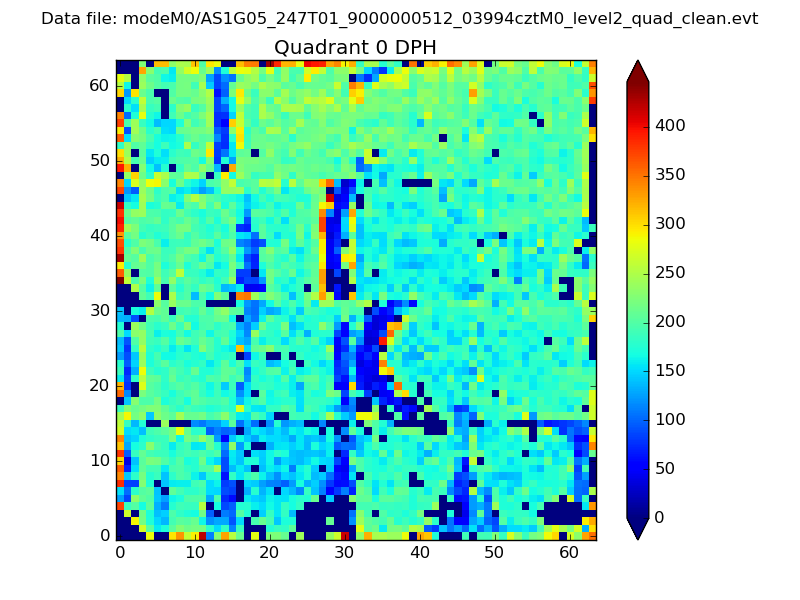 |
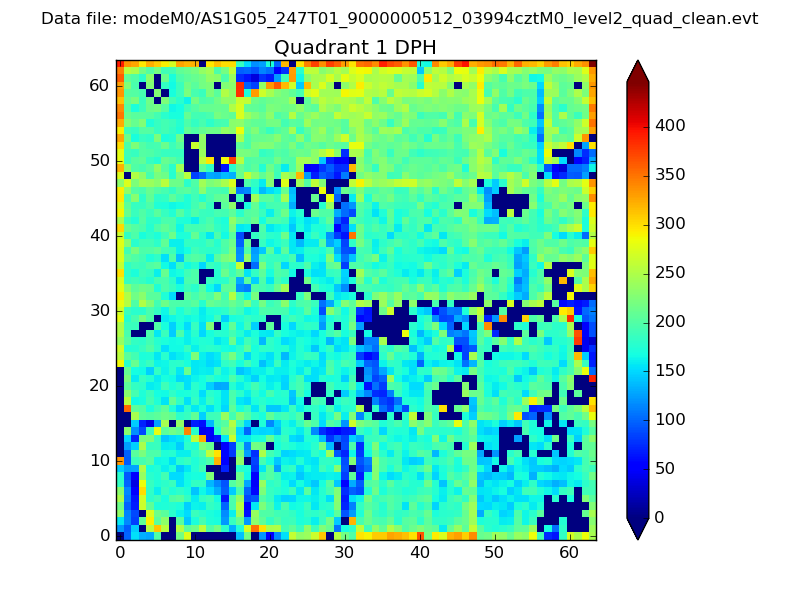 |
Quadrant B |
|---|---|---|---|
| Quadrant D | 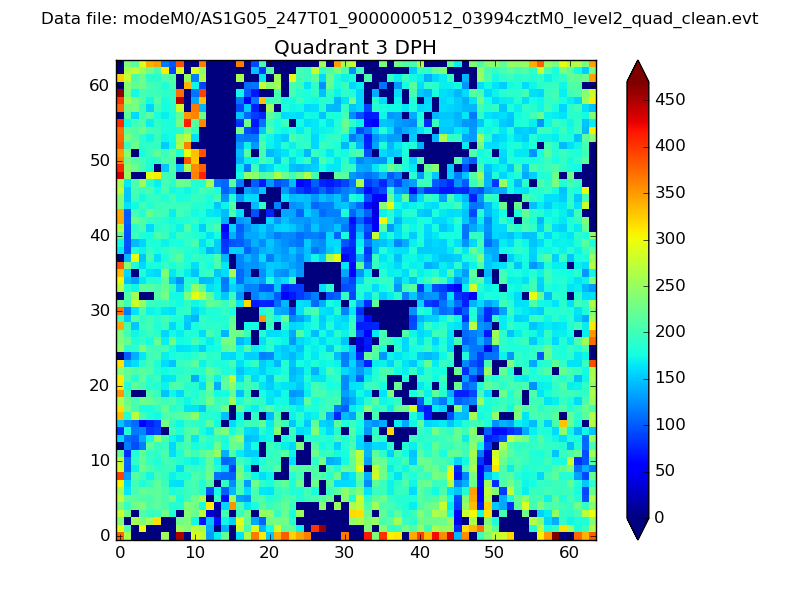 |
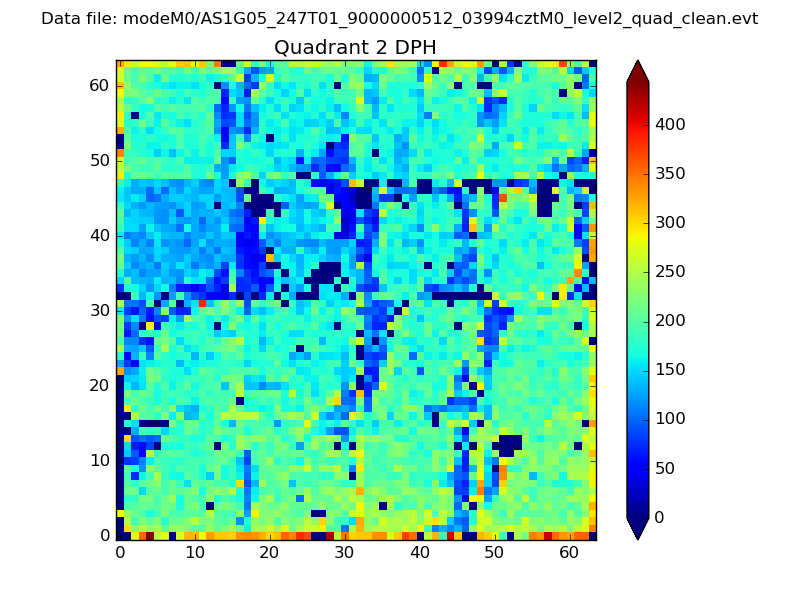 |
Quadrant C |
| Plot type | Count rate plots | Images |
|---|---|---|
| Comparison with Poisson distribution Blue bars denote a histogram of data divided into 1 sec bins. Red curve is a Poisson curve with rate = median count rate of data. |
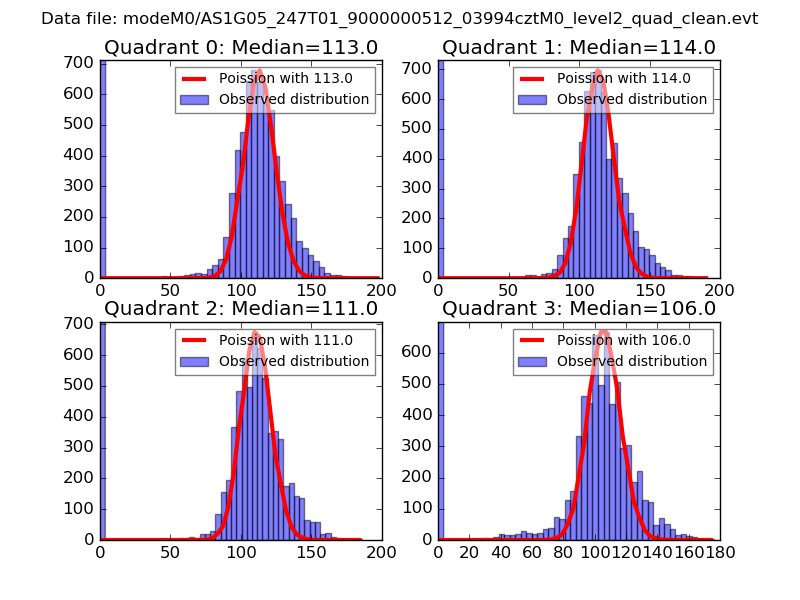 |
 |
| Quadrant-wise count rates Data is divided into 100 sec bins |
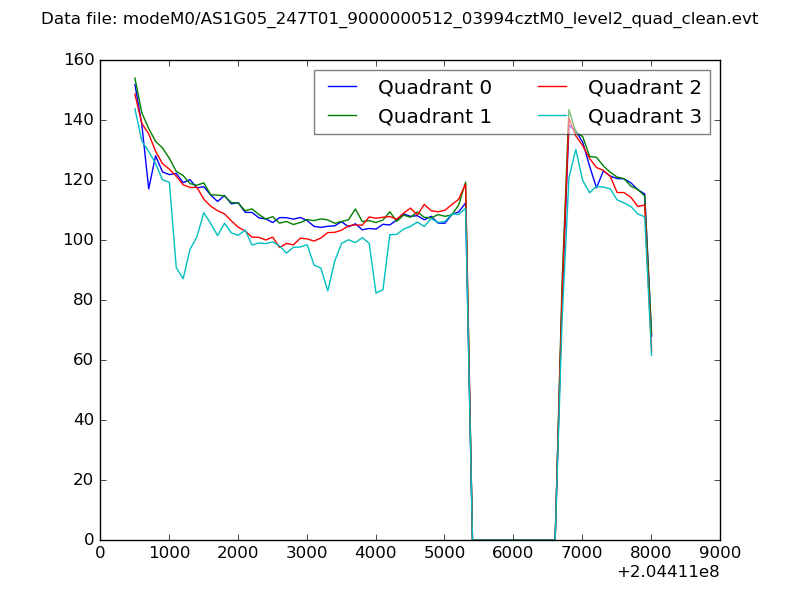 |
|
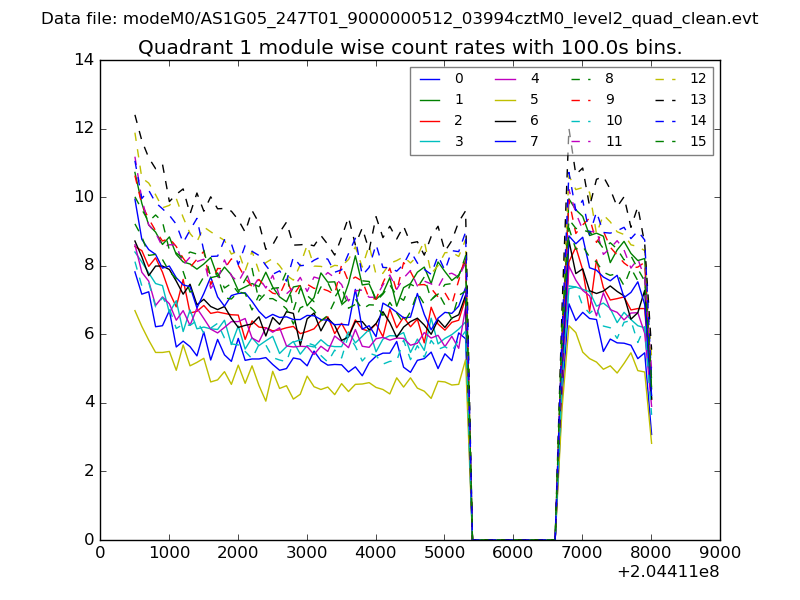
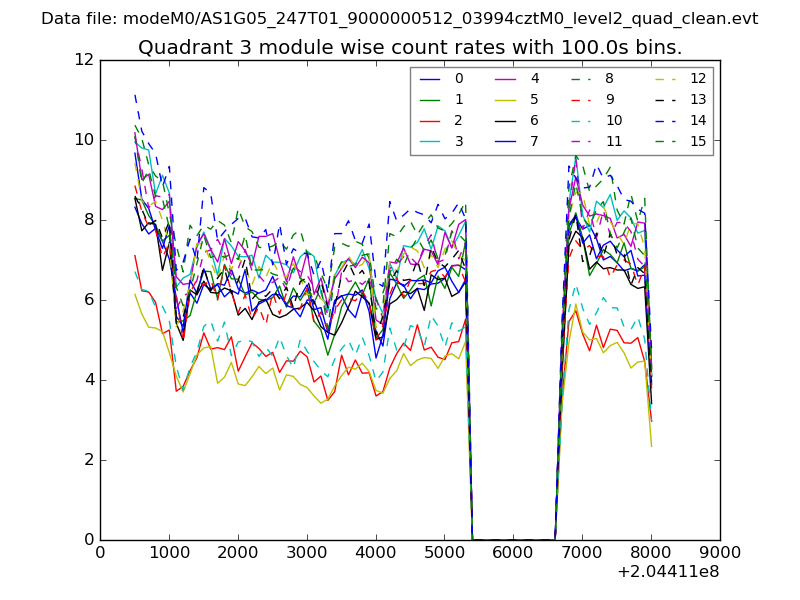
| Module-wise count rates for Quadrant A Data is divided into 100 sec bins |
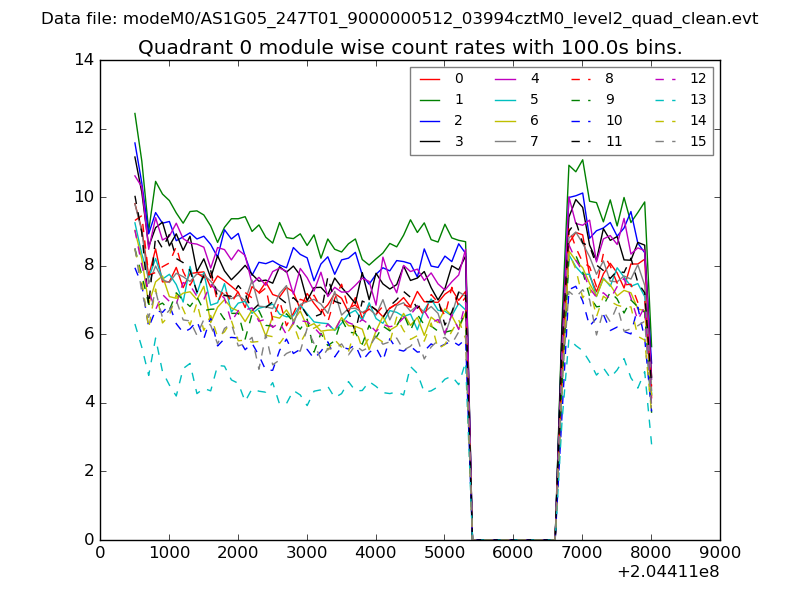 |
 |
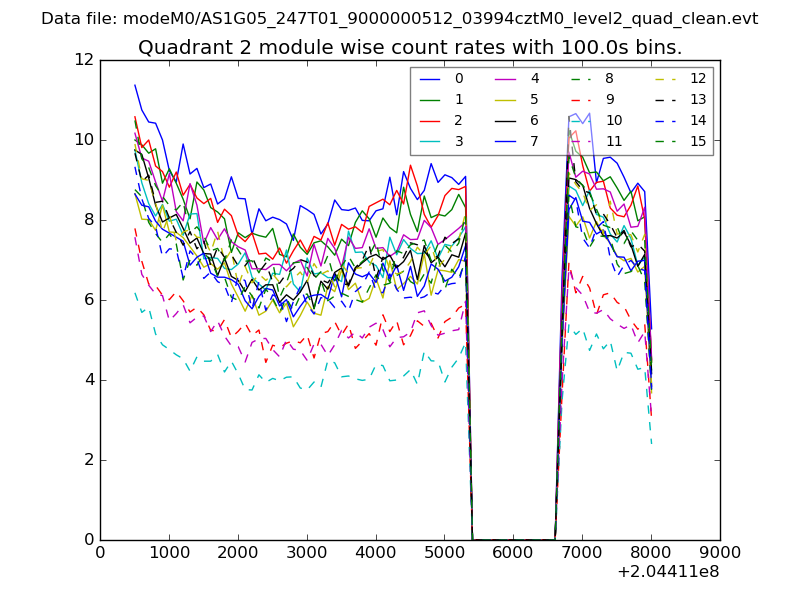
| Module-wise count rates for Quadrant B Data is divided into 100 sec bins |
 |
 |
| Module-wise count rates for Quadrant C Data is divided into 100 sec bins |
 |
 |
| Module-wise count rates for Quadrant D Data is divided into 100 sec bins |
 |
 |
| Parameter | Plot |
|---|---|
| CZT HV Monitor | 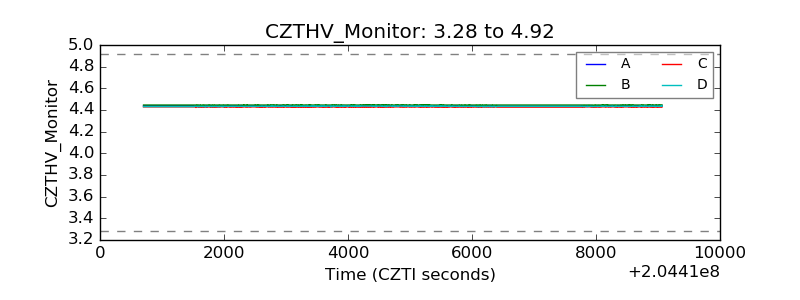 |
| D_VDD | 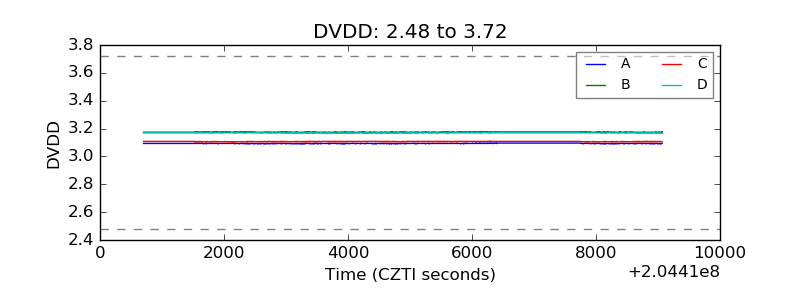 |
| Temperature 1 | 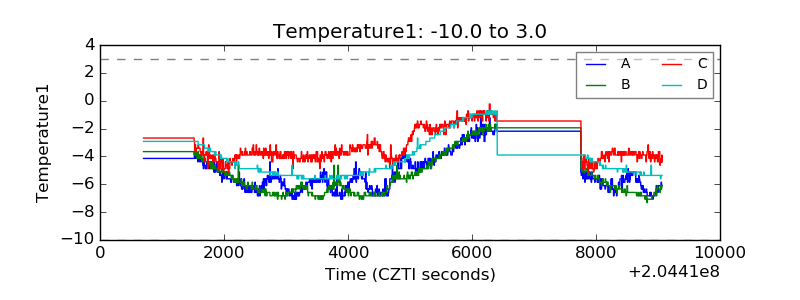 |
| Veto HV Monitor | 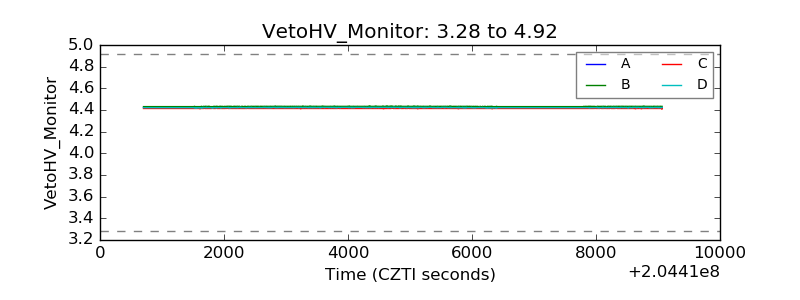 |
| Veto LLD | 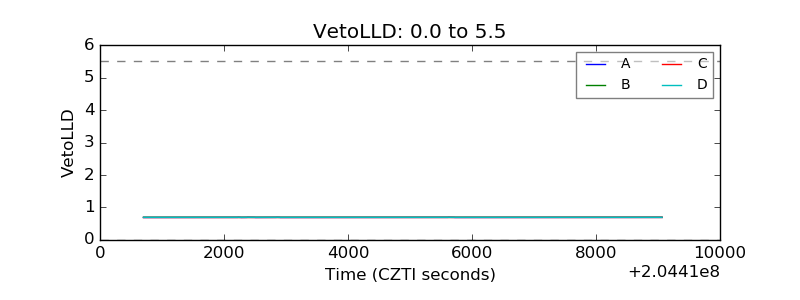 |
| Alpha Counter | 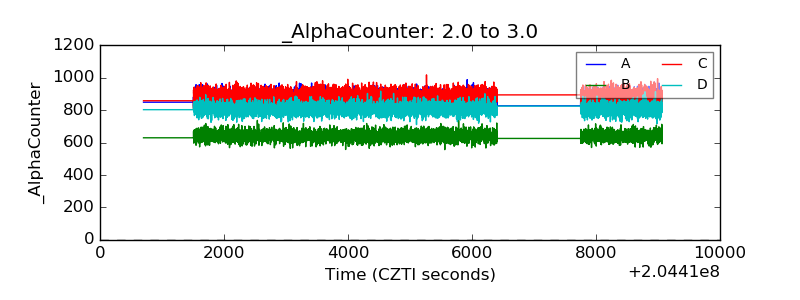 |
| _CPM_Rate | 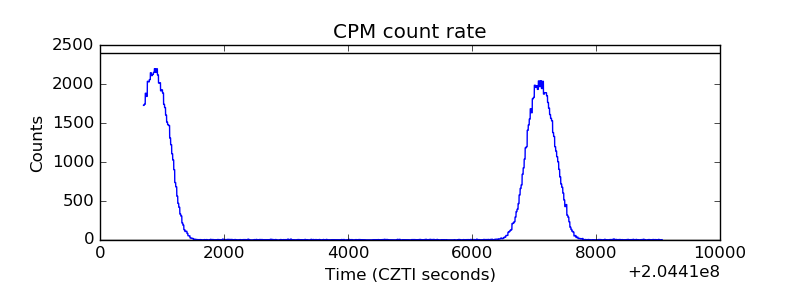 |
| CZT Counter | 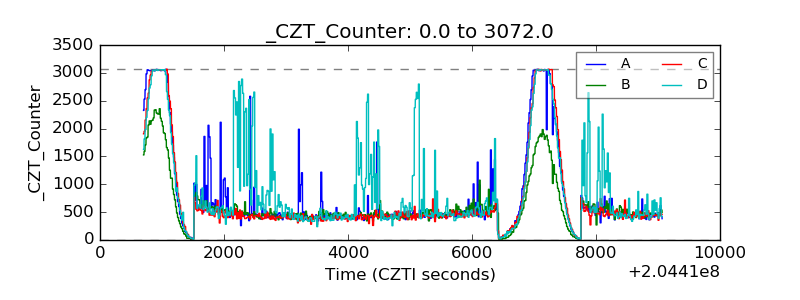 |
| +2.5 Volts monitor |  |
| +5 Volts monitor |  |
| _ROLL_ROT | 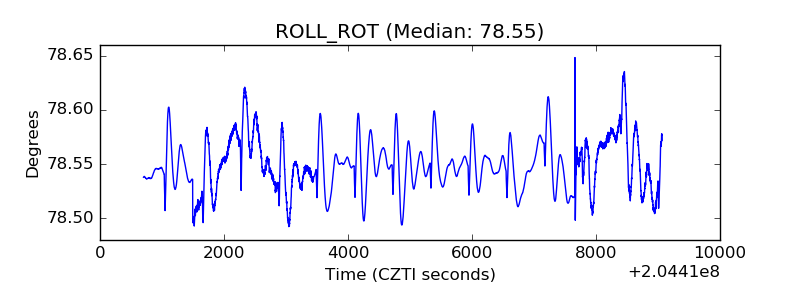 |
| _Roll_DEC | 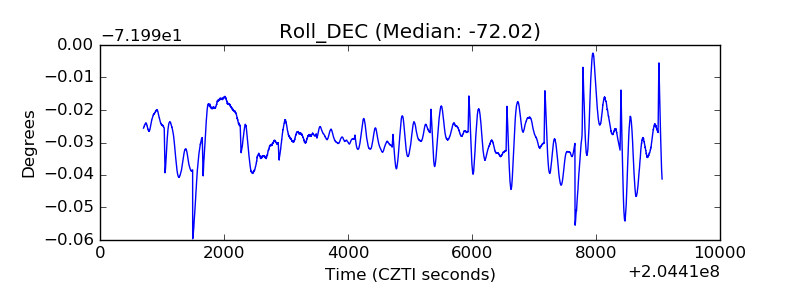 |
| _Roll_RA | 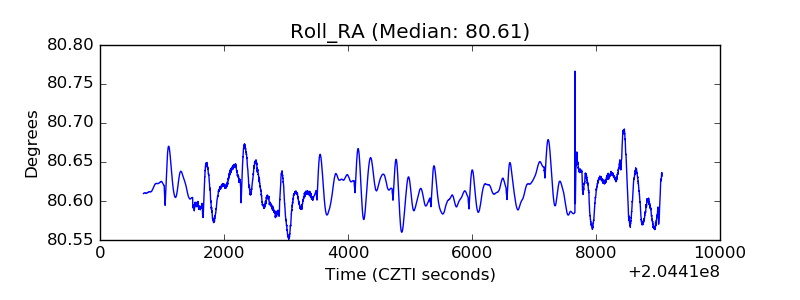 |
| Veto Counter | 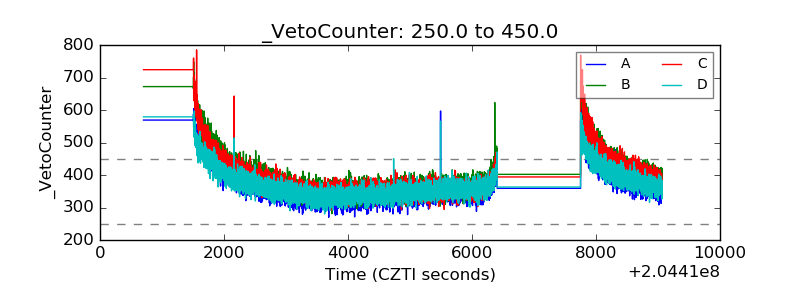 |