| Param | Original file | Final file |
|---|---|---|
| Filename | modeM0/AS1G05_247T01_9000000512_03995cztM0_level2.evt | modeM0/AS1G05_247T01_9000000512_03995cztM0_level2_quad_clean.evt |
| Size (bytes) | 447,065,280 | 106,767,360 |
| Size | 426.4 MB | 101.8 MB |
| Events in quadrant A | 3,301,624 | 703,810 |
| Events in quadrant B | 3,017,944 | 719,317 |
| Events in quadrant C | 2,803,947 | 705,145 |
| Events in quadrant D | 3,992,123 | 670,101 |
| Mode SS | |||
|---|---|---|---|
| Quadrant | BADHDUFLAG | Total packets | Discarded packets |
| A | 0 | 128 | 0 |
| B | 0 | 128 | 0 |
| C | 0 | 128 | 0 |
| D | 0 | 128 | 0 |
| Mode M9 | |||
|---|---|---|---|
| Quadrant | BADHDUFLAG | Total packets | Discarded packets |
| A | 0 | 21 | 0 |
| B | 0 | 21 | 0 |
| C | 0 | 21 | 0 |
| D | 0 | 22 | 0 |
| Mode M0 | |||
|---|---|---|---|
| Quadrant | BADHDUFLAG | Total packets | Discarded packets |
| A | 0 | 14060 | 3 |
| B | 0 | 12987 | 2 |
| C | 0 | 12706 | 2 |
| D | 0 | 16134 | 2 |
| Quadrant | Total seconds | Saturated seconds | Saturation percentage |
|---|---|---|---|
| A | 6228 | 222 | 3.564547% |
| B | 6228 | 67 | 1.075787% |
| C | 6228 | 33 | 0.529865% |
| D | 6228 | 163 | 2.617213% |
Noise dominated data is calculated using 1-second bins in cleaned event files. If a bin has >2000 counts, and if more than 50% of those come from <1% of pixels, then it is considered to be noise-dominated and hence unusable.
| Quadrant | # 1 sec bins | Bins with >0 counts | Bins with >2000 counts | High rate bins dominated by noise | Noise dominated (total time) | Noise dominated (detector-on time) | Marked lightcurve |
|---|---|---|---|---|---|---|---|
| A | 7503 | 6229 | 93 | 93 | 1.24% | 1.49% | 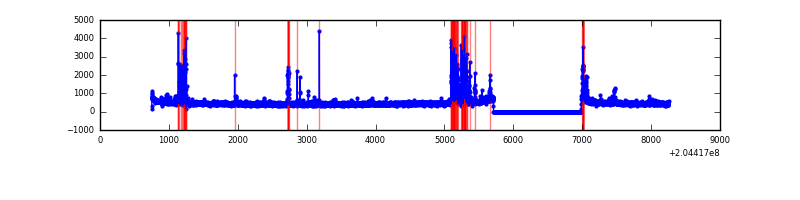 |
| B | 7503 | 6229 | 0 | 0 | 0.00% | 0.00% | 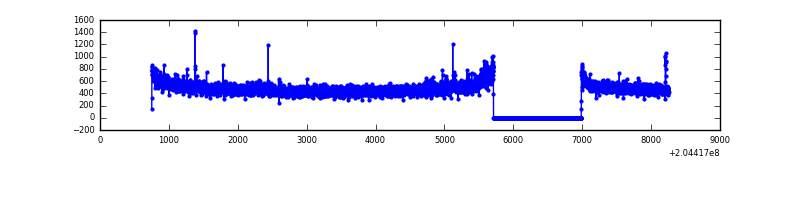 |
| C | 7503 | 6229 | 2 | 2 | 0.03% | 0.03% | 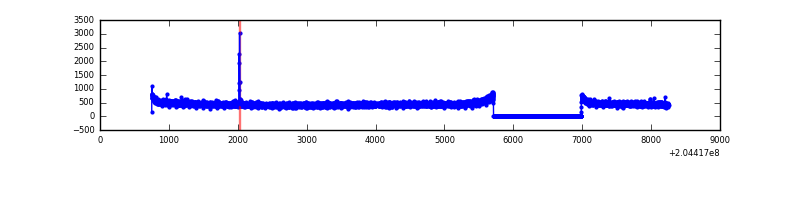 |
| D | 7503 | 6229 | 96 | 96 | 1.28% | 1.54% | 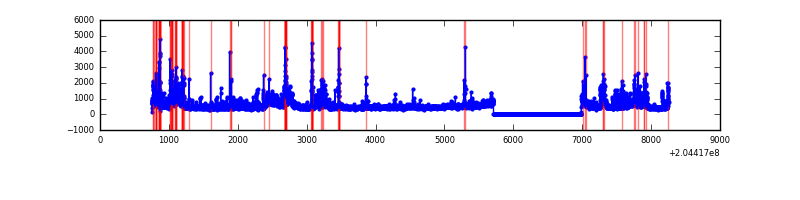 |
Top three noisy pixels from each quadrant. If the there are fewer than three noisy pixels in the level2.evt file, extra rows are filled as -1
| Pixel properties | Quadrant properties | ||||||
|---|---|---|---|---|---|---|---|
| Quadrant | DetID | PixID | Counts | Sigma | Mean | Median | Sigma |
| A | 0 | 50 | 405850 | 2791.76 | 722 | 707 | 145.1 |
| A | 0 | 118 | 43996 | 298.3 | 722 | 707 | 145.1 |
| A | 8 | 15 | 24891 | 166.65 | 722 | 707 | 145.1 |
| B | 3 | 0 | 110190 | 788.89 | 740 | 721 | 138.8 |
| B | 15 | 204 | 20067 | 139.42 | 740 | 721 | 138.8 |
| B | 0 | 183 | 15735 | 108.2 | 740 | 721 | 138.8 |
| C | 12 | 4 | 11170 | 63.78 | 715 | 718 | 163.9 |
| C | 13 | 61 | 5993 | 32.19 | 715 | 718 | 163.9 |
| C | 9 | 247 | 1934 | 7.42 | 715 | 718 | 163.9 |
| D | 2 | 63 | 1046783 | 6258.87 | 702 | 681 | 167.1 |
| D | 2 | 232 | 78316 | 464.49 | 702 | 681 | 167.1 |
| D | 10 | 246 | 66105 | 391.43 | 702 | 681 | 167.1 |
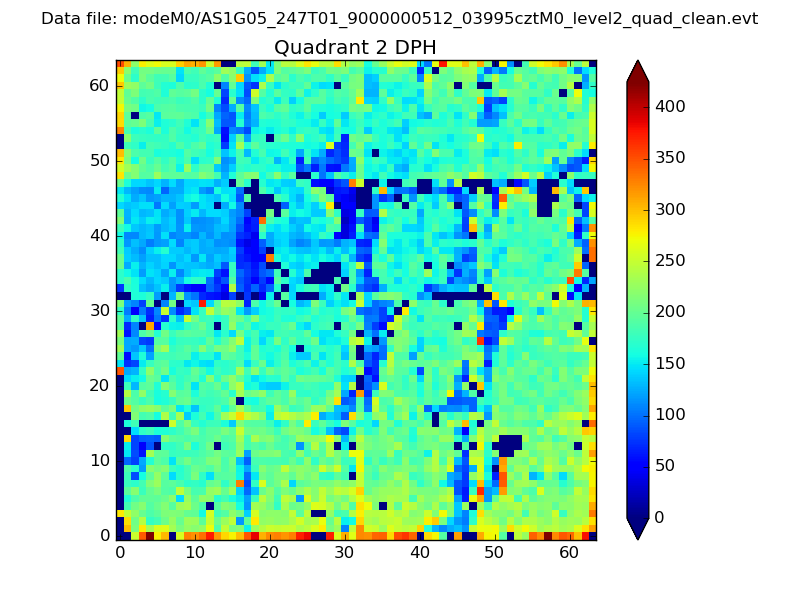
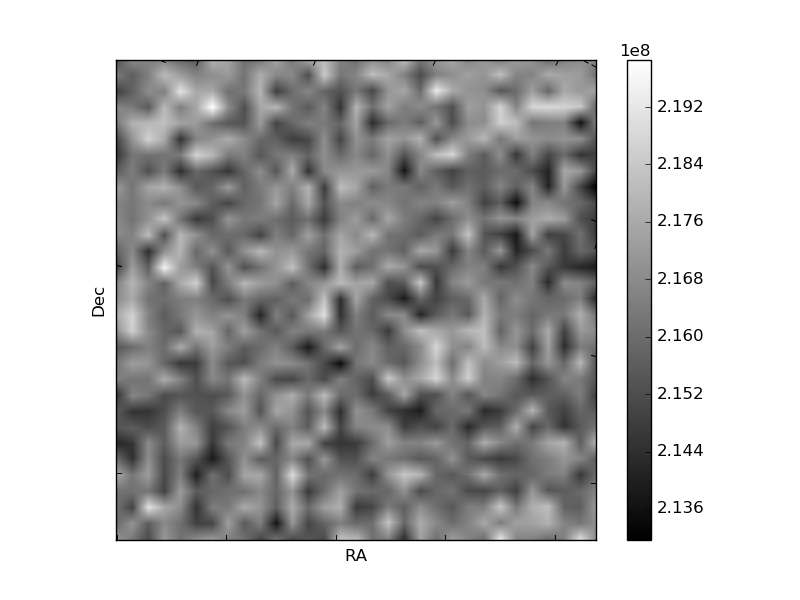
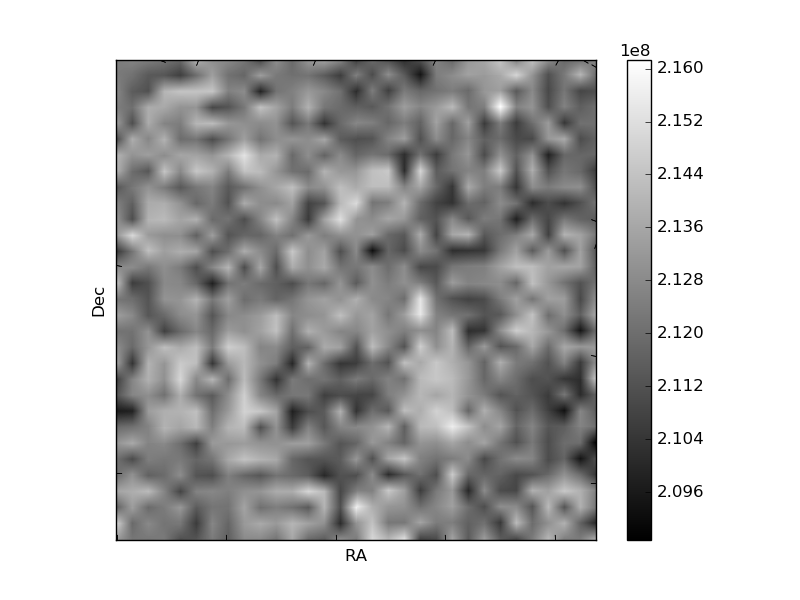
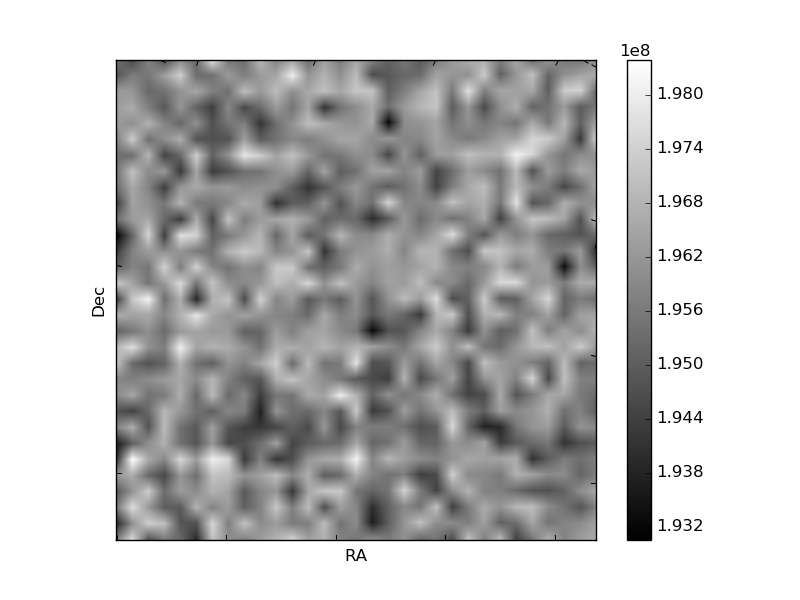
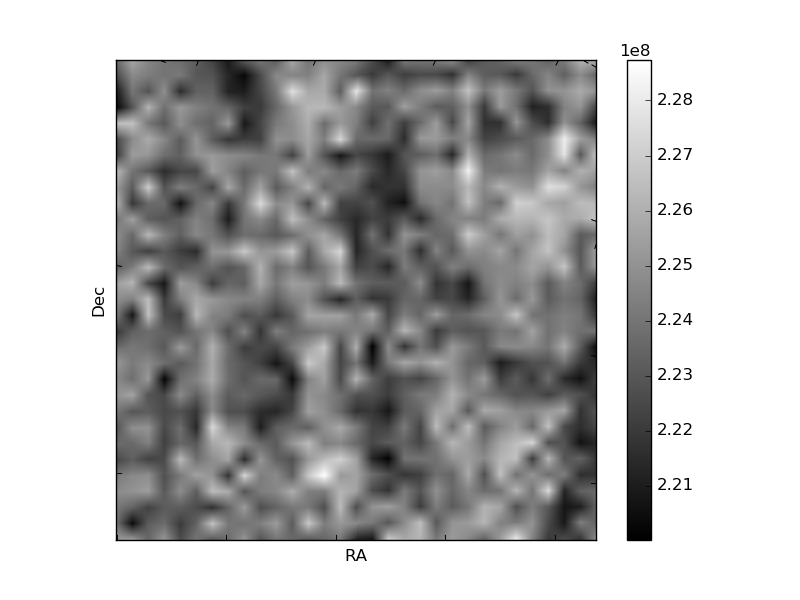
Histogram calculated using DETX and DETY for each event in the final _common_clean file
| Quadrant A | 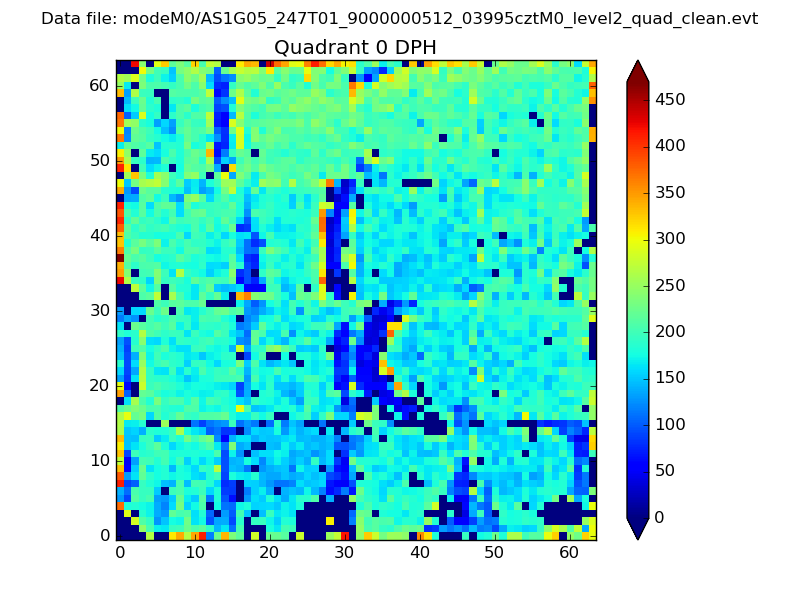 |
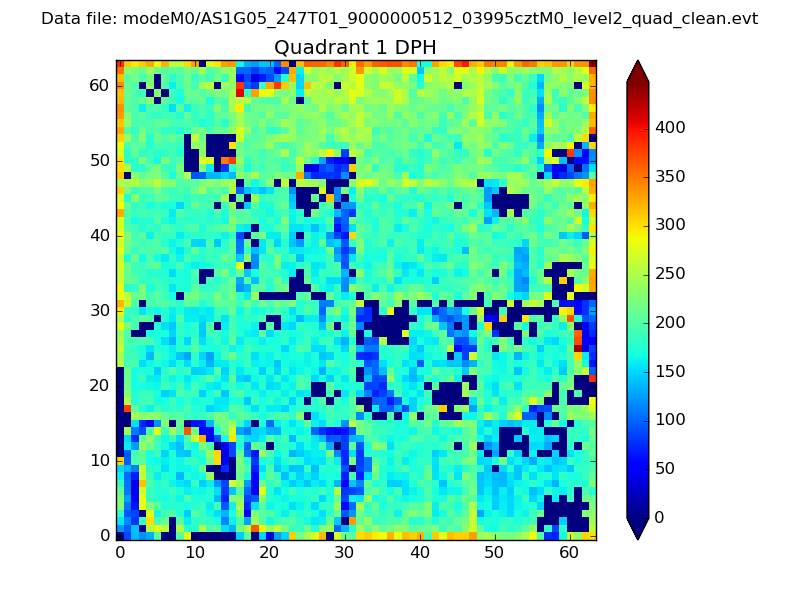 |
Quadrant B |
|---|---|---|---|
| Quadrant D | 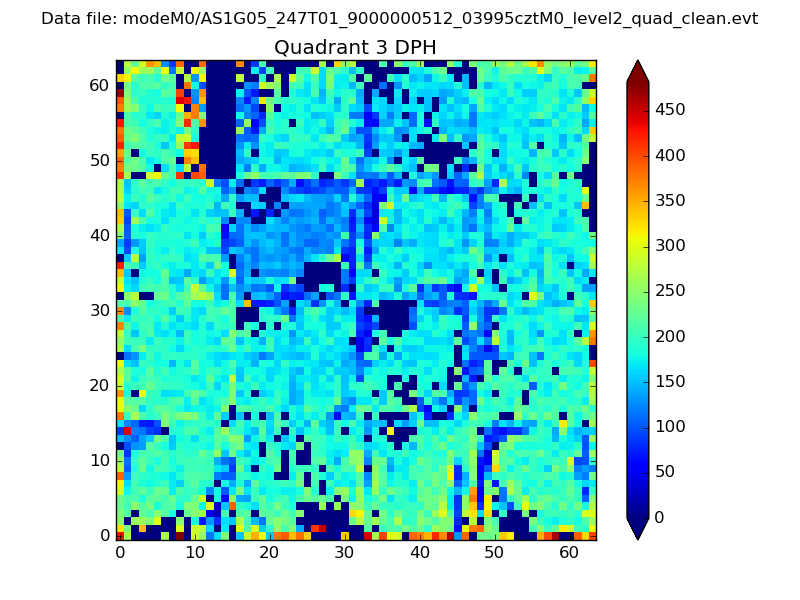 |
 |
Quadrant C |
| Plot type | Count rate plots | Images |
|---|---|---|
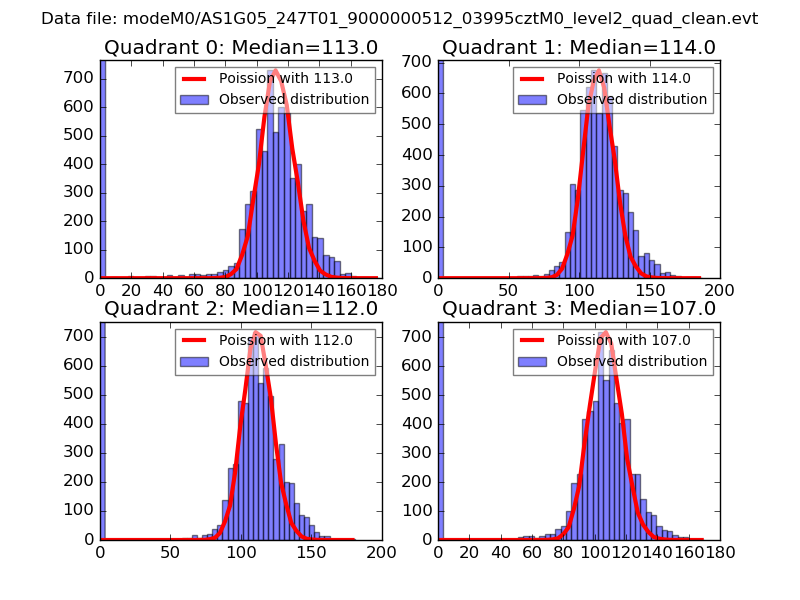
| Comparison with Poisson distribution Blue bars denote a histogram of data divided into 1 sec bins. Red curve is a Poisson curve with rate = median count rate of data. |
 |
 |
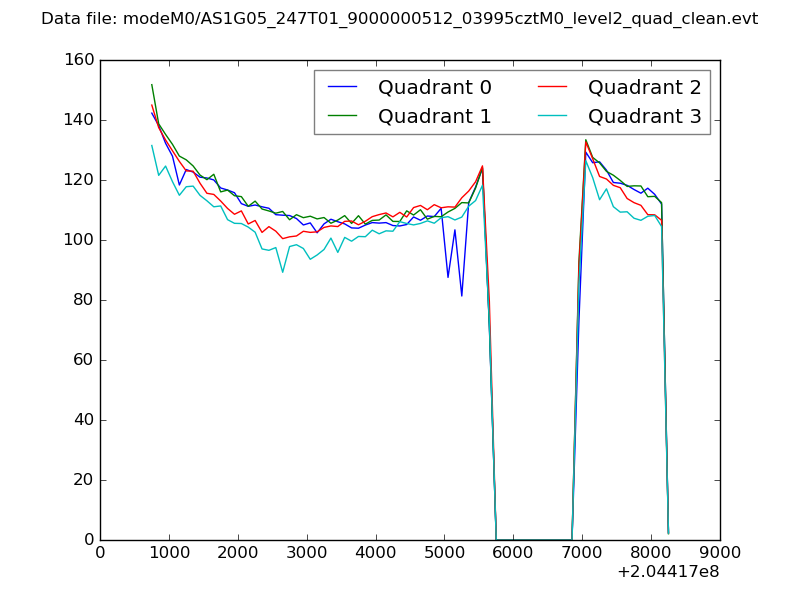
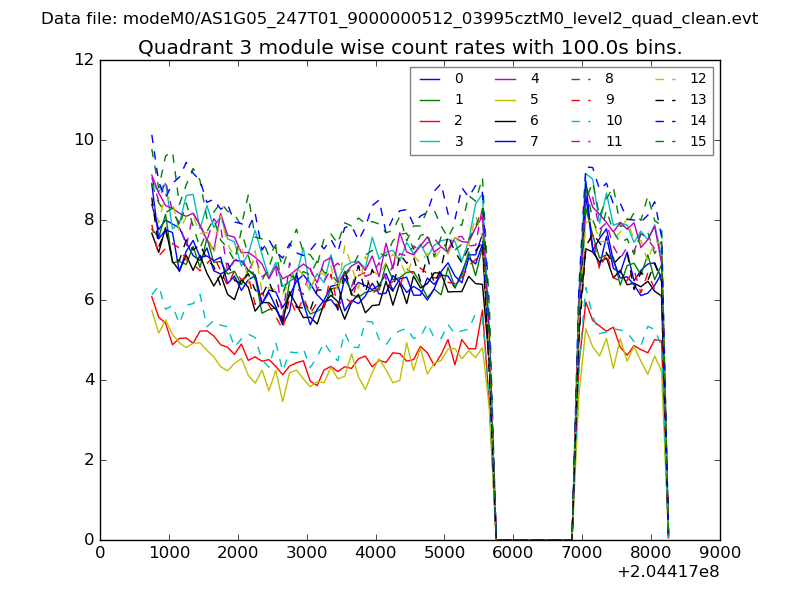
| Quadrant-wise count rates Data is divided into 100 sec bins |
 |
|
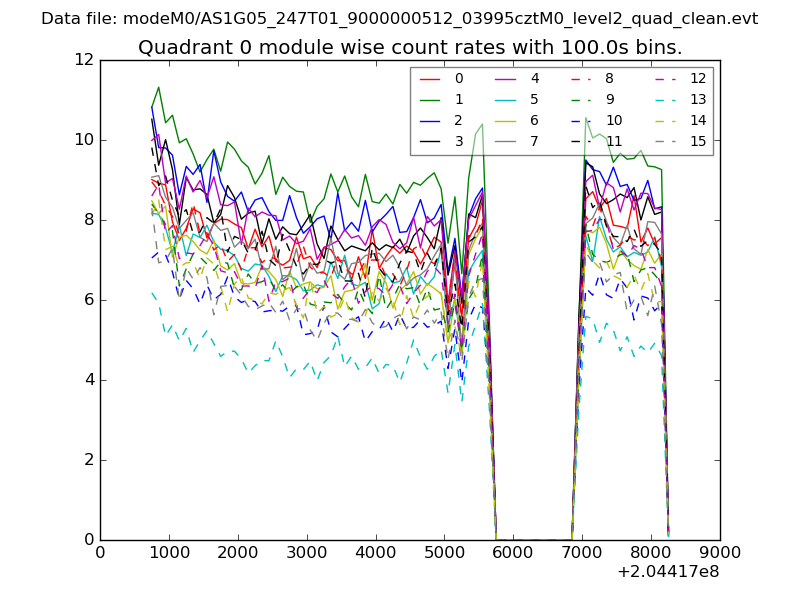
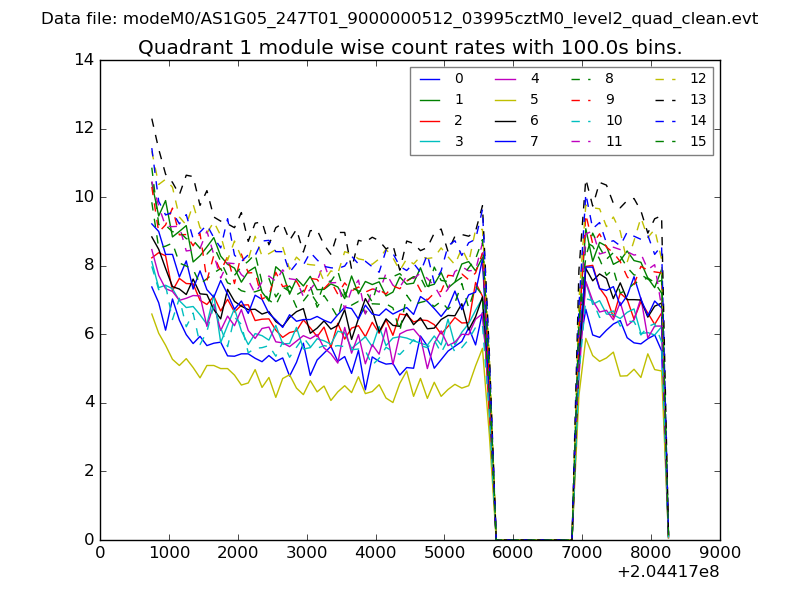
| Module-wise count rates for Quadrant A Data is divided into 100 sec bins |
 |
 |
| Module-wise count rates for Quadrant B Data is divided into 100 sec bins |
 |
 |
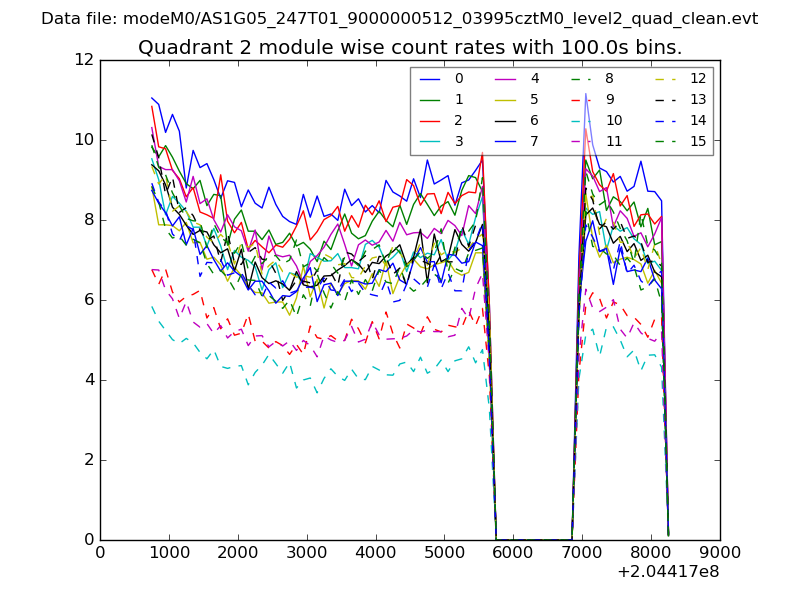
| Module-wise count rates for Quadrant C Data is divided into 100 sec bins |
 |
 |
| Module-wise count rates for Quadrant D Data is divided into 100 sec bins |
 |
 |
| Parameter | Plot |
|---|---|
| CZT HV Monitor | 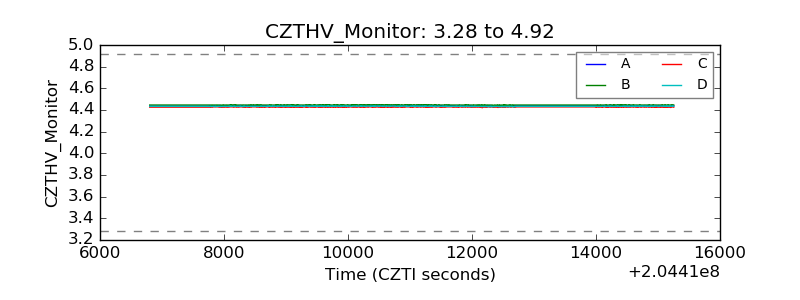 |
| D_VDD | 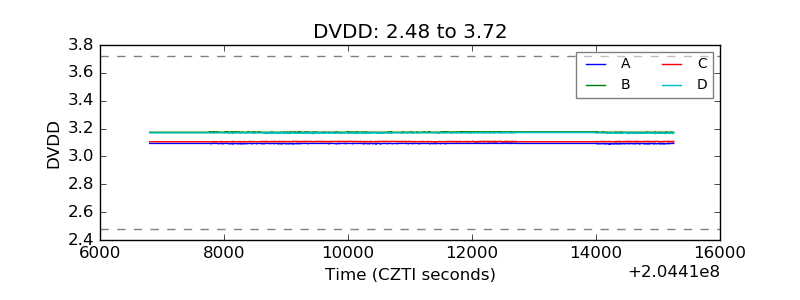 |
| Temperature 1 | 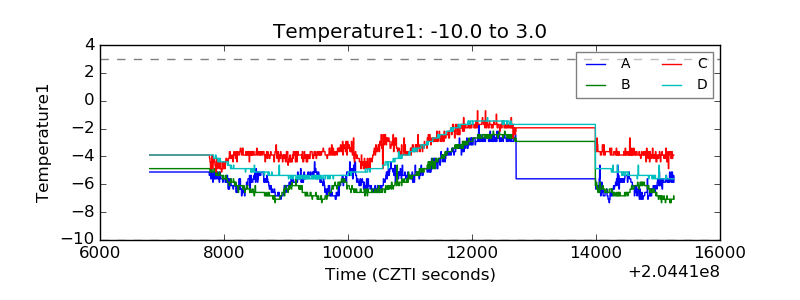 |
| Veto HV Monitor | 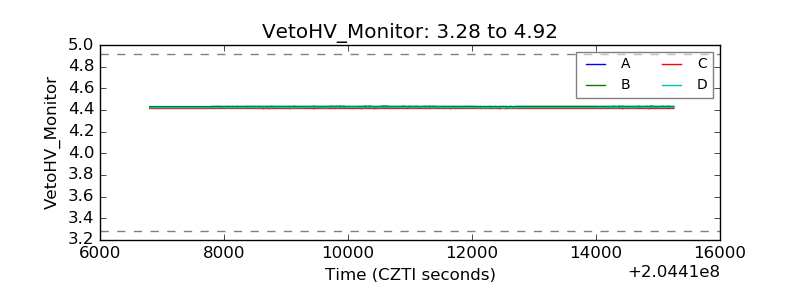 |
| Veto LLD | 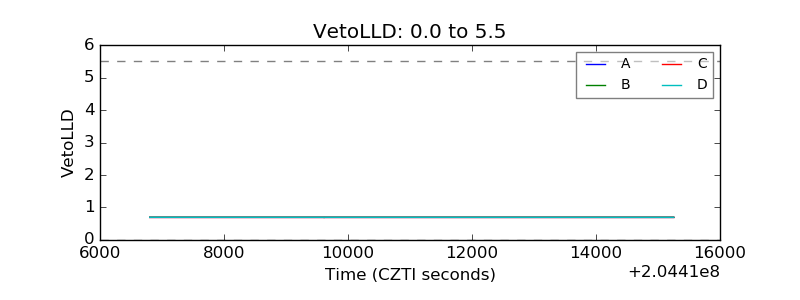 |
| Alpha Counter | 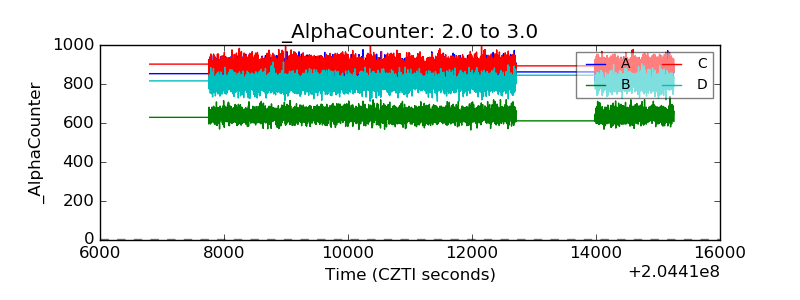 |
| _CPM_Rate | 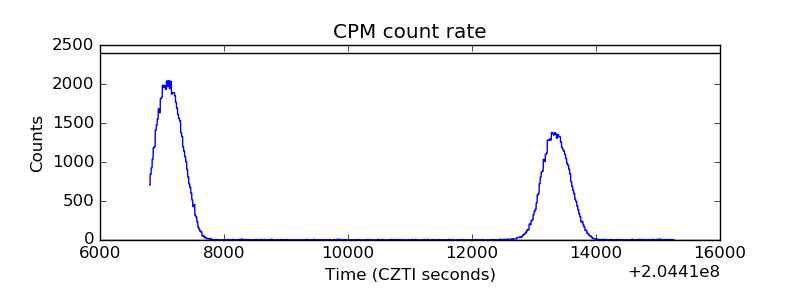 |
| CZT Counter | 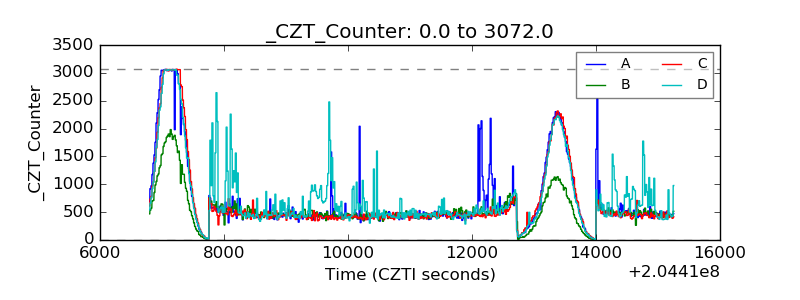 |
| +2.5 Volts monitor |  |
| +5 Volts monitor |  |
| _ROLL_ROT | 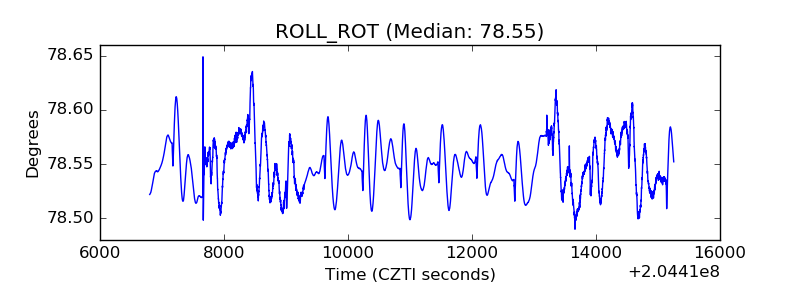 |
| _Roll_DEC | 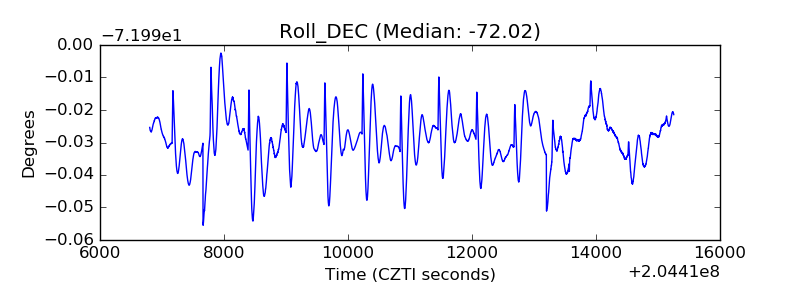 |
| _Roll_RA | 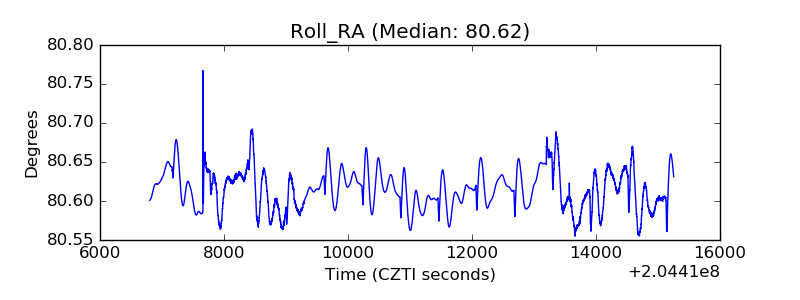 |
| Veto Counter | 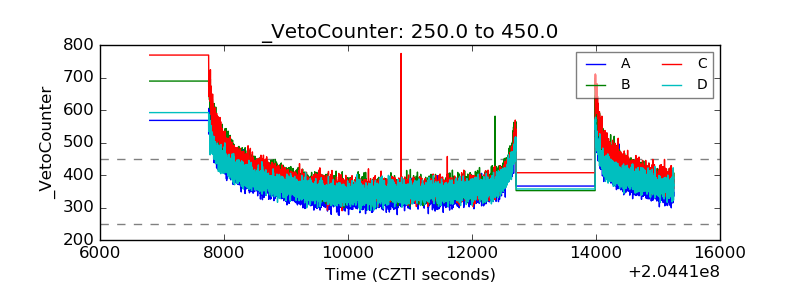 |