| Param | Original file | Final file |
|---|---|---|
| Filename | modeM0/AS1G05_247T01_9000000512_03996cztM0_level2.evt | modeM0/AS1G05_247T01_9000000512_03996cztM0_level2_quad_clean.evt |
| Size (bytes) | 455,008,320 | 105,966,720 |
| Size | 433.9 MB | 101.1 MB |
| Events in quadrant A | 3,014,554 | 700,532 |
| Events in quadrant B | 3,022,878 | 707,139 |
| Events in quadrant C | 2,796,726 | 695,622 |
| Events in quadrant D | 4,513,235 | 661,864 |
| Mode SS | |||
|---|---|---|---|
| Quadrant | BADHDUFLAG | Total packets | Discarded packets |
| A | 0 | 130 | 0 |
| B | 0 | 130 | 0 |
| C | 0 | 130 | 0 |
| D | 0 | 130 | 0 |
| Mode M9 | |||
|---|---|---|---|
| Quadrant | BADHDUFLAG | Total packets | Discarded packets |
| A | 0 | 24 | 0 |
| B | 0 | 24 | 0 |
| C | 0 | 24 | 0 |
| D | 0 | 24 | 0 |
| Mode M0 | |||
|---|---|---|---|
| Quadrant | BADHDUFLAG | Total packets | Discarded packets |
| A | 0 | 13323 | 3 |
| B | 0 | 13213 | 2 |
| C | 0 | 12877 | 2 |
| D | 0 | 17950 | 2 |
| Quadrant | Total seconds | Saturated seconds | Saturation percentage |
|---|---|---|---|
| A | 6370 | 62 | 0.973312% |
| B | 6370 | 38 | 0.596546% |
| C | 6370 | 26 | 0.408163% |
| D | 6370 | 159 | 2.496075% |
Noise dominated data is calculated using 1-second bins in cleaned event files. If a bin has >2000 counts, and if more than 50% of those come from <1% of pixels, then it is considered to be noise-dominated and hence unusable.
| Quadrant | # 1 sec bins | Bins with >0 counts | Bins with >2000 counts | High rate bins dominated by noise | Noise dominated (total time) | Noise dominated (detector-on time) | Marked lightcurve |
|---|---|---|---|---|---|---|---|
| A | 7600 | 6372 | 15 | 15 | 0.20% | 0.24% |  |
| B | 7600 | 6372 | 4 | 4 | 0.05% | 0.06% |  |
| C | 7600 | 6372 | 0 | 0 | 0.00% | 0.00% |  |
| D | 7600 | 6372 | 103 | 103 | 1.36% | 1.62% | 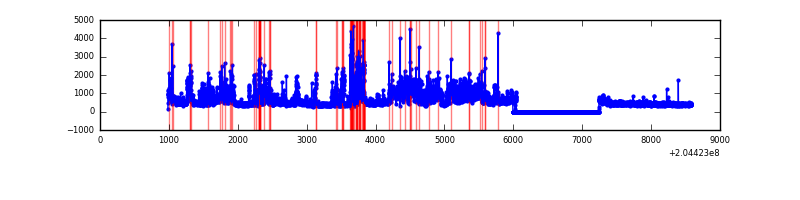 |
Top three noisy pixels from each quadrant. If the there are fewer than three noisy pixels in the level2.evt file, extra rows are filled as -1
| Pixel properties | Quadrant properties | ||||||
|---|---|---|---|---|---|---|---|
| Quadrant | DetID | PixID | Counts | Sigma | Mean | Median | Sigma |
| A | 0 | 50 | 86907 | 589.05 | 726 | 711 | 146.3 |
| A | 0 | 118 | 38240 | 256.47 | 726 | 711 | 146.3 |
| A | 8 | 4 | 35489 | 237.67 | 726 | 711 | 146.3 |
| B | 3 | 0 | 51818 | 367.9 | 738 | 720 | 138.9 |
| B | 14 | 167 | 49451 | 350.86 | 738 | 720 | 138.9 |
| B | 12 | 18 | 19505 | 135.25 | 738 | 720 | 138.9 |
| C | 13 | 61 | 6018 | 32.22 | 714 | 717 | 164.5 |
| C | 2 | 37 | 2448 | 10.52 | 714 | 717 | 164.5 |
| C | 9 | 247 | 2136 | 8.62 | 714 | 717 | 164.5 |
| D | 2 | 63 | 1728306 | 10356.6 | 701 | 681 | 166.8 |
| D | 8 | 112 | 35889 | 211.06 | 701 | 681 | 166.8 |
| D | 2 | 232 | 34965 | 205.52 | 701 | 681 | 166.8 |
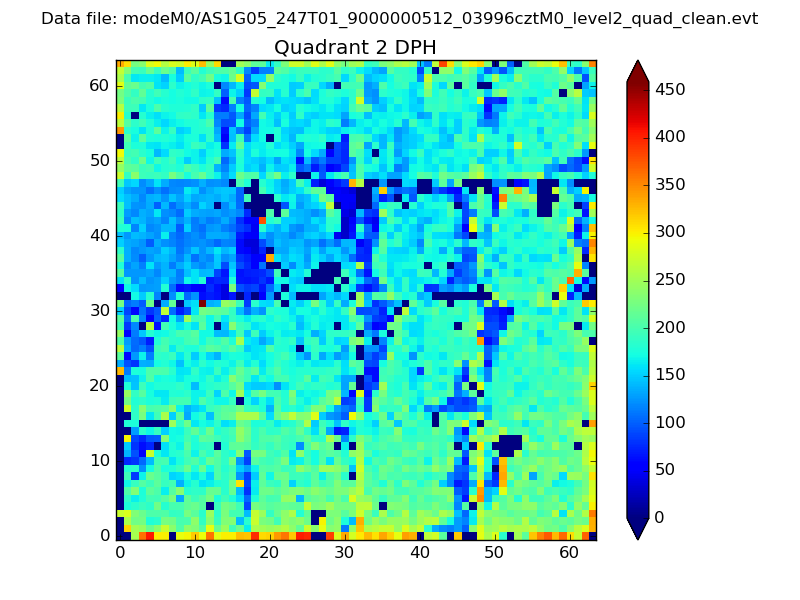
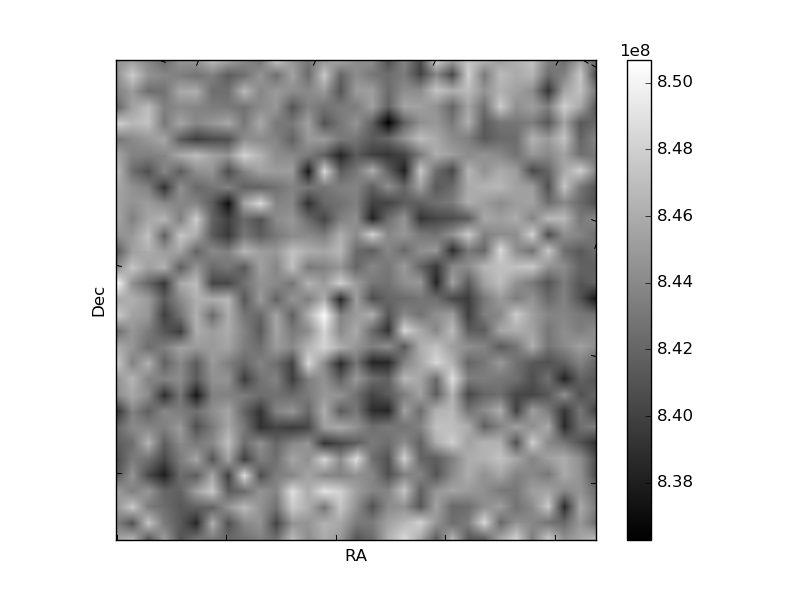
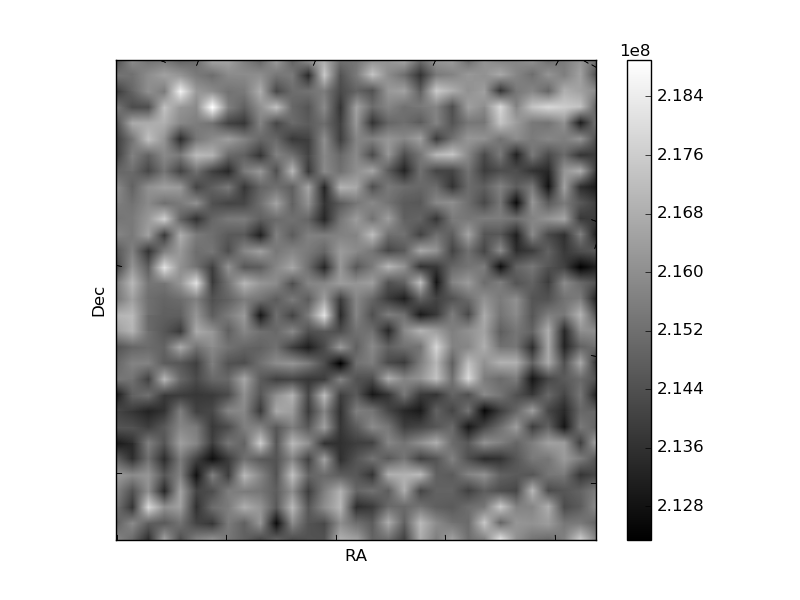
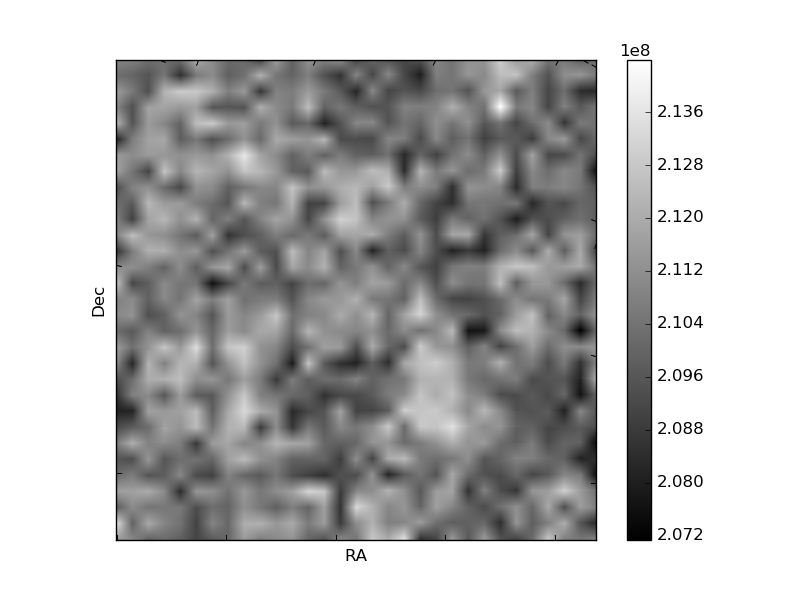
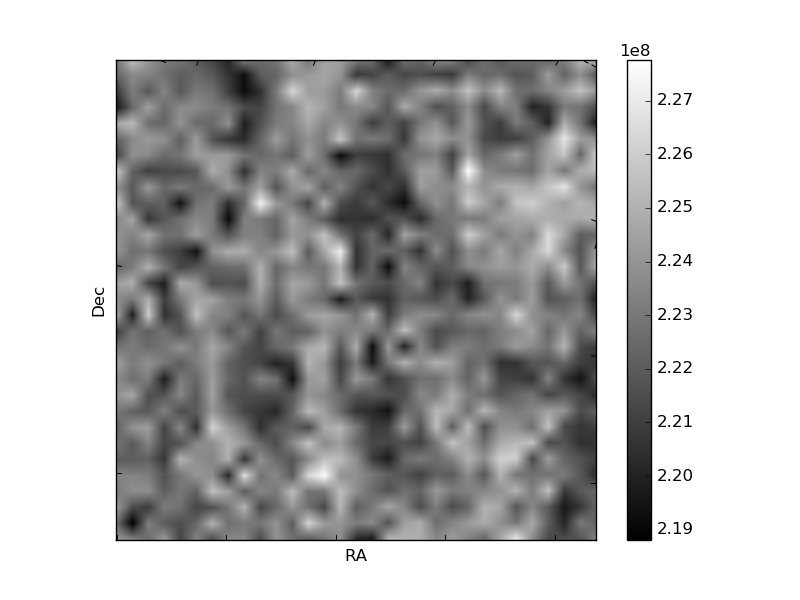
Histogram calculated using DETX and DETY for each event in the final _common_clean file
| Quadrant A |  |
 |
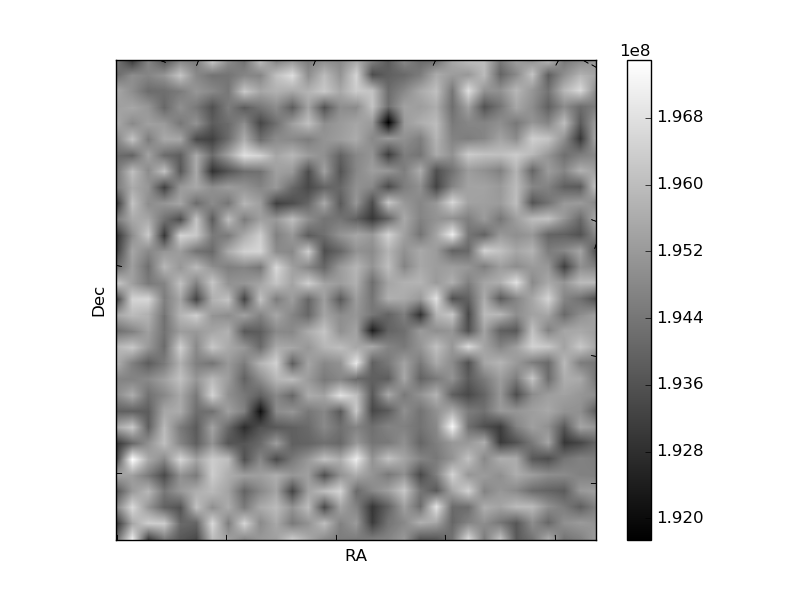
Quadrant B |
|---|---|---|---|
| Quadrant D | 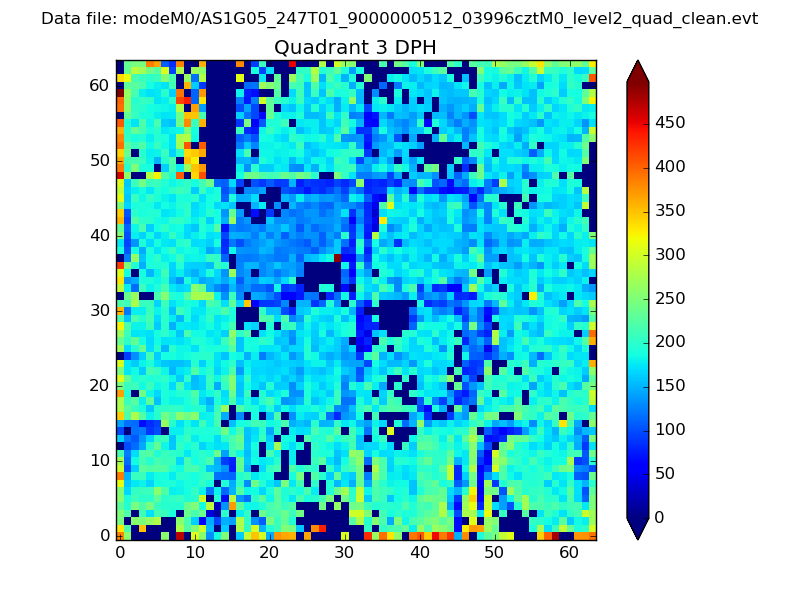 |
 |
Quadrant C |
| Plot type | Count rate plots | Images |
|---|---|---|
| Comparison with Poisson distribution Blue bars denote a histogram of data divided into 1 sec bins. Red curve is a Poisson curve with rate = median count rate of data. |
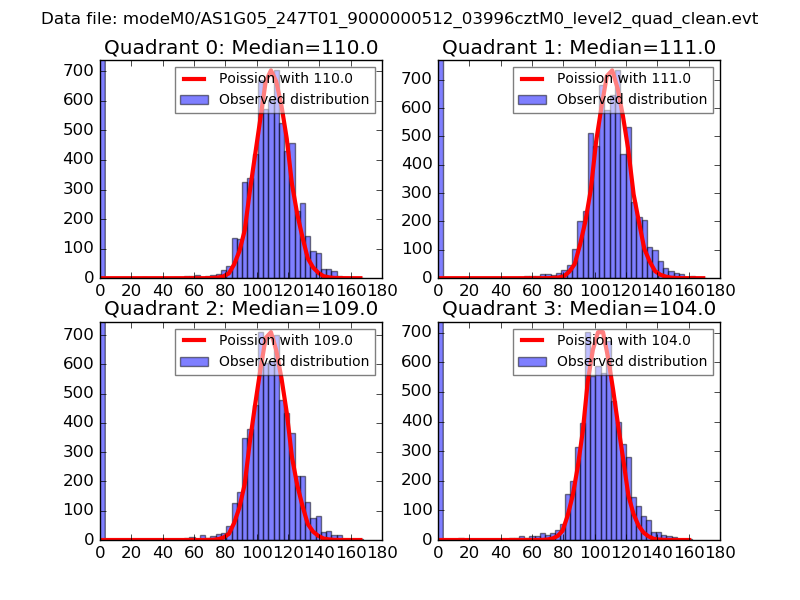 |
 |
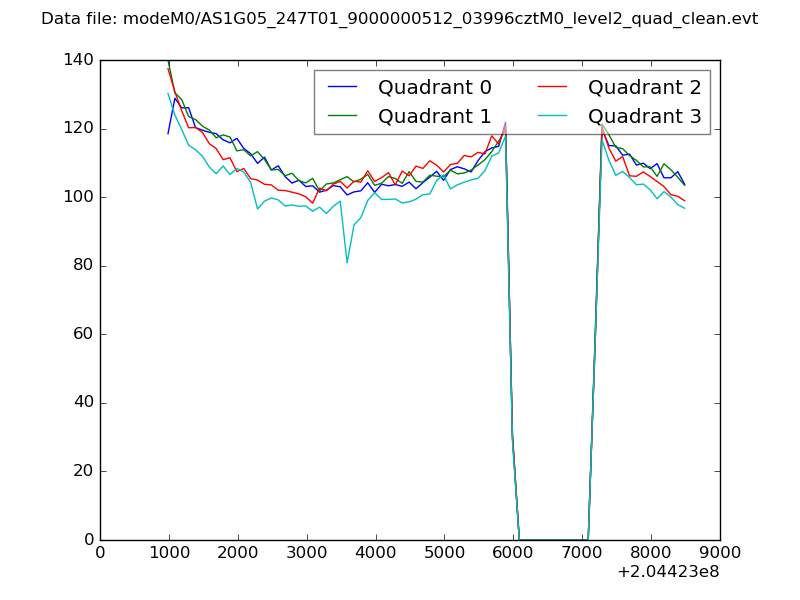
| Quadrant-wise count rates Data is divided into 100 sec bins |
 |
|
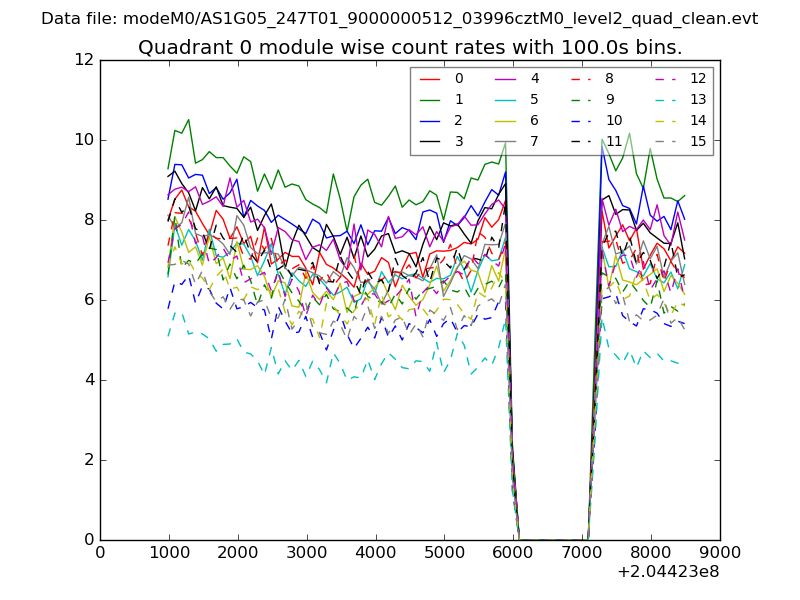
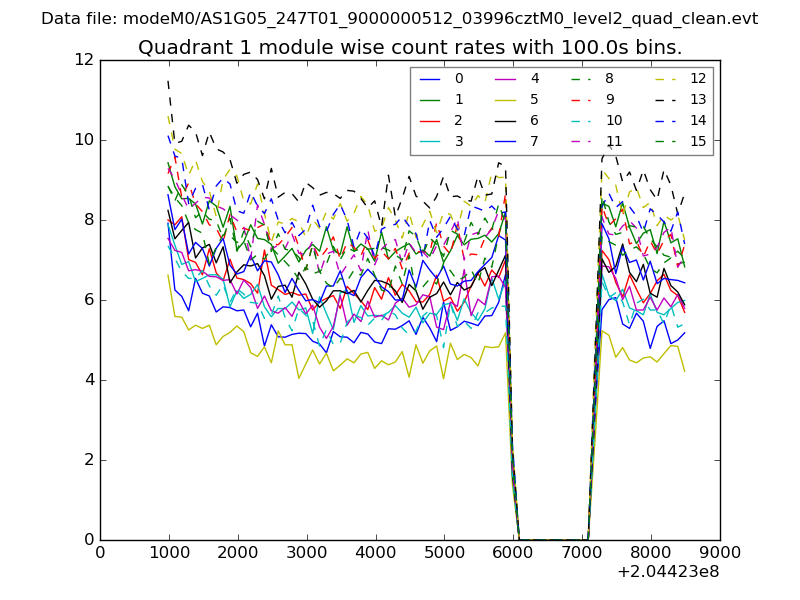
| Module-wise count rates for Quadrant A Data is divided into 100 sec bins |
 |
 |
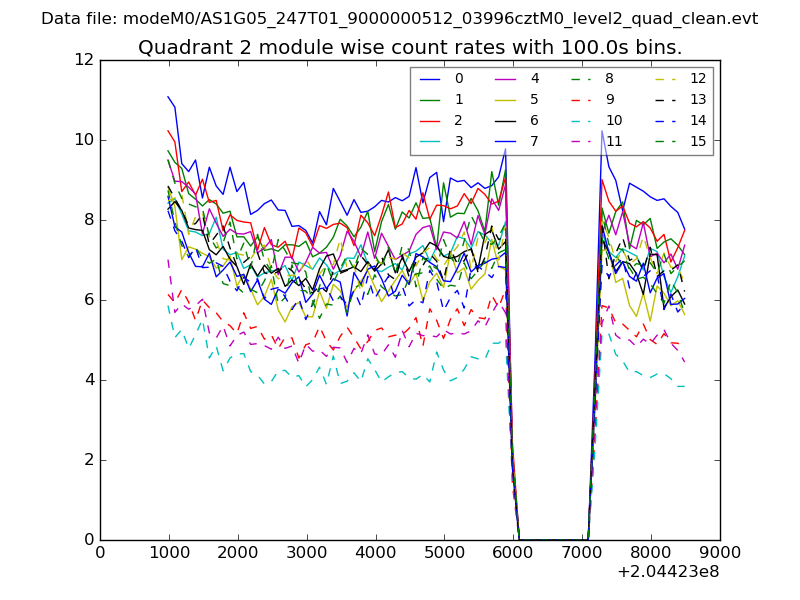
| Module-wise count rates for Quadrant B Data is divided into 100 sec bins |
 |
 |
| Module-wise count rates for Quadrant C Data is divided into 100 sec bins |
 |
 |
| Module-wise count rates for Quadrant D Data is divided into 100 sec bins |
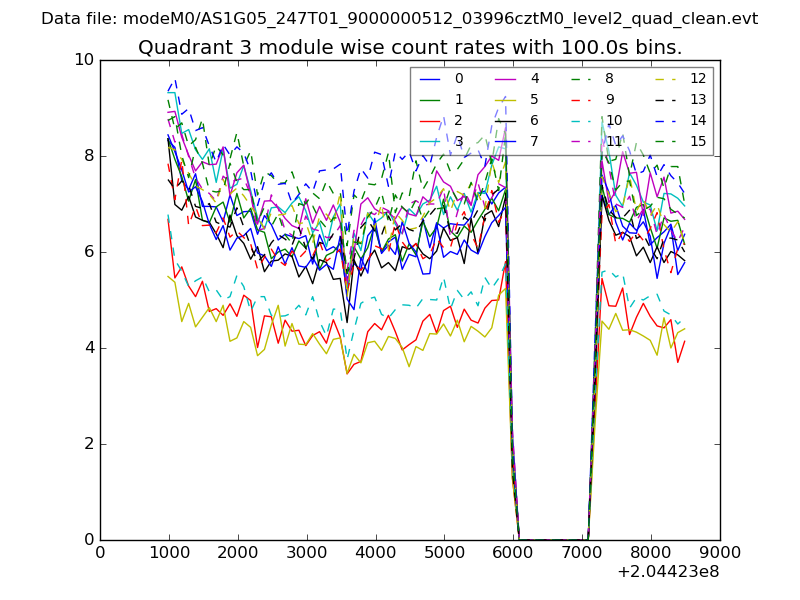 |
 |
| Parameter | Plot |
|---|---|
| CZT HV Monitor | 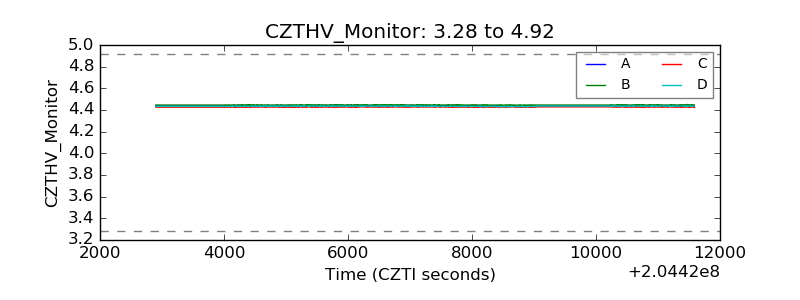 |
| D_VDD | 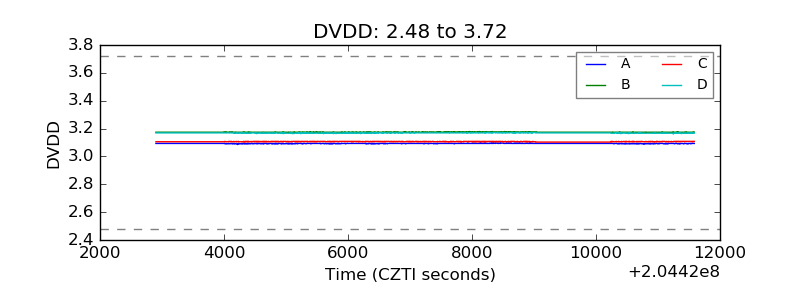 |
| Temperature 1 | 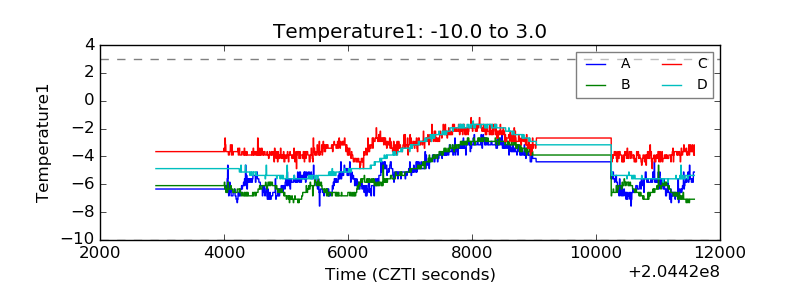 |
| Veto HV Monitor | 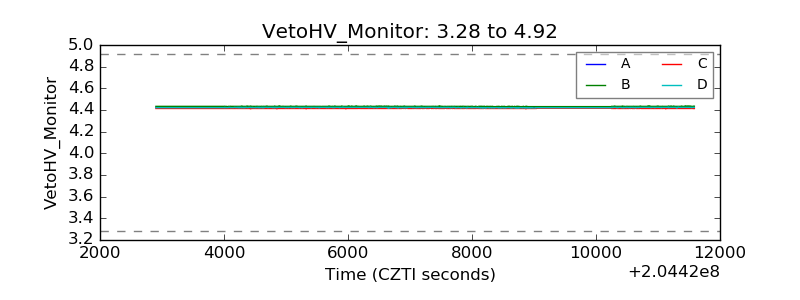 |
| Veto LLD |  |
| Alpha Counter | 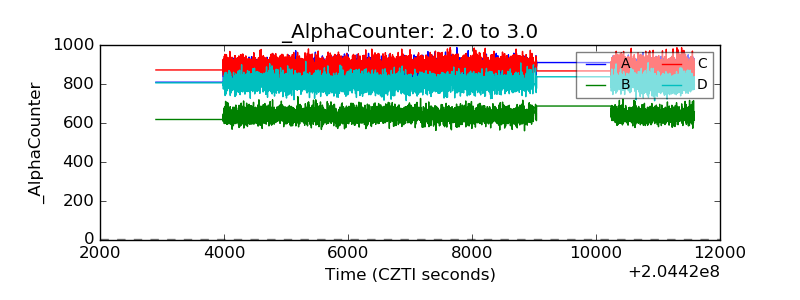 |
| _CPM_Rate | 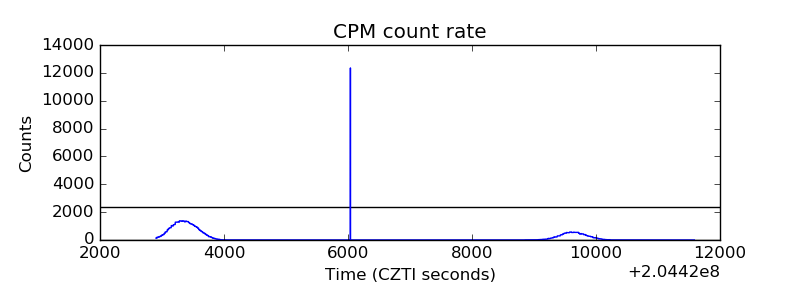 |
| CZT Counter | 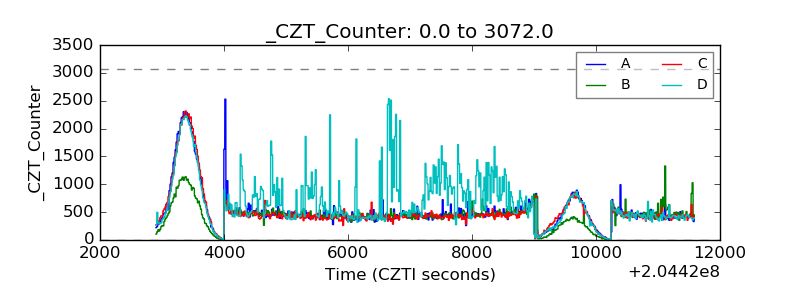 |
| +2.5 Volts monitor |  |
| +5 Volts monitor |  |
| _ROLL_ROT | 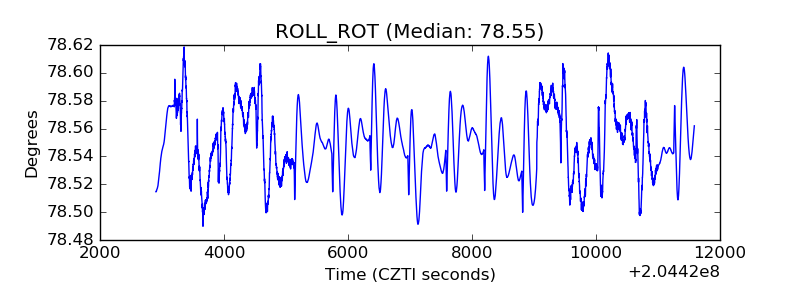 |
| _Roll_DEC | 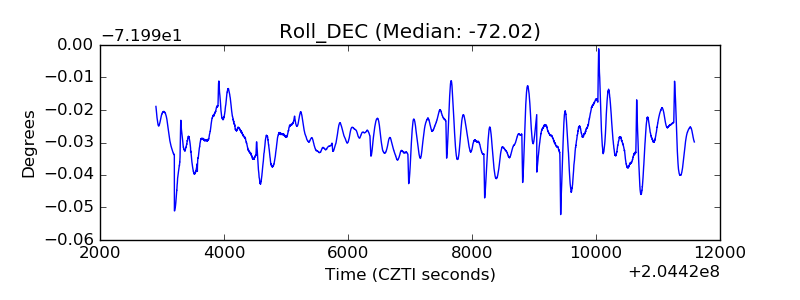 |
| _Roll_RA | 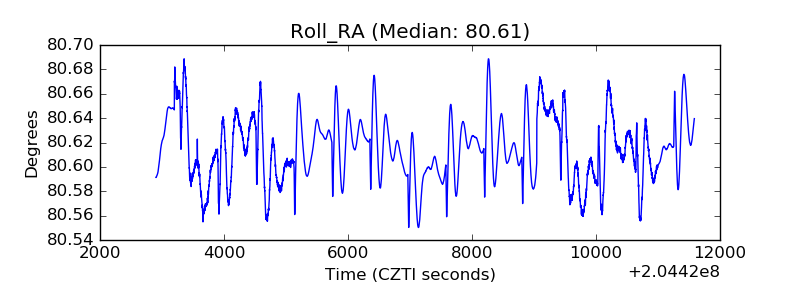 |
| Veto Counter | 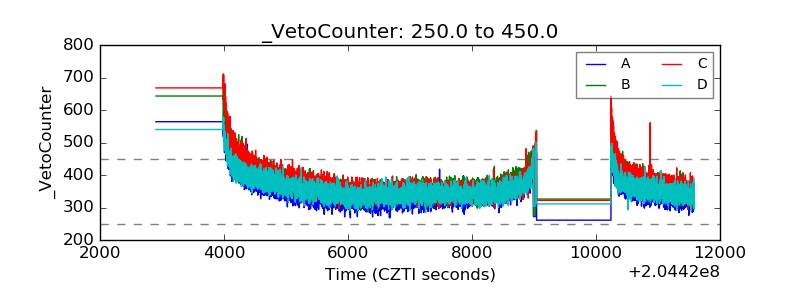 |