| Param | Original file | Final file |
|---|---|---|
| Filename | modeM0/AS1G05_247T01_9000000512_03997cztM0_level2.evt | modeM0/AS1G05_247T01_9000000512_03997cztM0_level2_quad_clean.evt |
| Size (bytes) | 453,412,800 | 113,823,360 |
| Size | 432.4 MB | 108.6 MB |
| Events in quadrant A | 3,224,861 | 749,414 |
| Events in quadrant B | 3,290,032 | 748,456 |
| Events in quadrant C | 3,040,275 | 741,904 |
| Events in quadrant D | 3,700,782 | 720,192 |
| Mode SS | |||
|---|---|---|---|
| Quadrant | BADHDUFLAG | Total packets | Discarded packets |
| A | 0 | 146 | 0 |
| B | 0 | 146 | 0 |
| C | 0 | 146 | 0 |
| D | 0 | 146 | 0 |
| Mode M9 | |||
|---|---|---|---|
| Quadrant | BADHDUFLAG | Total packets | Discarded packets |
| A | 0 | 22 | 0 |
| B | 0 | 22 | 0 |
| C | 0 | 22 | 0 |
| D | 0 | 22 | 0 |
| Mode M0 | |||
|---|---|---|---|
| Quadrant | BADHDUFLAG | Total packets | Discarded packets |
| A | 0 | 14545 | 3 |
| B | 0 | 14529 | 2 |
| C | 0 | 14220 | 2 |
| D | 0 | 16003 | 2 |
| Quadrant | Total seconds | Saturated seconds | Saturation percentage |
|---|---|---|---|
| A | 6997 | 53 | 0.757467% |
| B | 6997 | 57 | 0.814635% |
| C | 6997 | 59 | 0.843219% |
| D | 6997 | 106 | 1.514935% |
Noise dominated data is calculated using 1-second bins in cleaned event files. If a bin has >2000 counts, and if more than 50% of those come from <1% of pixels, then it is considered to be noise-dominated and hence unusable.
| Quadrant | # 1 sec bins | Bins with >0 counts | Bins with >2000 counts | High rate bins dominated by noise | Noise dominated (total time) | Noise dominated (detector-on time) | Marked lightcurve |
|---|---|---|---|---|---|---|---|
| A | 9157 | 7000 | 0 | 0 | 0.00% | 0.00% |  |
| B | 9157 | 7000 | 3 | 3 | 0.03% | 0.04% |  |
| C | 9157 | 7000 | 0 | 0 | 0.00% | 0.00% |  |
| D | 9157 | 7000 | 34 | 34 | 0.37% | 0.49% |  |
Top three noisy pixels from each quadrant. If the there are fewer than three noisy pixels in the level2.evt file, extra rows are filled as -1
| Pixel properties | Quadrant properties | ||||||
|---|---|---|---|---|---|---|---|
| Quadrant | DetID | PixID | Counts | Sigma | Mean | Median | Sigma |
| A | 3 | 1 | 66806 | 406.33 | 795 | 778 | 162.5 |
| A | 8 | 15 | 47451 | 287.22 | 795 | 778 | 162.5 |
| A | 0 | 50 | 21022 | 124.58 | 795 | 778 | 162.5 |
| B | 14 | 167 | 68268 | 445.13 | 804 | 786 | 151.6 |
| B | 3 | 0 | 46617 | 302.32 | 804 | 786 | 151.6 |
| B | 15 | 204 | 34796 | 224.34 | 804 | 786 | 151.6 |
| C | 13 | 61 | 6453 | 31.65 | 777 | 779 | 179.3 |
| C | 9 | 247 | 2243 | 8.17 | 777 | 779 | 179.3 |
| C | 7 | 159 | 1933 | 6.44 | 777 | 779 | 179.3 |
| D | 2 | 63 | 442781 | 2417.06 | 770 | 749 | 182.9 |
| D | 13 | 239 | 120284 | 653.62 | 770 | 749 | 182.9 |
| D | 10 | 246 | 65622 | 354.73 | 770 | 749 | 182.9 |
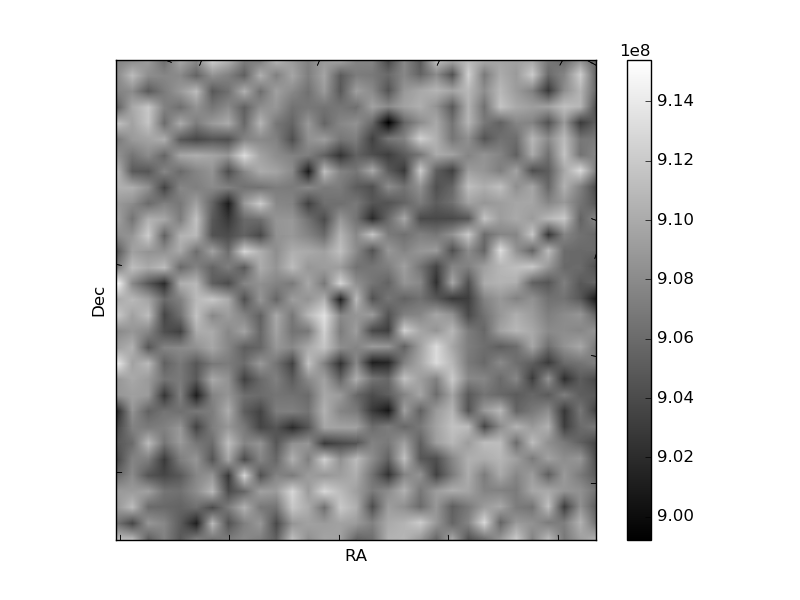
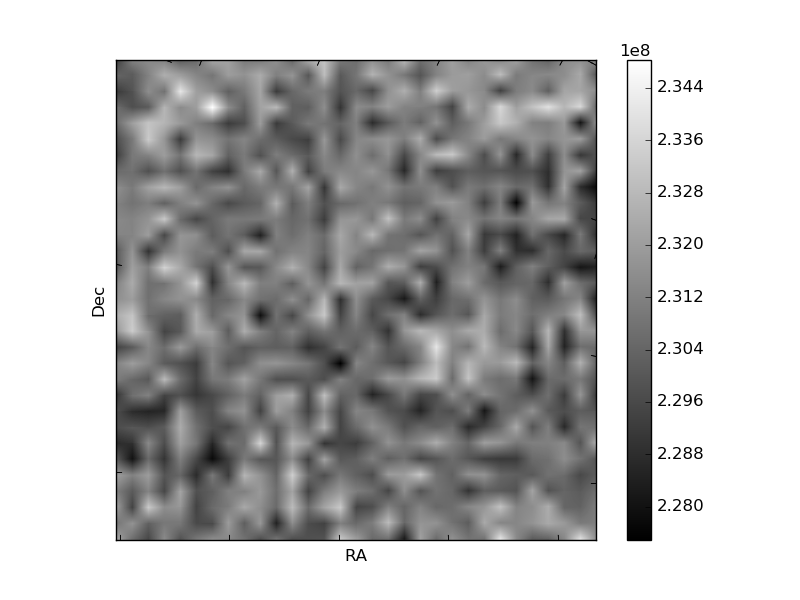
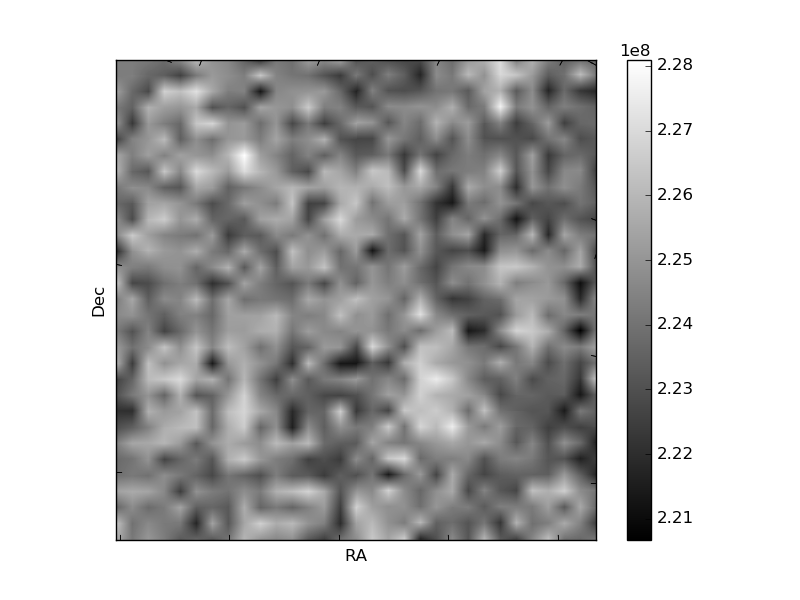
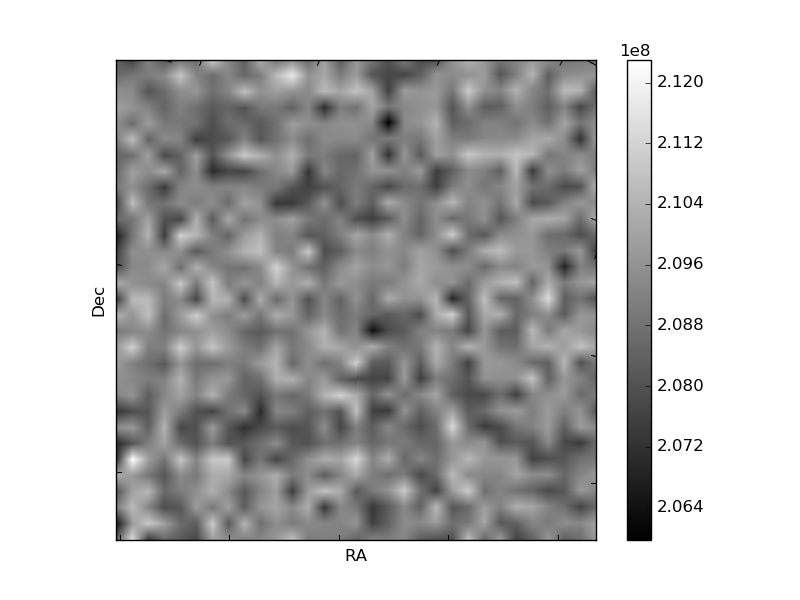
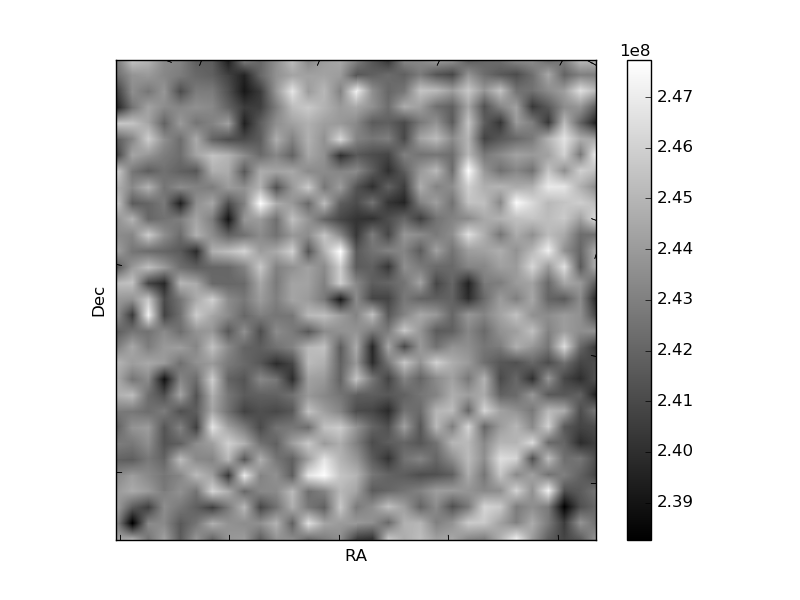
Histogram calculated using DETX and DETY for each event in the final _common_clean file
| Quadrant A | 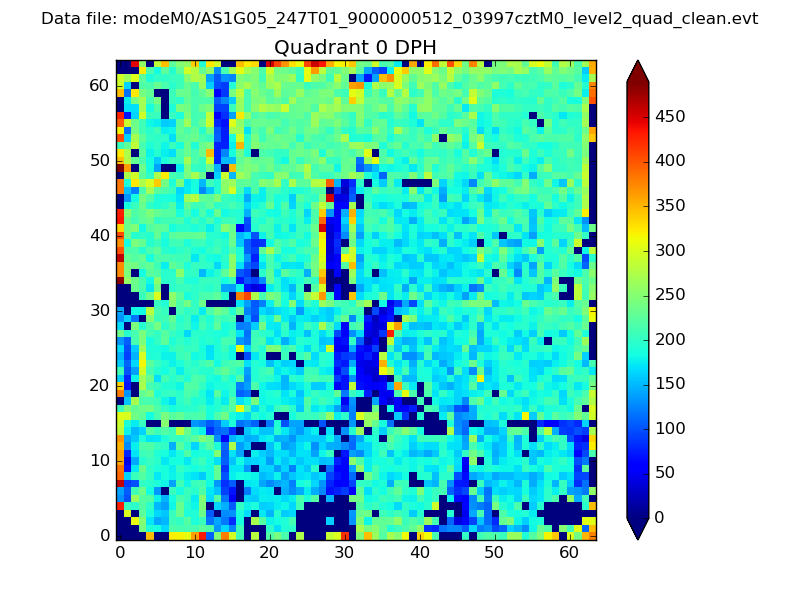 |
 |
Quadrant B |
|---|---|---|---|
| Quadrant D | 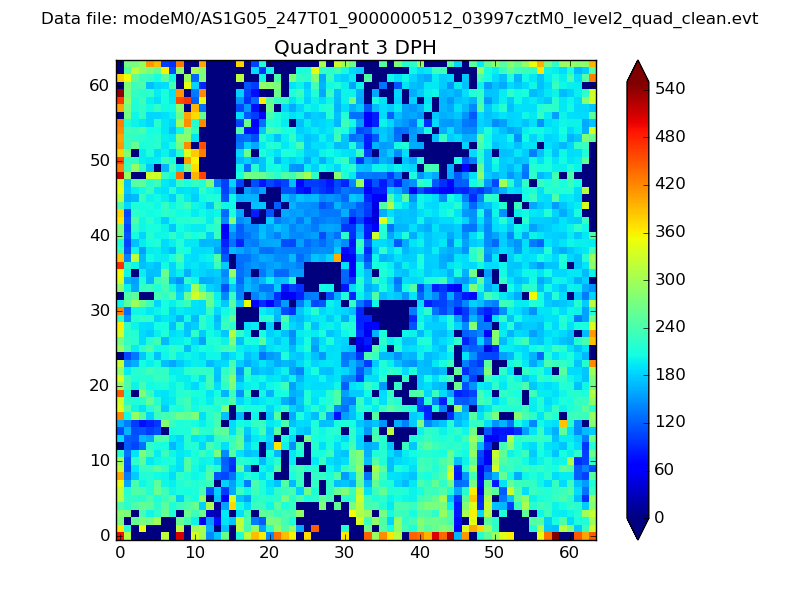 |
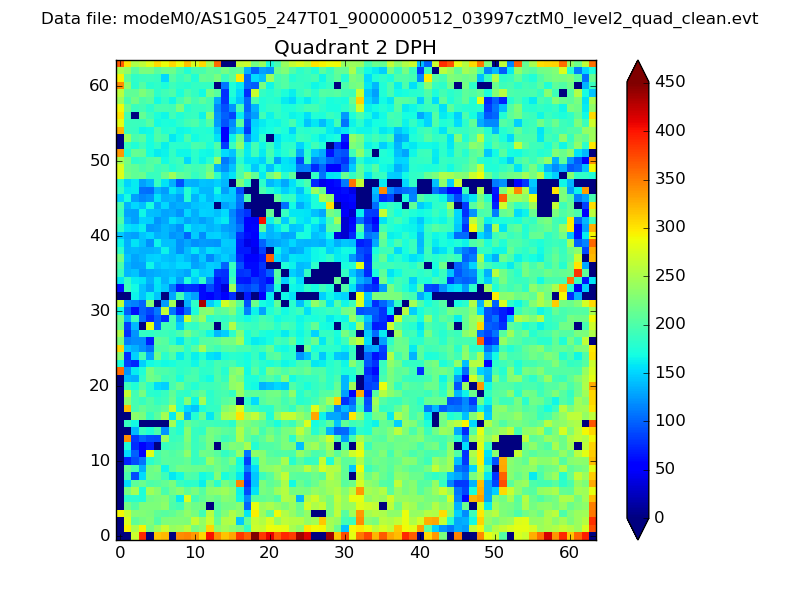 |
Quadrant C |
| Plot type | Count rate plots | Images |
|---|---|---|
| Comparison with Poisson distribution Blue bars denote a histogram of data divided into 1 sec bins. Red curve is a Poisson curve with rate = median count rate of data. |
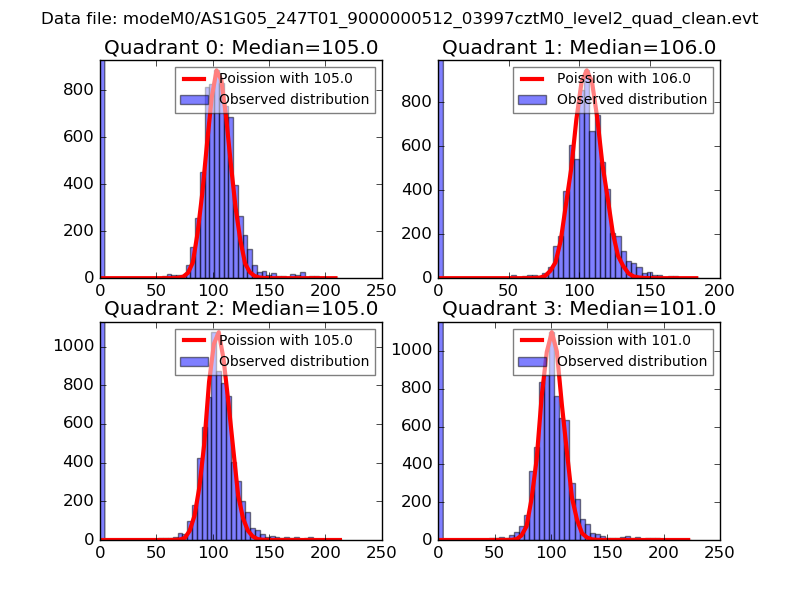 |
 |
| Quadrant-wise count rates Data is divided into 100 sec bins |
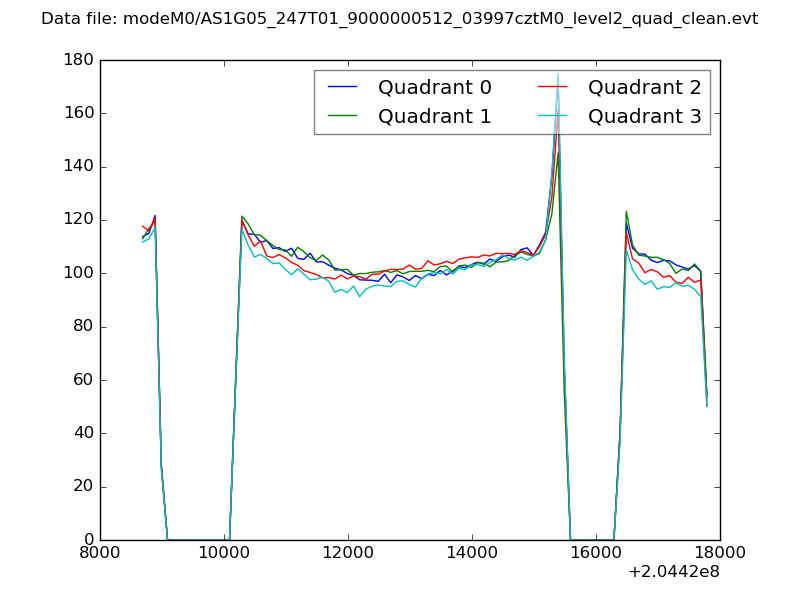 |
|
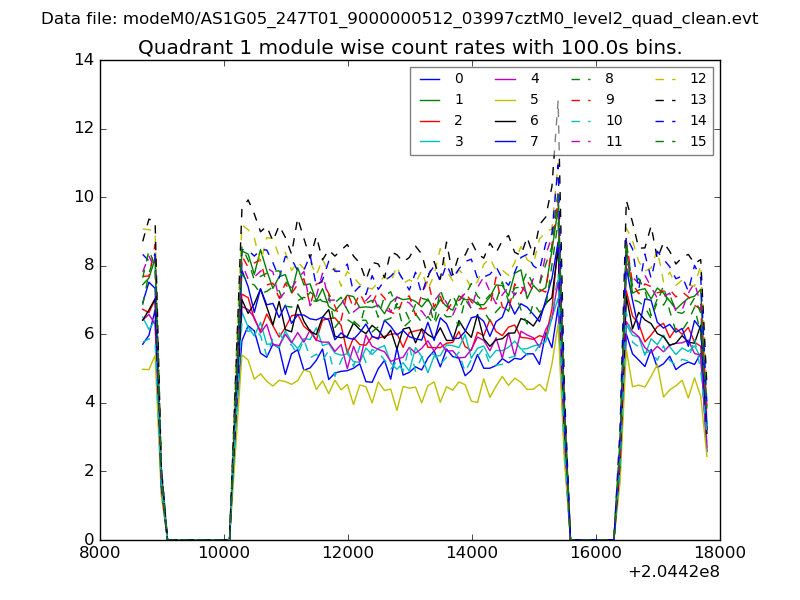
| Module-wise count rates for Quadrant A Data is divided into 100 sec bins |
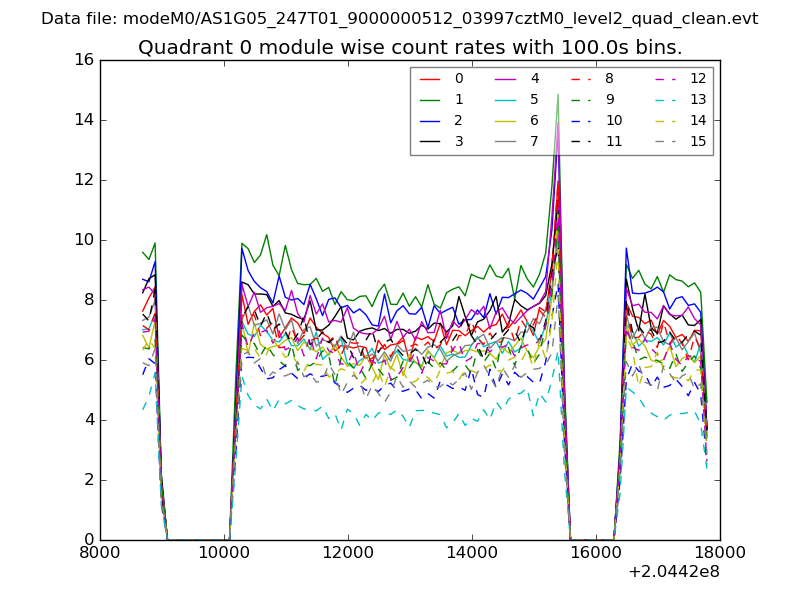 |
 |
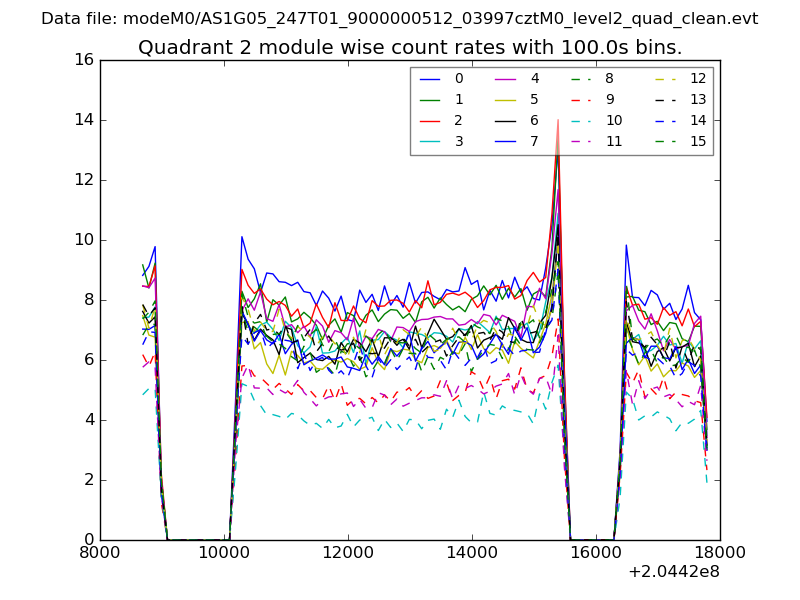
| Module-wise count rates for Quadrant B Data is divided into 100 sec bins |
 |
 |
| Module-wise count rates for Quadrant C Data is divided into 100 sec bins |
 |
 |
| Module-wise count rates for Quadrant D Data is divided into 100 sec bins |
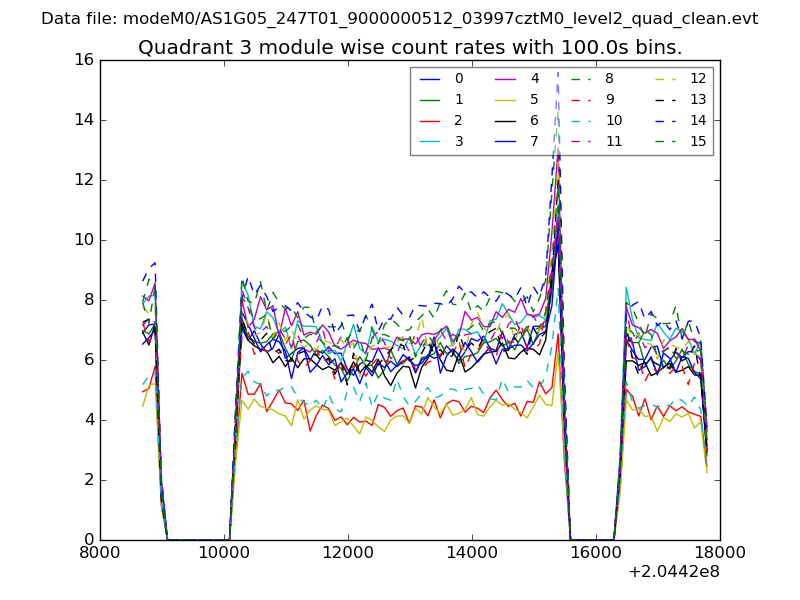 |
 |
| Parameter | Plot |
|---|---|
| CZT HV Monitor | 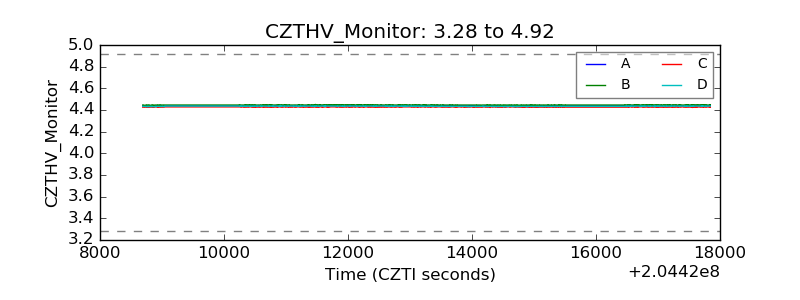 |
| D_VDD | 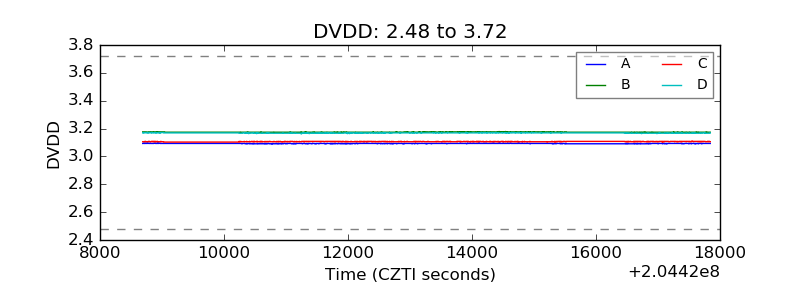 |
| Temperature 1 |  |
| Veto HV Monitor | 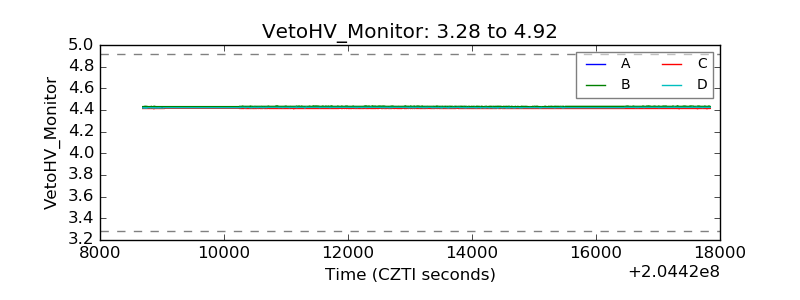 |
| Veto LLD | 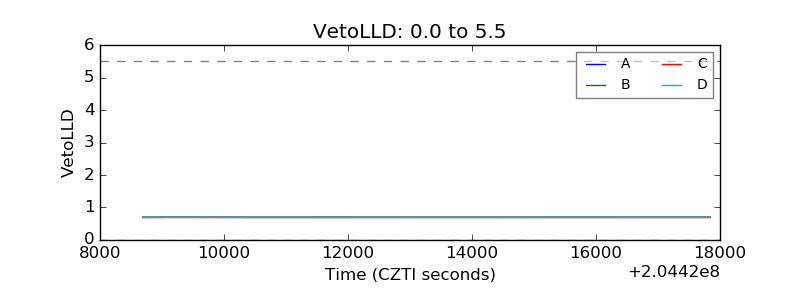 |
| Alpha Counter | 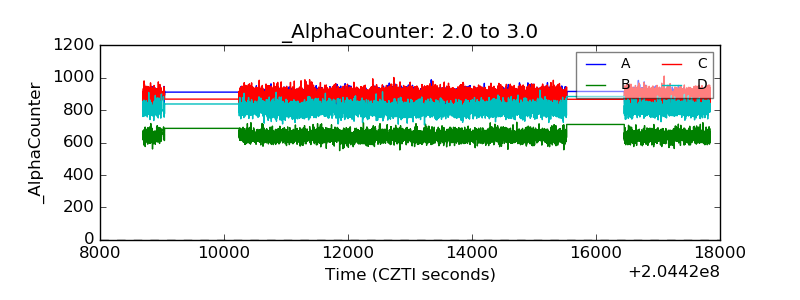 |
| _CPM_Rate | 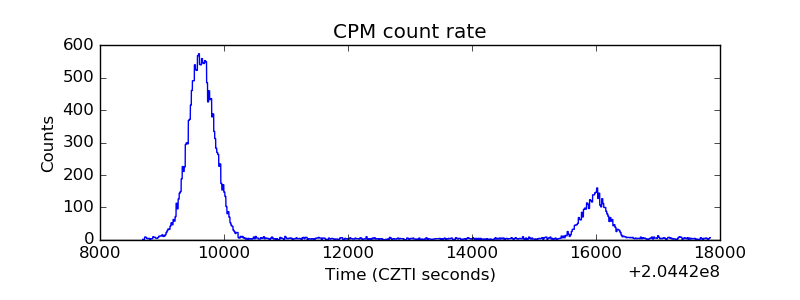 |
| CZT Counter | 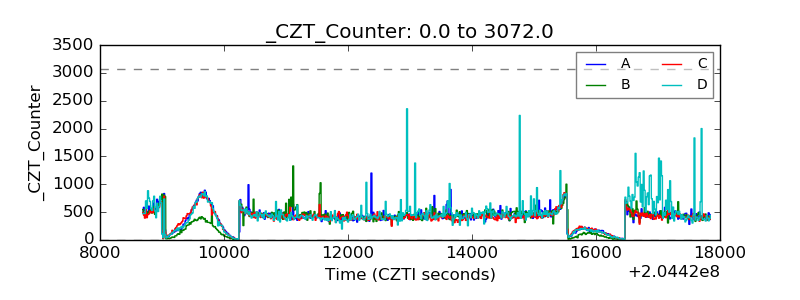 |
| +2.5 Volts monitor |  |
| +5 Volts monitor |  |
| _ROLL_ROT | 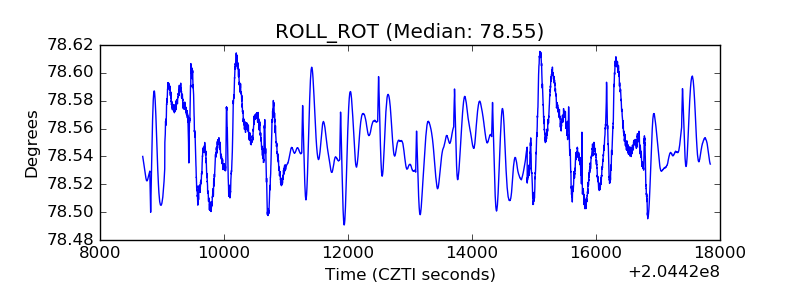 |
| _Roll_DEC | 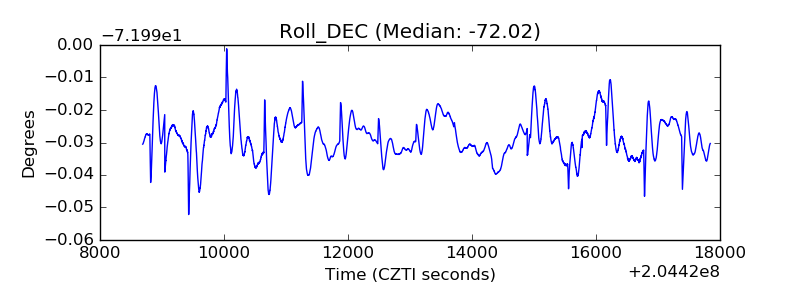 |
| _Roll_RA | 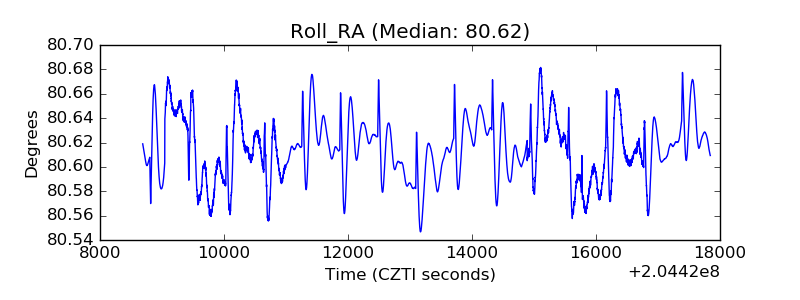 |
| Veto Counter | 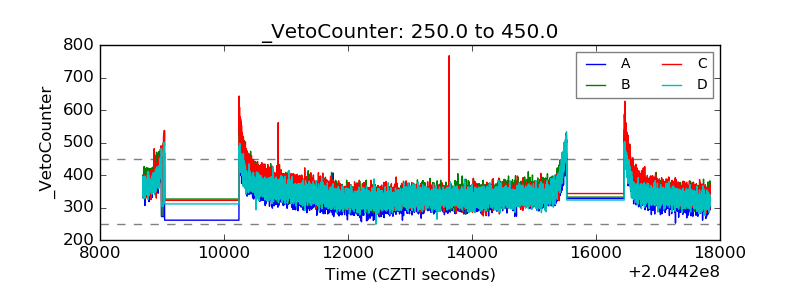 |