| Param | Original file | Final file |
|---|---|---|
| Filename | modeM0/AS1G05_247T01_9000000512_03998cztM0_level2.evt | modeM0/AS1G05_247T01_9000000512_03998cztM0_level2_quad_clean.evt |
| Size (bytes) | 532,702,080 | 121,429,440 |
| Size | 508.0 MB | 115.8 MB |
| Events in quadrant A | 3,615,759 | 796,746 |
| Events in quadrant B | 3,636,493 | 795,371 |
| Events in quadrant C | 3,330,871 | 790,772 |
| Events in quadrant D | 5,030,373 | 762,626 |
| Mode SS | |||
|---|---|---|---|
| Quadrant | BADHDUFLAG | Total packets | Discarded packets |
| A | 0 | 154 | 0 |
| B | 0 | 154 | 0 |
| C | 0 | 154 | 0 |
| D | 0 | 154 | 0 |
| Mode M9 | |||
|---|---|---|---|
| Quadrant | BADHDUFLAG | Total packets | Discarded packets |
| A | 0 | 15 | 0 |
| B | 0 | 15 | 0 |
| C | 0 | 15 | 0 |
| D | 0 | 15 | 0 |
| Mode M0 | |||
|---|---|---|---|
| Quadrant | BADHDUFLAG | Total packets | Discarded packets |
| A | 0 | 16183 | 3 |
| B | 0 | 15944 | 2 |
| C | 0 | 15656 | 2 |
| D | 0 | 20464 | 2 |
| Quadrant | Total seconds | Saturated seconds | Saturation percentage |
|---|---|---|---|
| A | 7656 | 161 | 2.102926% |
| B | 7656 | 135 | 1.763323% |
| C | 7656 | 134 | 1.750261% |
| D | 7656 | 323 | 4.218913% |
Noise dominated data is calculated using 1-second bins in cleaned event files. If a bin has >2000 counts, and if more than 50% of those come from <1% of pixels, then it is considered to be noise-dominated and hence unusable.
| Quadrant | # 1 sec bins | Bins with >0 counts | Bins with >2000 counts | High rate bins dominated by noise | Noise dominated (total time) | Noise dominated (detector-on time) | Marked lightcurve |
|---|---|---|---|---|---|---|---|
| A | 9091 | 7658 | 42 | 42 | 0.46% | 0.55% |  |
| B | 9091 | 7658 | 0 | 0 | 0.00% | 0.00% | 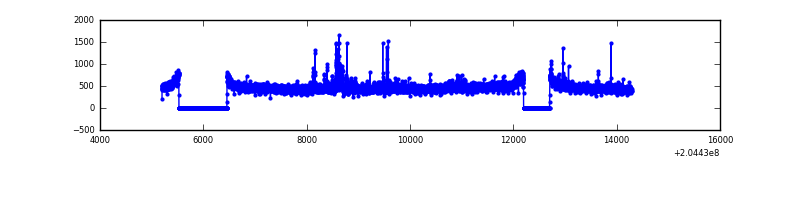 |
| C | 9091 | 7658 | 1 | 1 | 0.01% | 0.01% |  |
| D | 9091 | 7658 | 171 | 171 | 1.88% | 2.23% | 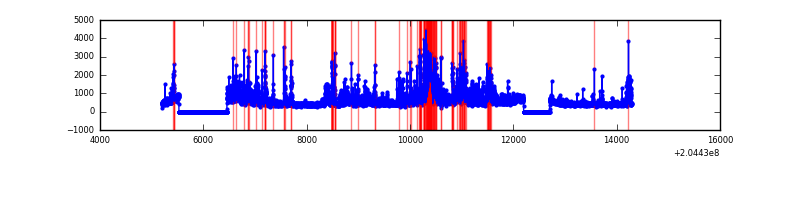 |
Top three noisy pixels from each quadrant. If the there are fewer than three noisy pixels in the level2.evt file, extra rows are filled as -1
| Pixel properties | Quadrant properties | ||||||
|---|---|---|---|---|---|---|---|
| Quadrant | DetID | PixID | Counts | Sigma | Mean | Median | Sigma |
| A | 0 | 50 | 131229 | 738.5 | 862 | 838 | 176.6 |
| A | 8 | 15 | 76241 | 427.06 | 862 | 838 | 176.6 |
| A | 0 | 118 | 47740 | 265.64 | 862 | 838 | 176.6 |
| B | 4 | 81 | 104773 | 625.02 | 873 | 851 | 166.3 |
| B | 3 | 0 | 101268 | 603.94 | 873 | 851 | 166.3 |
| B | 15 | 204 | 21010 | 121.24 | 873 | 851 | 166.3 |
| C | 8 | 128 | 8587 | 39.46 | 847 | 847 | 196.1 |
| C | 13 | 61 | 7255 | 32.67 | 847 | 847 | 196.1 |
| C | 9 | 144 | 4265 | 17.43 | 847 | 847 | 196.1 |
| D | 2 | 63 | 1358237 | 6733.04 | 837 | 812 | 201.6 |
| D | 13 | 239 | 175662 | 867.28 | 837 | 812 | 201.6 |
| D | 2 | 232 | 94668 | 465.54 | 837 | 812 | 201.6 |
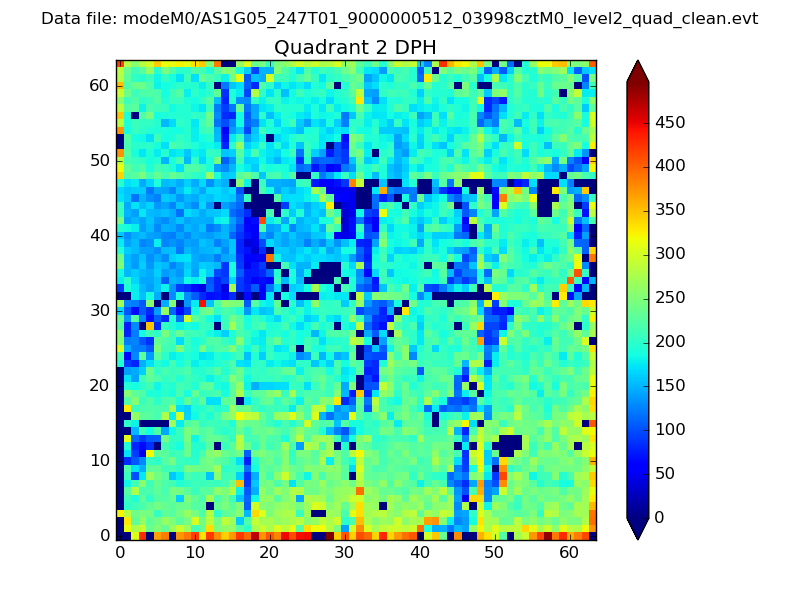
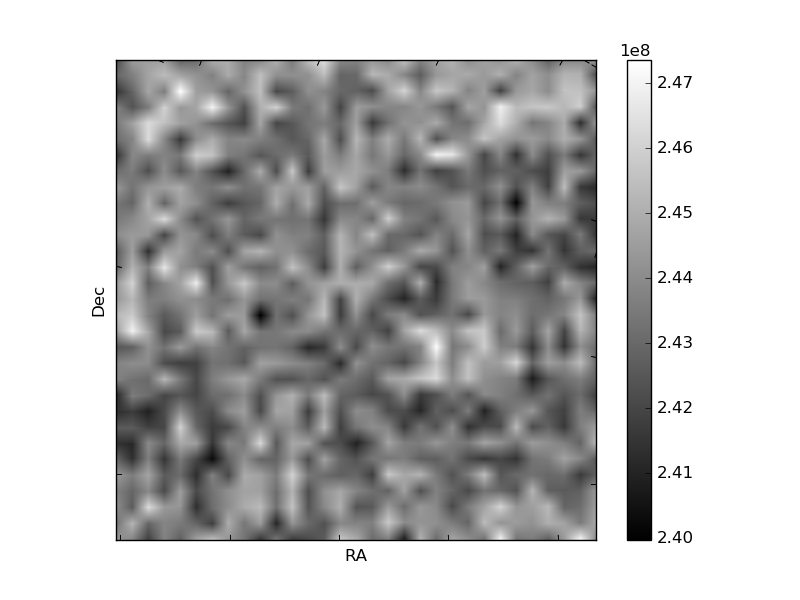
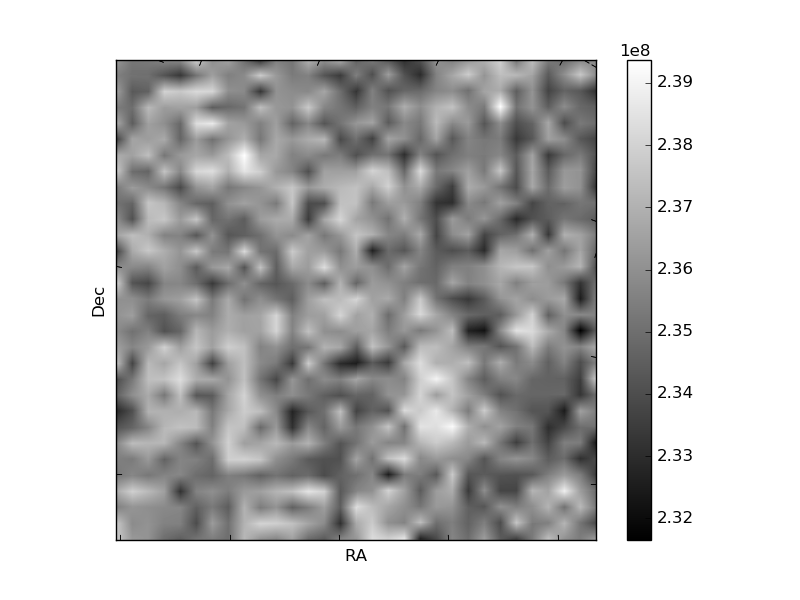
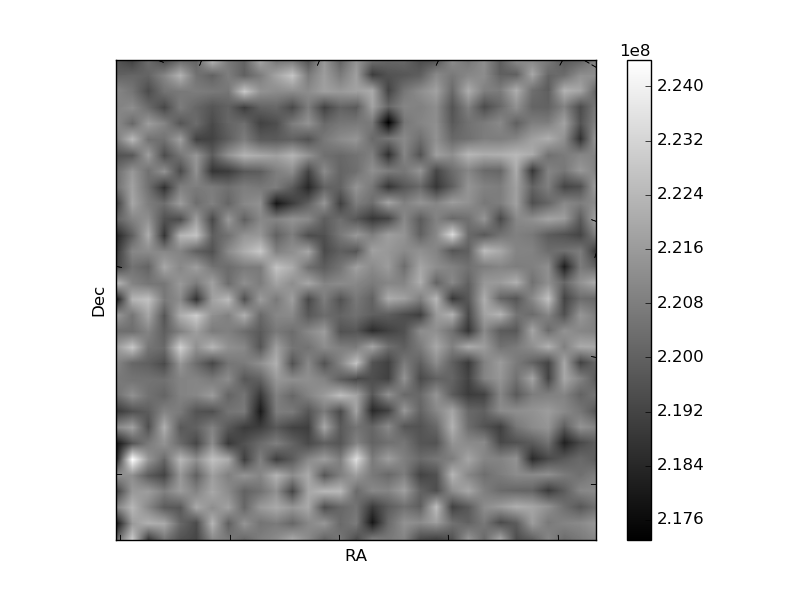
Histogram calculated using DETX and DETY for each event in the final _common_clean file
| Quadrant A | 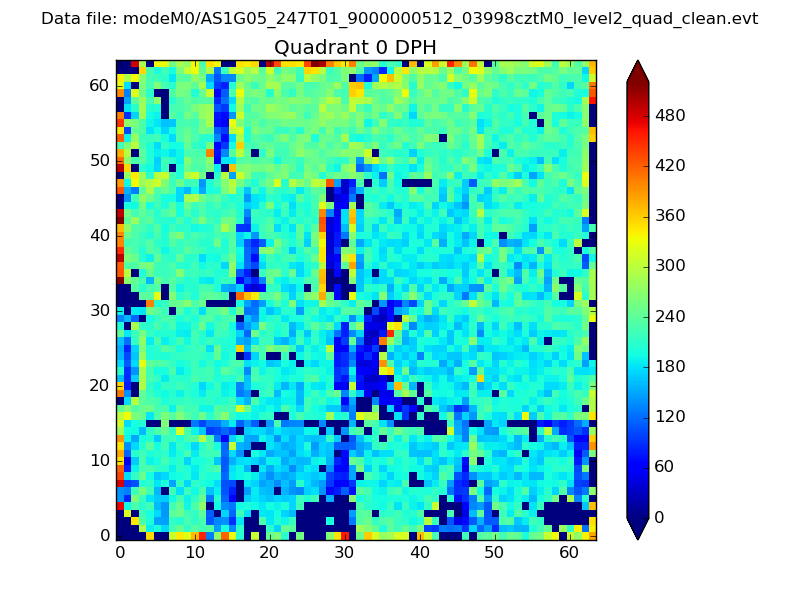 |
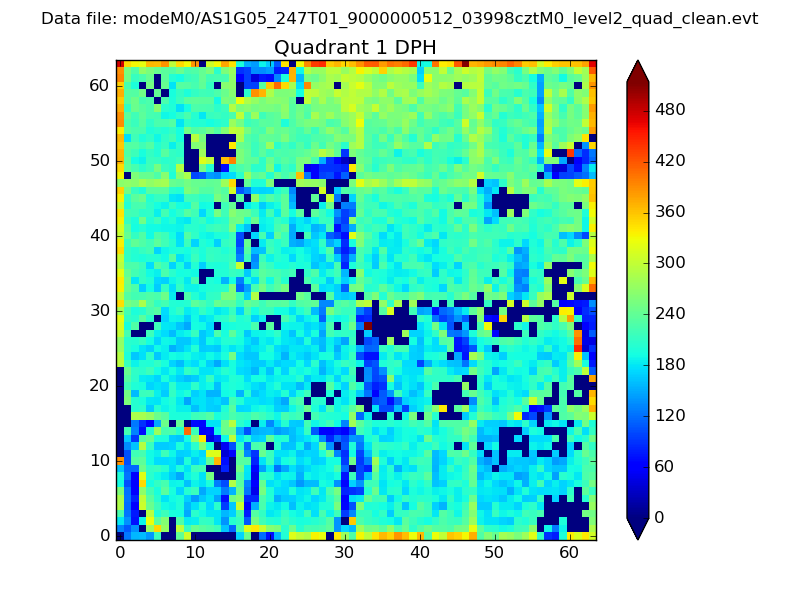 |
Quadrant B |
|---|---|---|---|
| Quadrant D | 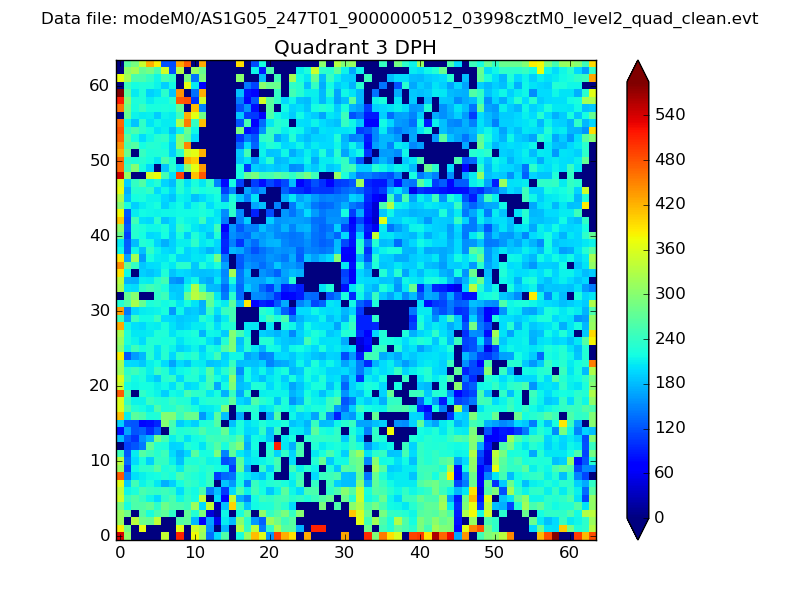 |
 |
Quadrant C |
| Plot type | Count rate plots | Images |
|---|---|---|
| Comparison with Poisson distribution Blue bars denote a histogram of data divided into 1 sec bins. Red curve is a Poisson curve with rate = median count rate of data. |
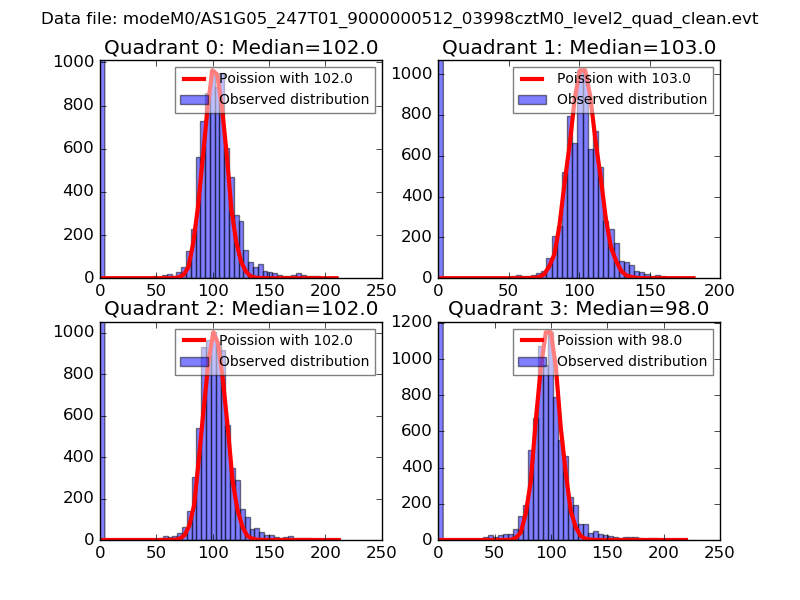 |
 |
| Quadrant-wise count rates Data is divided into 100 sec bins |
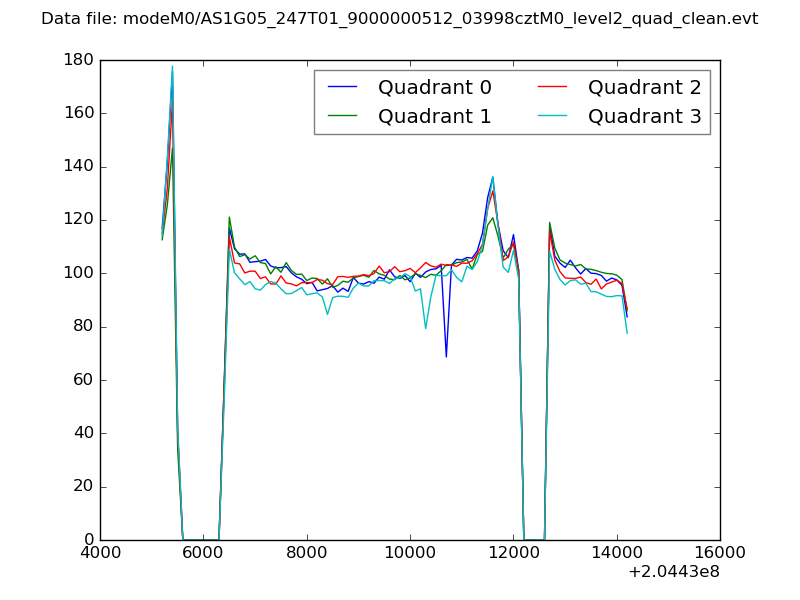 |
|
| Module-wise count rates for Quadrant A Data is divided into 100 sec bins |
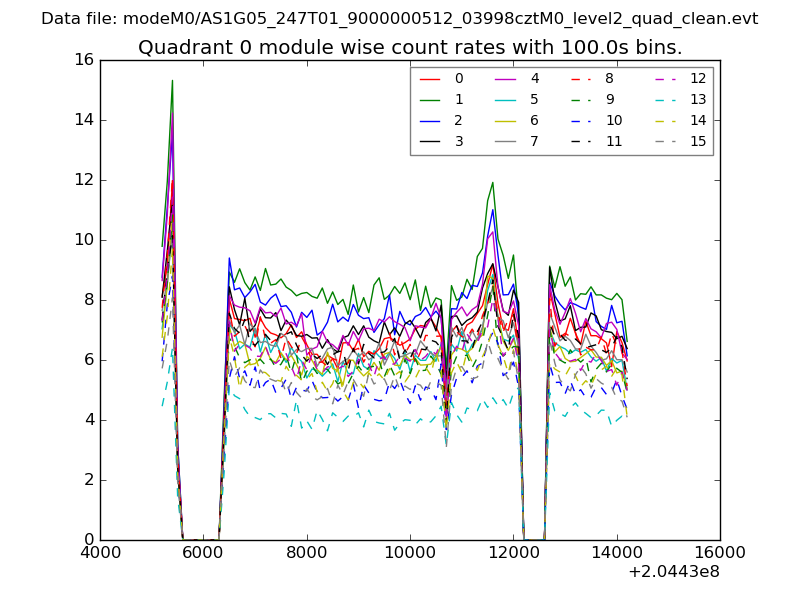 |
 |
| Module-wise count rates for Quadrant B Data is divided into 100 sec bins |
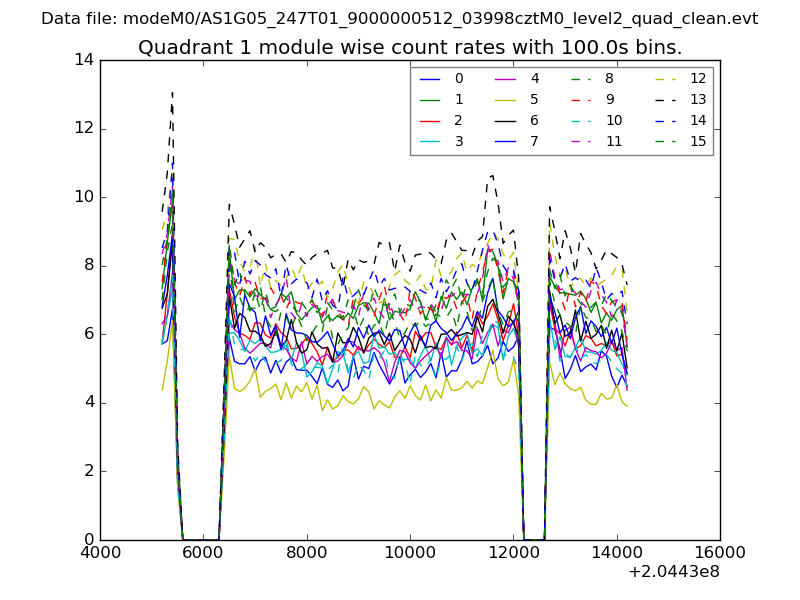 |
 |
| Module-wise count rates for Quadrant C Data is divided into 100 sec bins |
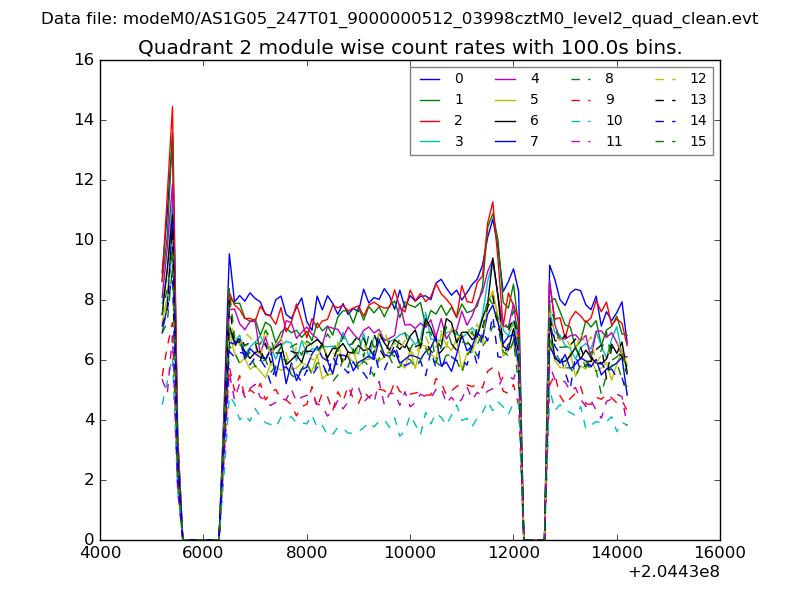 |
 |
| Module-wise count rates for Quadrant D Data is divided into 100 sec bins |
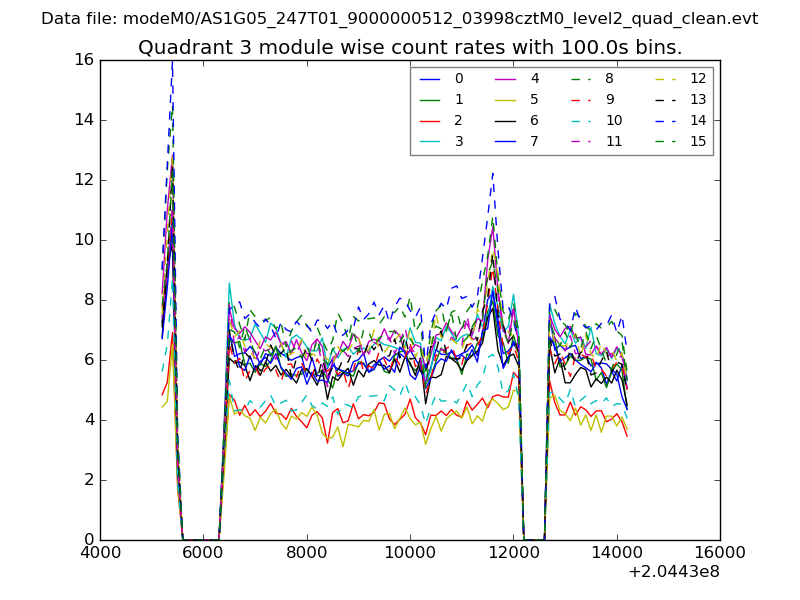 |
 |
| Parameter | Plot |
|---|---|
| CZT HV Monitor | 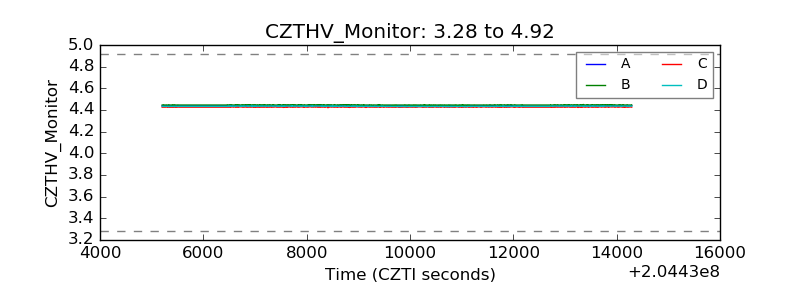 |
| D_VDD | 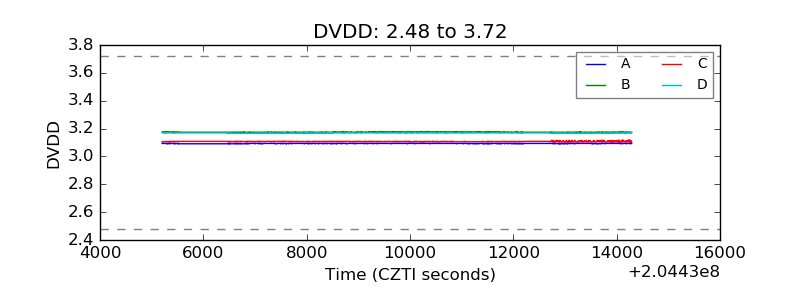 |
| Temperature 1 | 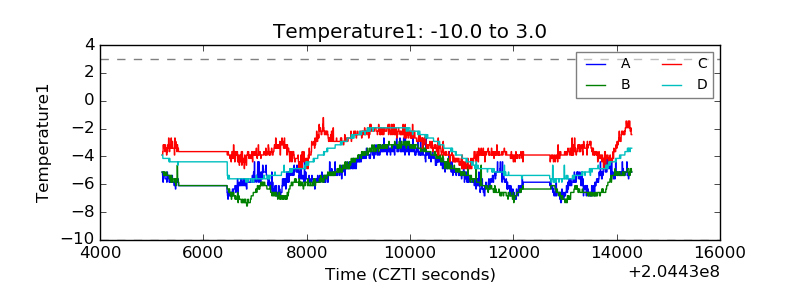 |
| Veto HV Monitor | 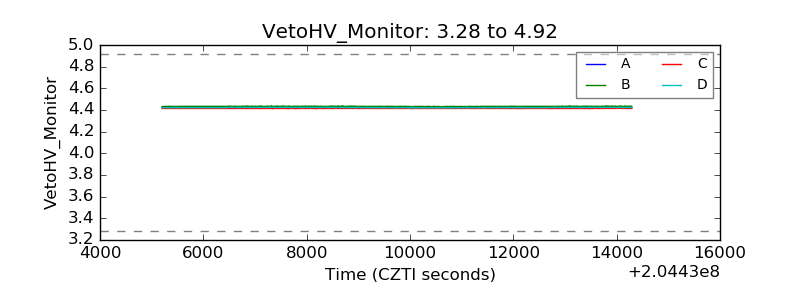 |
| Veto LLD | 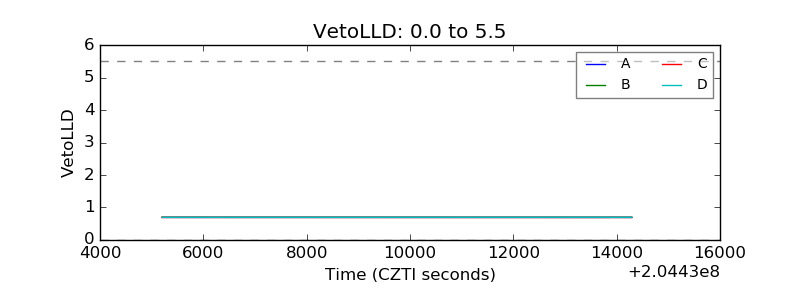 |
| Alpha Counter | 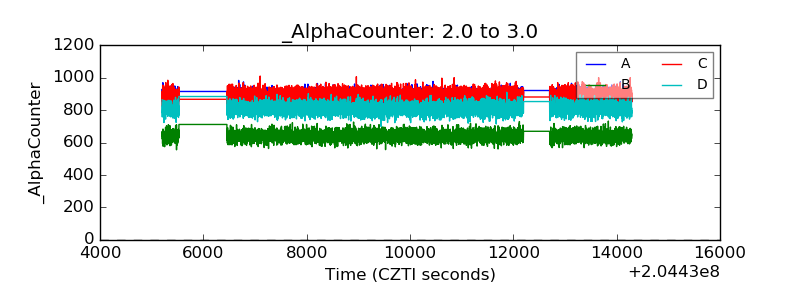 |
| _CPM_Rate | 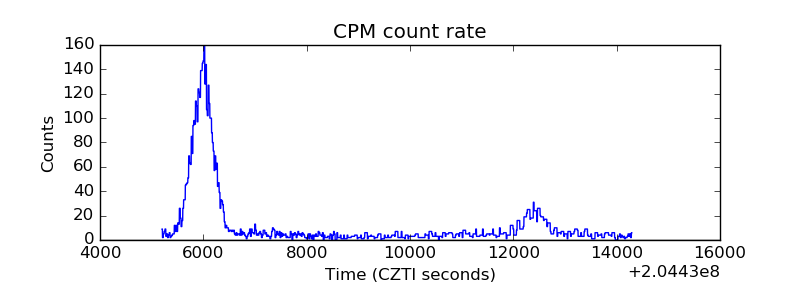 |
| CZT Counter |  |
| +2.5 Volts monitor |  |
| +5 Volts monitor |  |
| _ROLL_ROT | 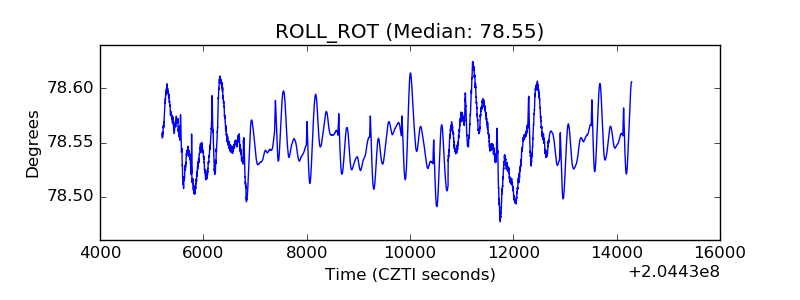 |
| _Roll_DEC |  |
| _Roll_RA | 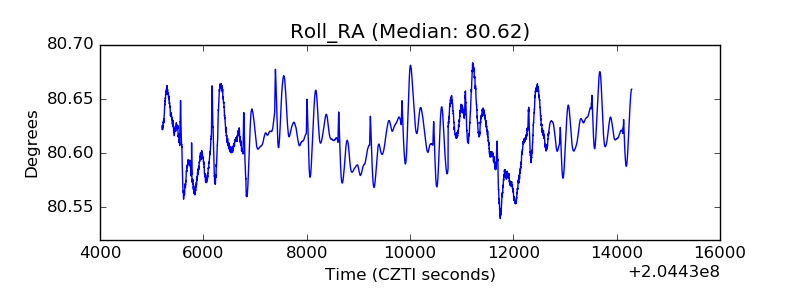 |
| Veto Counter | 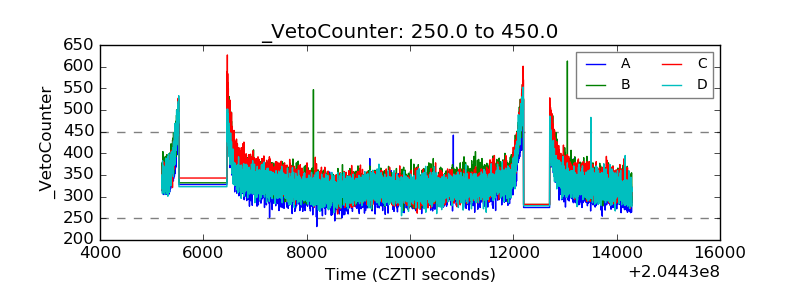 |