| Param | Original file | Final file |
|---|---|---|
| Filename | modeM0/AS1G05_247T01_9000000512_03999cztM0_level2.evt | modeM0/AS1G05_247T01_9000000512_03999cztM0_level2_quad_clean.evt |
| Size (bytes) | 560,669,760 | 110,649,600 |
| Size | 534.7 MB | 105.5 MB |
| Events in quadrant A | 3,488,848 | 727,491 |
| Events in quadrant B | 3,459,773 | 732,280 |
| Events in quadrant C | 3,157,099 | 728,234 |
| Events in quadrant D | 6,382,996 | 659,127 |
| Mode SS | |||
|---|---|---|---|
| Quadrant | BADHDUFLAG | Total packets | Discarded packets |
| A | 0 | 144 | 0 |
| B | 0 | 144 | 0 |
| C | 0 | 144 | 0 |
| D | 0 | 144 | 0 |
| Mode M0 | |||
|---|---|---|---|
| Quadrant | BADHDUFLAG | Total packets | Discarded packets |
| A | 0 | 15556 | 1 |
| B | 0 | 15217 | 0 |
| C | 0 | 14851 | 0 |
| D | 0 | 24264 | 0 |
| Quadrant | Total seconds | Saturated seconds | Saturation percentage |
|---|---|---|---|
| A | 7231 | 246 | 3.402019% |
| B | 7231 | 181 | 2.503112% |
| C | 7231 | 104 | 1.438252% |
| D | 7231 | 1286 | 17.784539% |
Noise dominated data is calculated using 1-second bins in cleaned event files. If a bin has >2000 counts, and if more than 50% of those come from <1% of pixels, then it is considered to be noise-dominated and hence unusable.
| Quadrant | # 1 sec bins | Bins with >0 counts | Bins with >2000 counts | High rate bins dominated by noise | Noise dominated (total time) | Noise dominated (detector-on time) | Marked lightcurve |
|---|---|---|---|---|---|---|---|
| A | 7231 | 7231 | 20 | 20 | 0.28% | 0.28% | 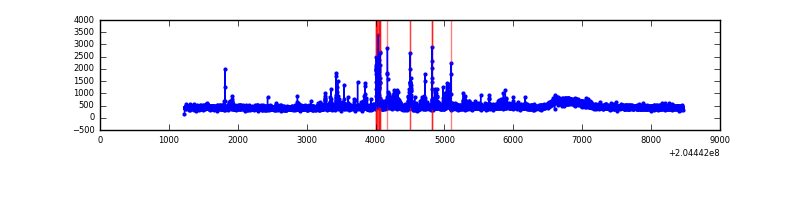 |
| B | 7231 | 7231 | 2 | 2 | 0.03% | 0.03% | 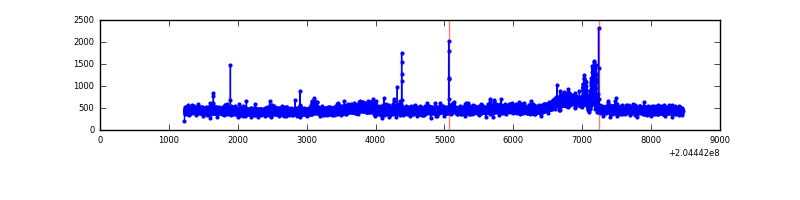 |
| C | 7231 | 7231 | 0 | 0 | 0.00% | 0.00% | 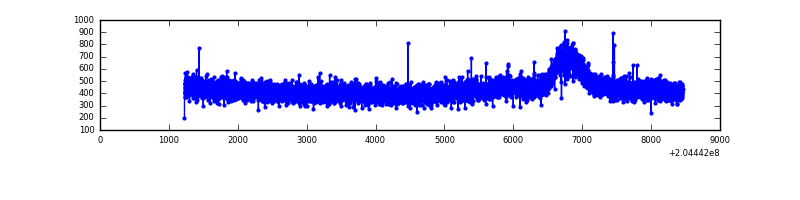 |
| D | 7231 | 7231 | 983 | 983 | 13.59% | 13.59% | 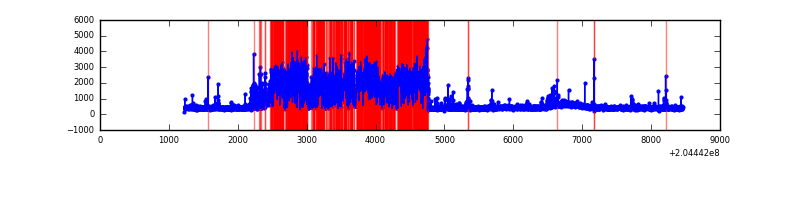 |
Top three noisy pixels from each quadrant. If the there are fewer than three noisy pixels in the level2.evt file, extra rows are filled as -1
| Pixel properties | Quadrant properties | ||||||
|---|---|---|---|---|---|---|---|
| Quadrant | DetID | PixID | Counts | Sigma | Mean | Median | Sigma |
| A | 0 | 50 | 136796 | 813.59 | 809 | 788 | 167.2 |
| A | 13 | 251 | 123065 | 731.45 | 809 | 788 | 167.2 |
| A | 0 | 118 | 53536 | 315.53 | 809 | 788 | 167.2 |
| B | 3 | 0 | 106178 | 663.81 | 821 | 799 | 158.7 |
| B | 15 | 204 | 77327 | 482.07 | 821 | 799 | 158.7 |
| B | 4 | 81 | 76479 | 476.73 | 821 | 799 | 158.7 |
| C | 8 | 128 | 23293 | 121.6 | 797 | 798 | 185.0 |
| C | 8 | 144 | 9104 | 44.9 | 797 | 798 | 185.0 |
| C | 8 | 112 | 8992 | 44.3 | 797 | 798 | 185.0 |
| D | 2 | 63 | 3213512 | 17436.76 | 759 | 735 | 184.3 |
| D | 2 | 232 | 105458 | 568.37 | 759 | 735 | 184.3 |
| D | 13 | 239 | 57153 | 306.2 | 759 | 735 | 184.3 |
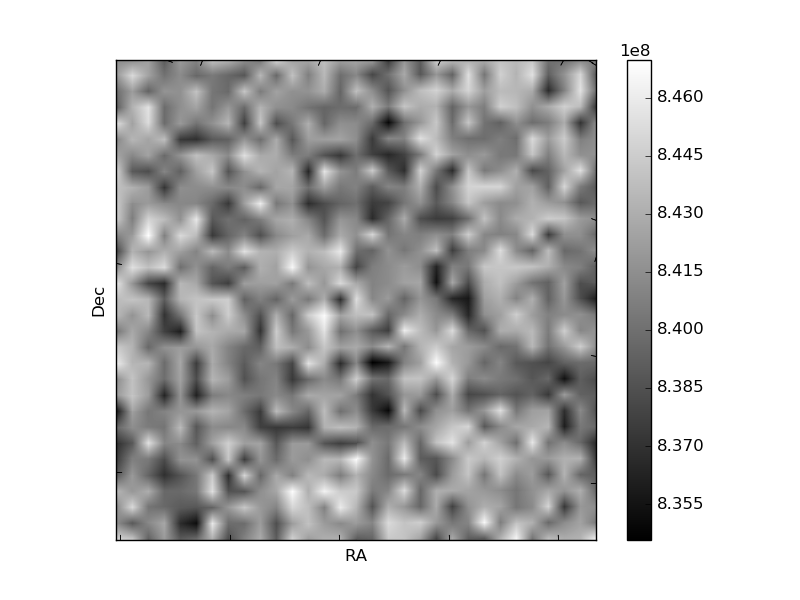
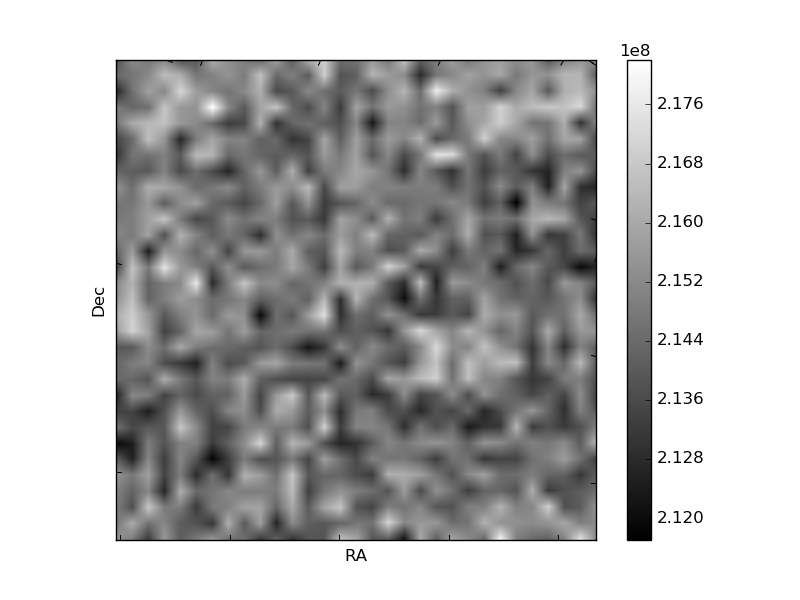
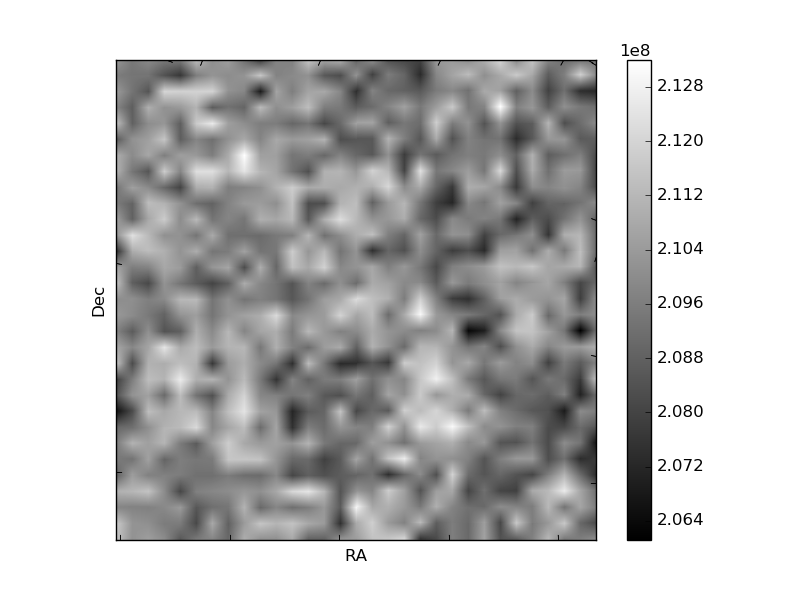
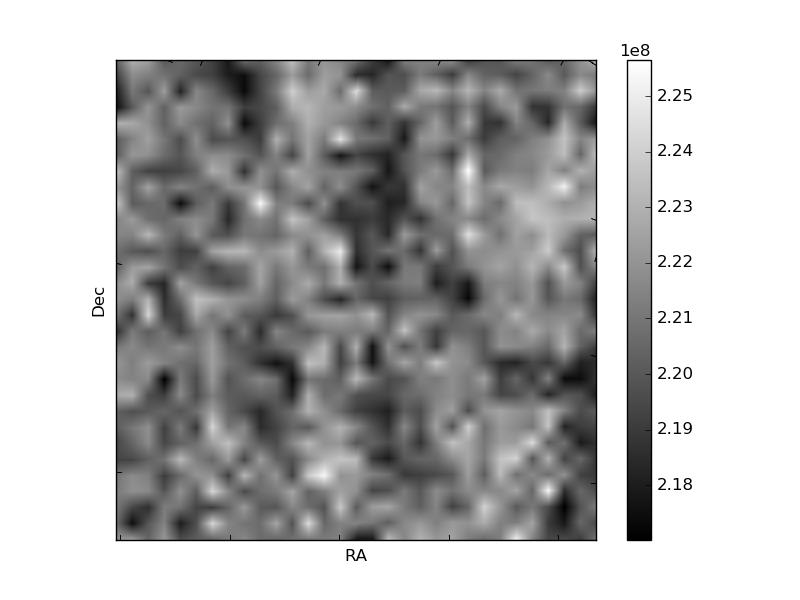
Histogram calculated using DETX and DETY for each event in the final _common_clean file
| Quadrant A |  |
 |
Quadrant B |
|---|---|---|---|
| Quadrant D |  |
 |
Quadrant C |
| Plot type | Count rate plots | Images |
|---|---|---|
| Comparison with Poisson distribution Blue bars denote a histogram of data divided into 1 sec bins. Red curve is a Poisson curve with rate = median count rate of data. |
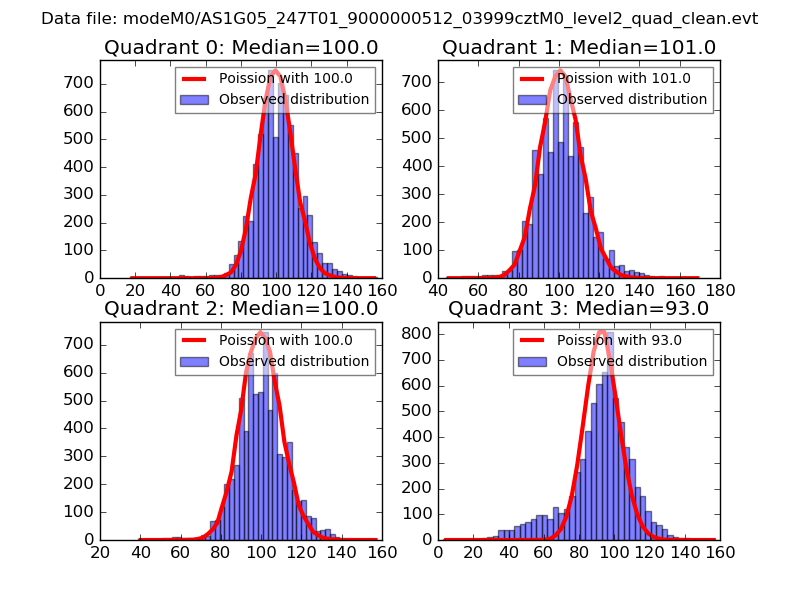 |
 |
| Quadrant-wise count rates Data is divided into 100 sec bins |
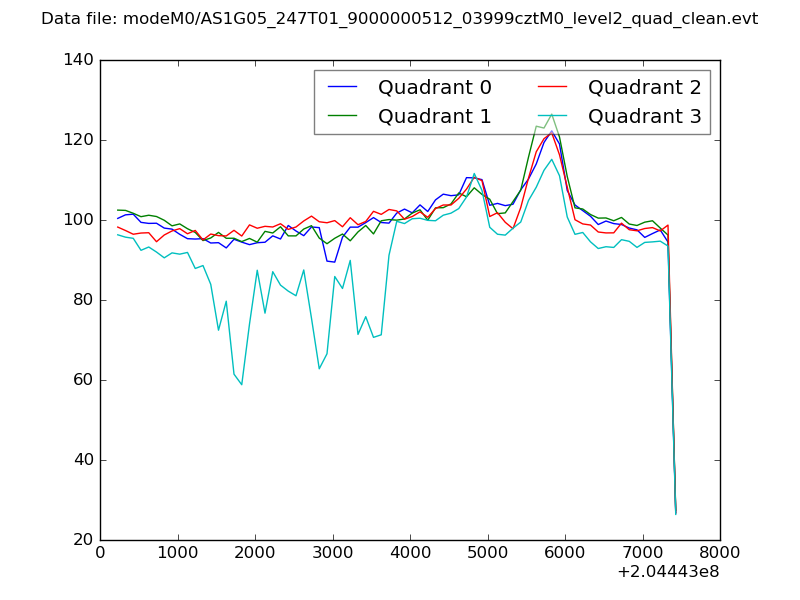 |
|
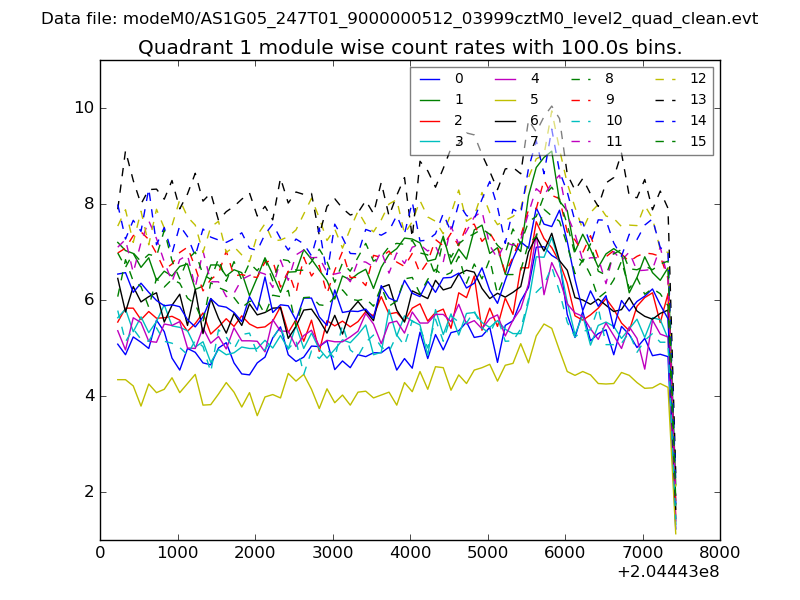
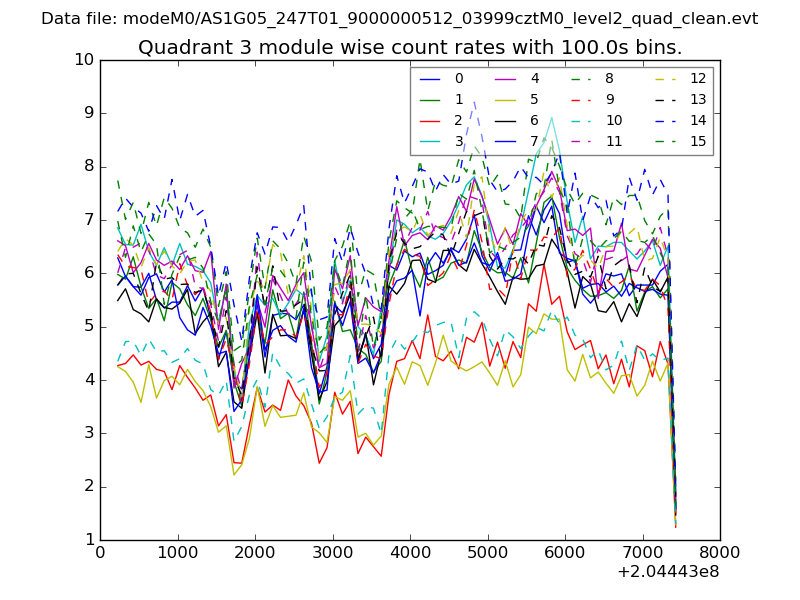
| Module-wise count rates for Quadrant A Data is divided into 100 sec bins |
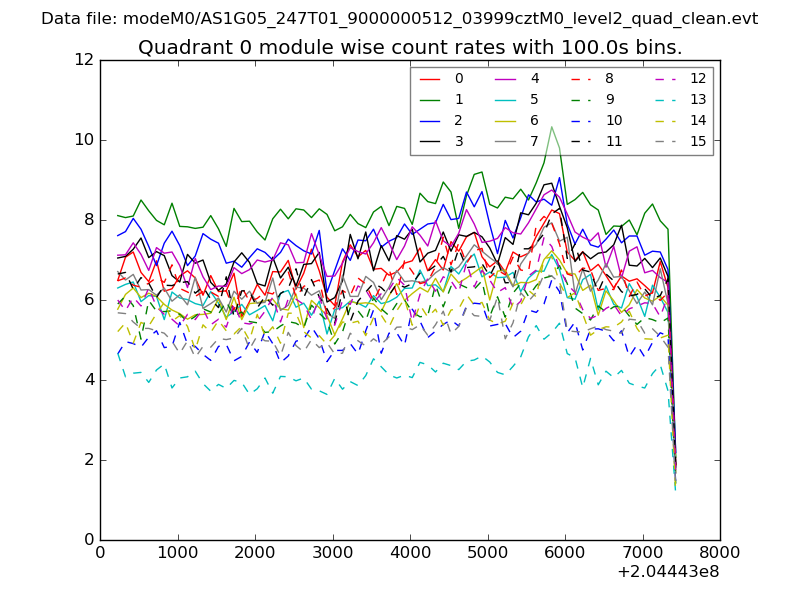 |
 |
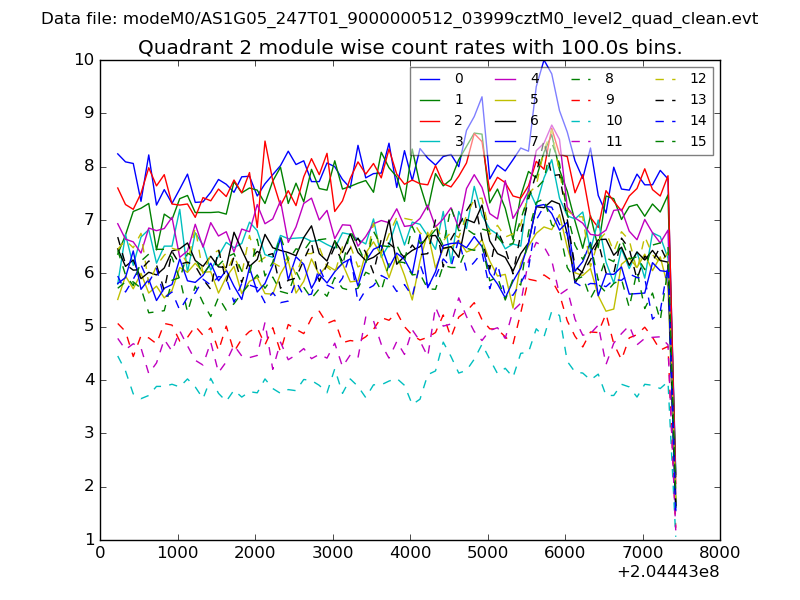
| Module-wise count rates for Quadrant B Data is divided into 100 sec bins |
 |
 |
| Module-wise count rates for Quadrant C Data is divided into 100 sec bins |
 |
 |
| Module-wise count rates for Quadrant D Data is divided into 100 sec bins |
 |
 |
| Parameter | Plot |
|---|---|
| CZT HV Monitor | 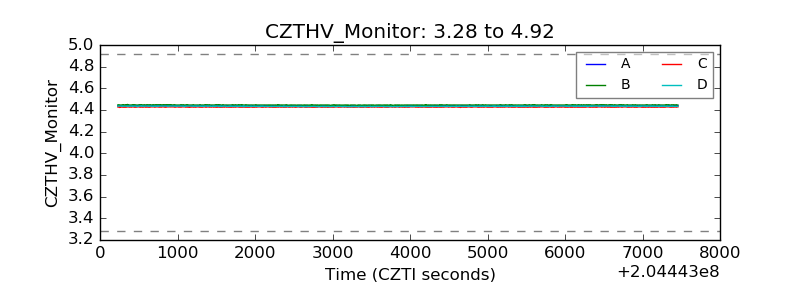 |
| D_VDD | 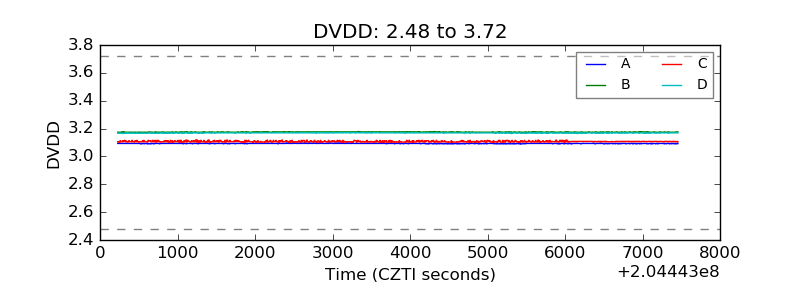 |
| Temperature 1 | 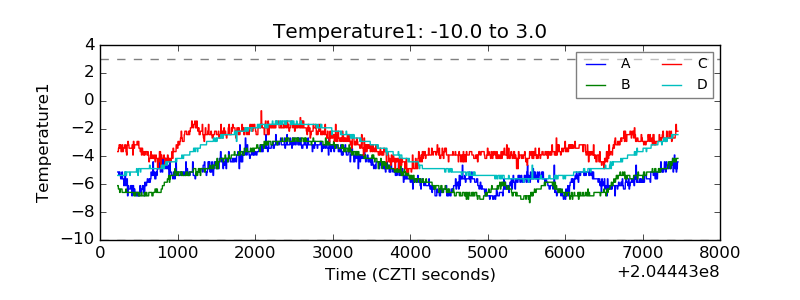 |
| Veto HV Monitor | 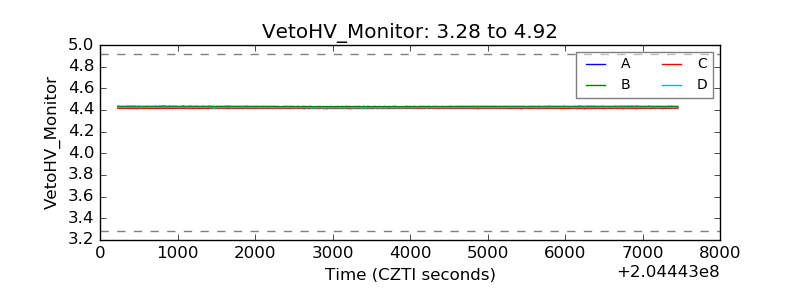 |
| Veto LLD | 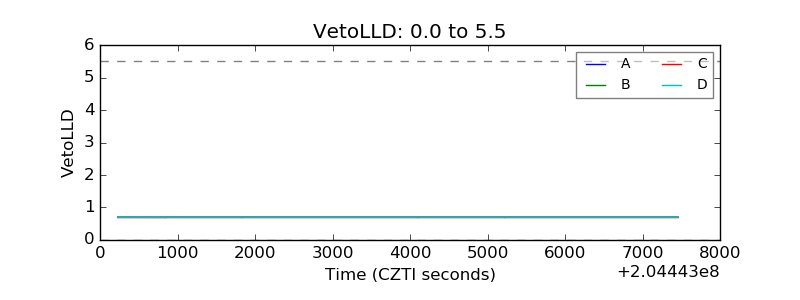 |
| Alpha Counter | 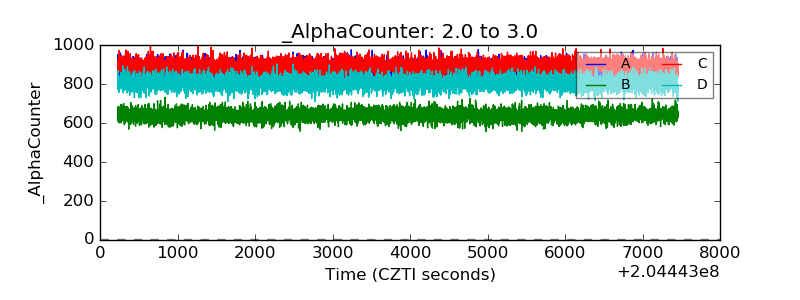 |
| _CPM_Rate | 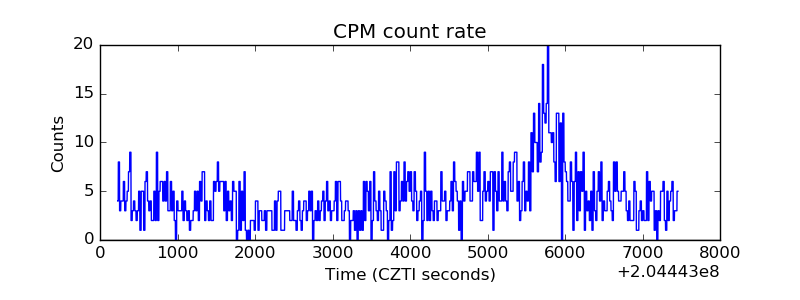 |
| CZT Counter |  |
| +2.5 Volts monitor |  |
| +5 Volts monitor | 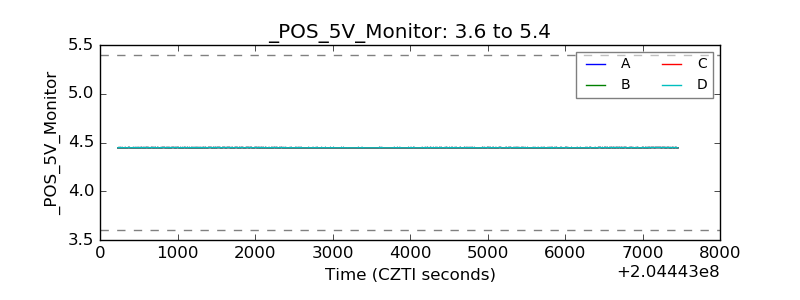 |
| _ROLL_ROT | 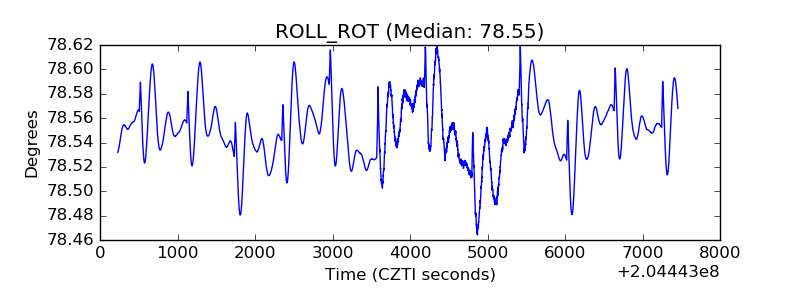 |
| _Roll_DEC | 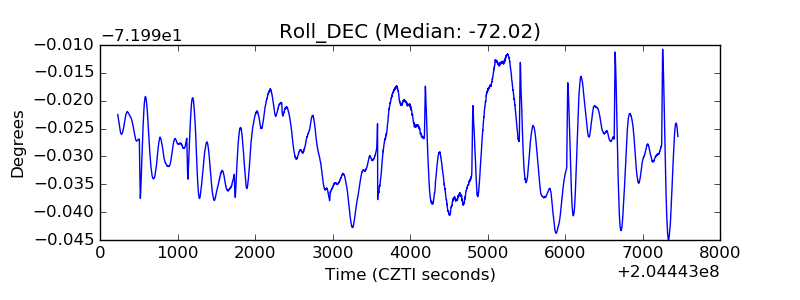 |
| _Roll_RA | 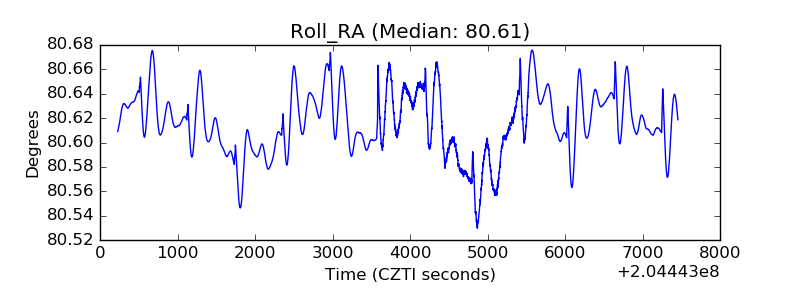 |
| Veto Counter | 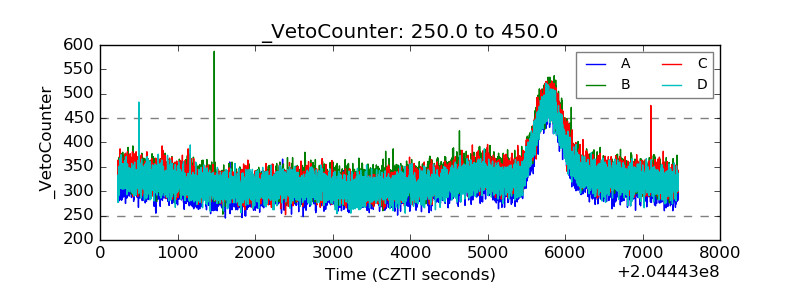 |