| Param | Original file | Final file |
|---|---|---|
| Filename | modeM0/AS1G05_247T01_9000000512_04000cztM0_level2.evt | modeM0/AS1G05_247T01_9000000512_04000cztM0_level2_quad_clean.evt |
| Size (bytes) | 497,157,120 | 118,889,280 |
| Size | 474.1 MB | 113.4 MB |
| Events in quadrant A | 3,760,454 | 767,771 |
| Events in quadrant B | 3,687,697 | 775,136 |
| Events in quadrant C | 3,302,524 | 775,834 |
| Events in quadrant D | 3,779,185 | 743,275 |
| Mode SS | |||
|---|---|---|---|
| Quadrant | BADHDUFLAG | Total packets | Discarded packets |
| A | 0 | 158 | 0 |
| B | 0 | 158 | 0 |
| C | 0 | 158 | 0 |
| D | 0 | 158 | 0 |
| Mode M9 | |||
|---|---|---|---|
| Quadrant | BADHDUFLAG | Total packets | Discarded packets |
| A | 0 | 2 | 0 |
| B | 0 | 2 | 0 |
| C | 0 | 2 | 0 |
| D | 0 | 2 | 0 |
| Mode M0 | |||
|---|---|---|---|
| Quadrant | BADHDUFLAG | Total packets | Discarded packets |
| A | 0 | 16589 | 2 |
| B | 0 | 16131 | 1 |
| C | 0 | 15660 | 1 |
| D | 0 | 17030 | 1 |
| Quadrant | Total seconds | Saturated seconds | Saturation percentage |
|---|---|---|---|
| A | 7742 | 135 | 1.743735% |
| B | 7742 | 75 | 0.968742% |
| C | 7742 | 39 | 0.503746% |
| D | 7742 | 148 | 1.911651% |
Noise dominated data is calculated using 1-second bins in cleaned event files. If a bin has >2000 counts, and if more than 50% of those come from <1% of pixels, then it is considered to be noise-dominated and hence unusable.
| Quadrant | # 1 sec bins | Bins with >0 counts | Bins with >2000 counts | High rate bins dominated by noise | Noise dominated (total time) | Noise dominated (detector-on time) | Marked lightcurve |
|---|---|---|---|---|---|---|---|
| A | 7972 | 7743 | 45 | 45 | 0.56% | 0.58% | 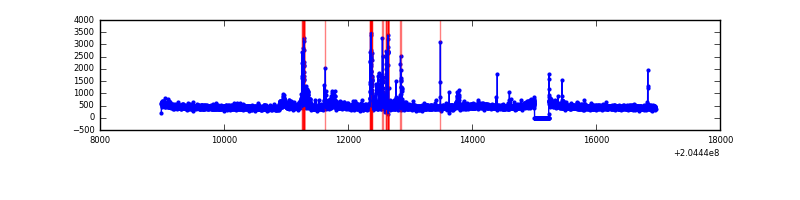 |
| B | 7972 | 7743 | 4 | 4 | 0.05% | 0.05% | 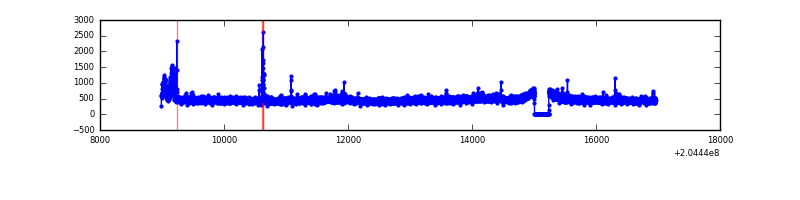 |
| C | 7972 | 7743 | 0 | 0 | 0.00% | 0.00% | 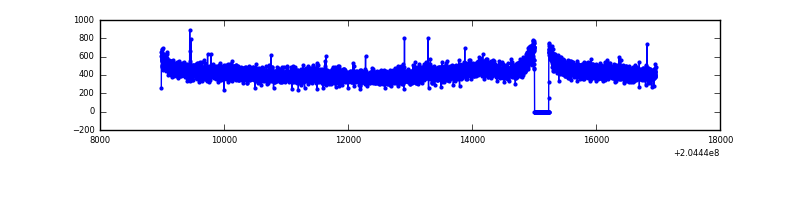 |
| D | 7972 | 7743 | 92 | 92 | 1.15% | 1.19% | 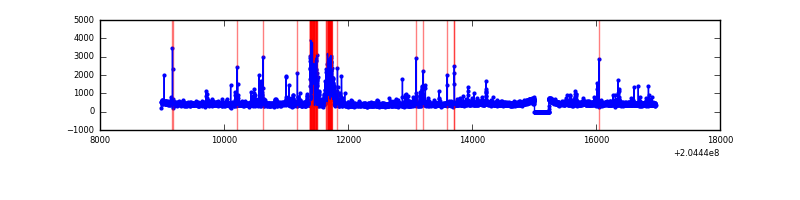 |
Top three noisy pixels from each quadrant. If the there are fewer than three noisy pixels in the level2.evt file, extra rows are filled as -1
| Pixel properties | Quadrant properties | ||||||
|---|---|---|---|---|---|---|---|
| Quadrant | DetID | PixID | Counts | Sigma | Mean | Median | Sigma |
| A | 0 | 50 | 239573 | 1361.26 | 857 | 837 | 175.4 |
| A | 13 | 251 | 135938 | 770.34 | 857 | 837 | 175.4 |
| A | 0 | 118 | 33805 | 187.98 | 857 | 837 | 175.4 |
| B | 4 | 81 | 126335 | 745.02 | 869 | 846 | 168.4 |
| B | 3 | 0 | 120833 | 712.36 | 869 | 846 | 168.4 |
| B | 15 | 204 | 52657 | 307.6 | 869 | 846 | 168.4 |
| C | 13 | 61 | 6993 | 31.44 | 844 | 846 | 195.5 |
| C | 7 | 205 | 3651 | 14.34 | 844 | 846 | 195.5 |
| C | 12 | 4 | 2706 | 9.51 | 844 | 846 | 195.5 |
| D | 2 | 232 | 426765 | 2111.82 | 837 | 811 | 201.7 |
| D | 2 | 32 | 37077 | 179.8 | 837 | 811 | 201.7 |
| D | 13 | 239 | 36386 | 176.38 | 837 | 811 | 201.7 |
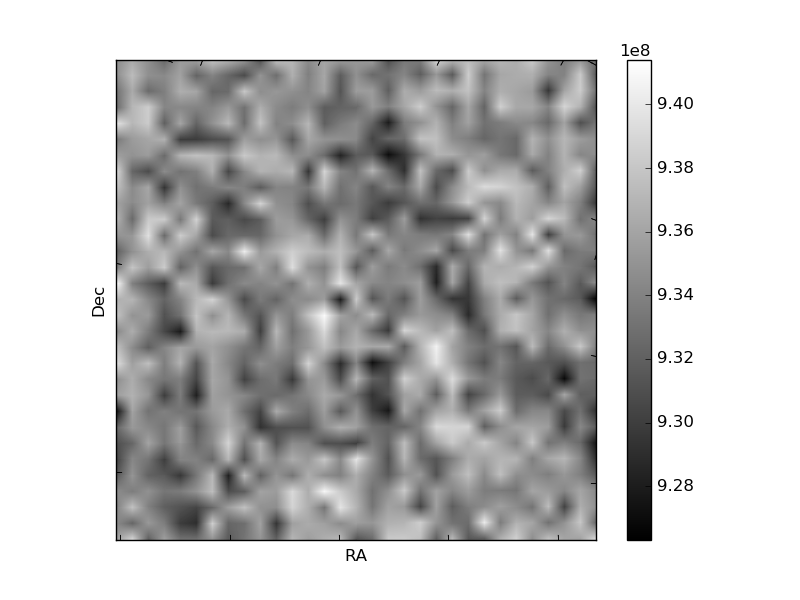
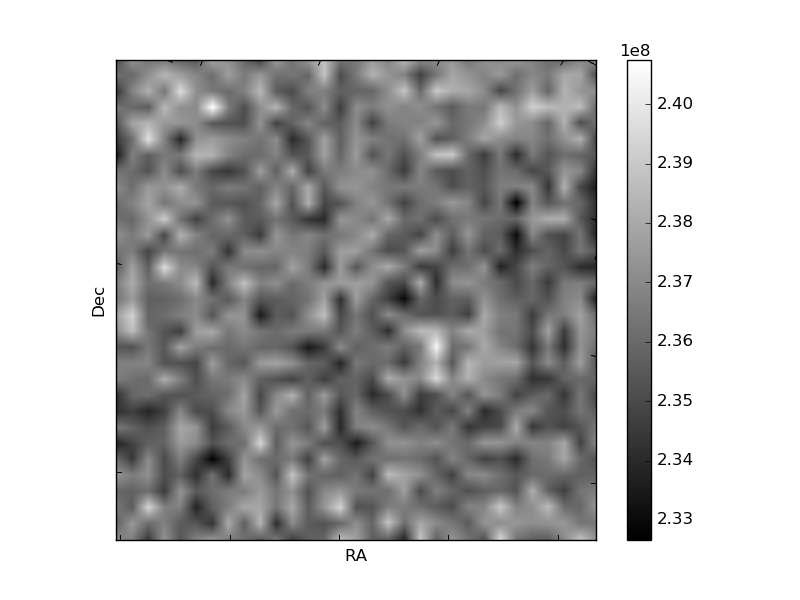
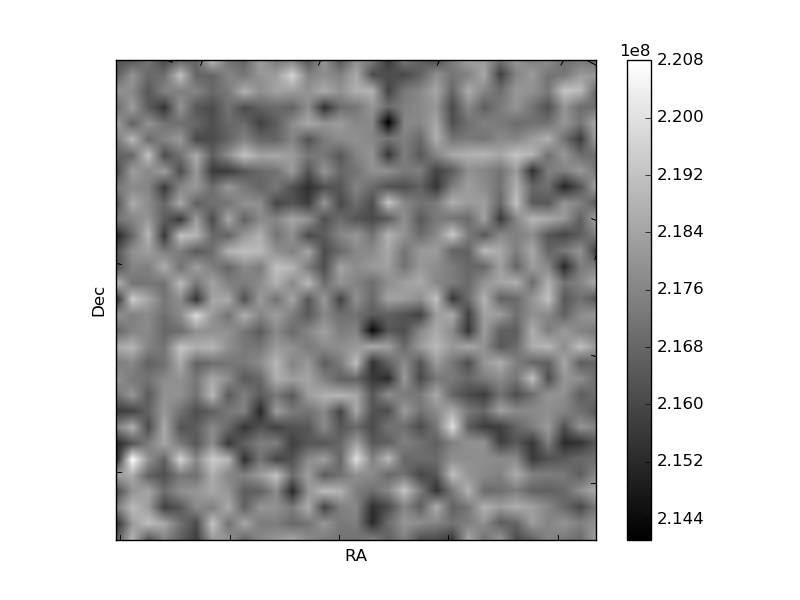
Histogram calculated using DETX and DETY for each event in the final _common_clean file
| Quadrant A | 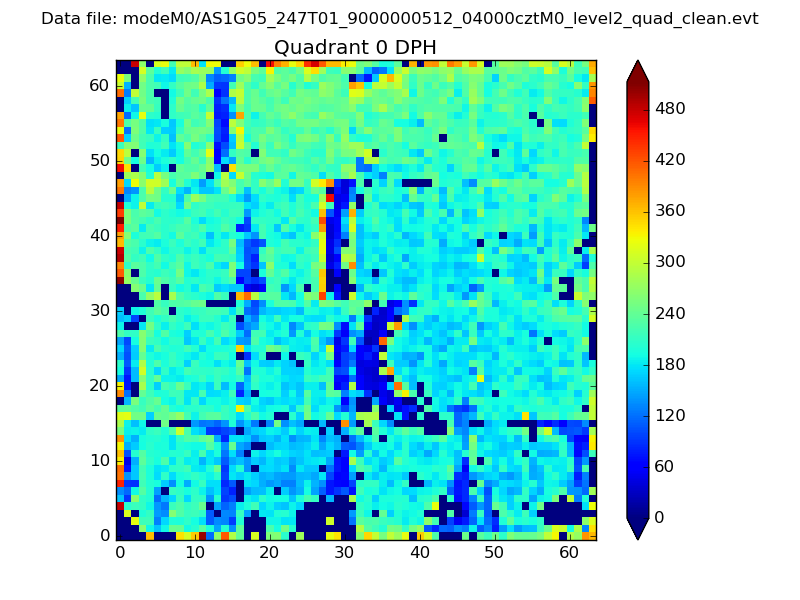 |
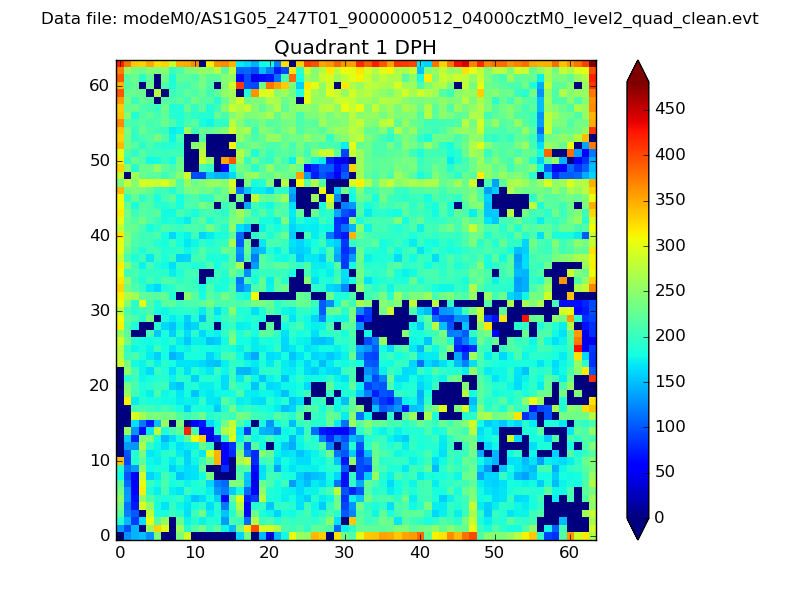 |
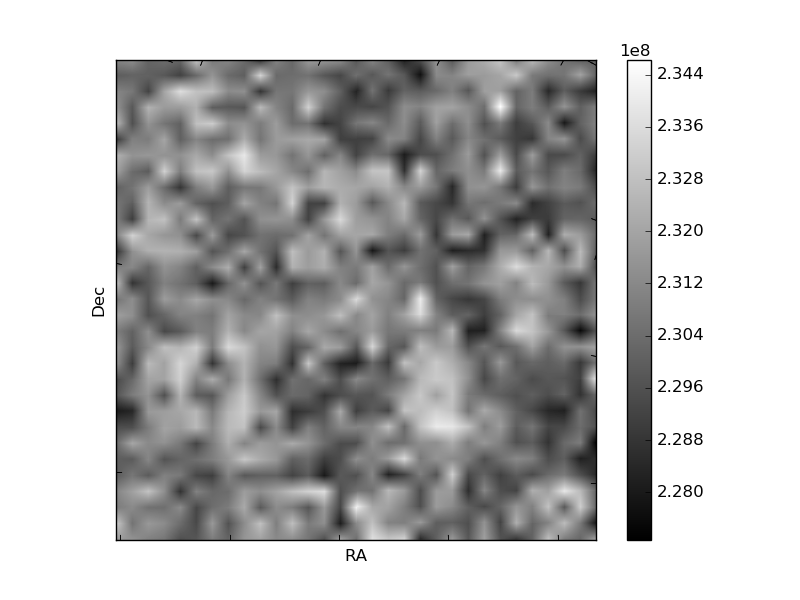
Quadrant B |
|---|---|---|---|
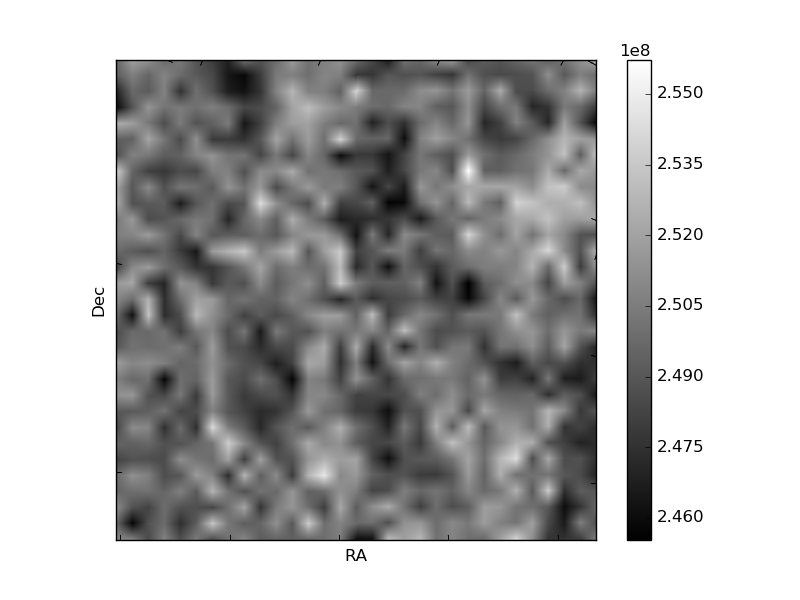
| Quadrant D | 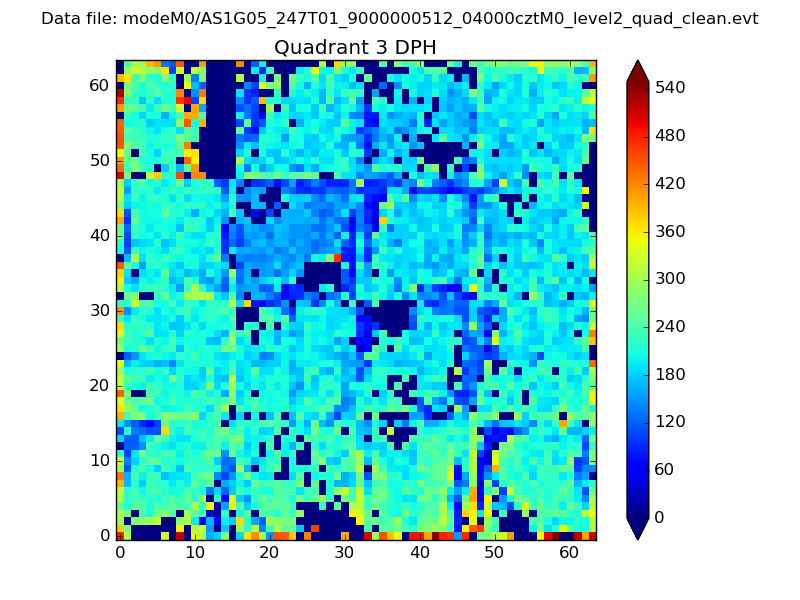 |
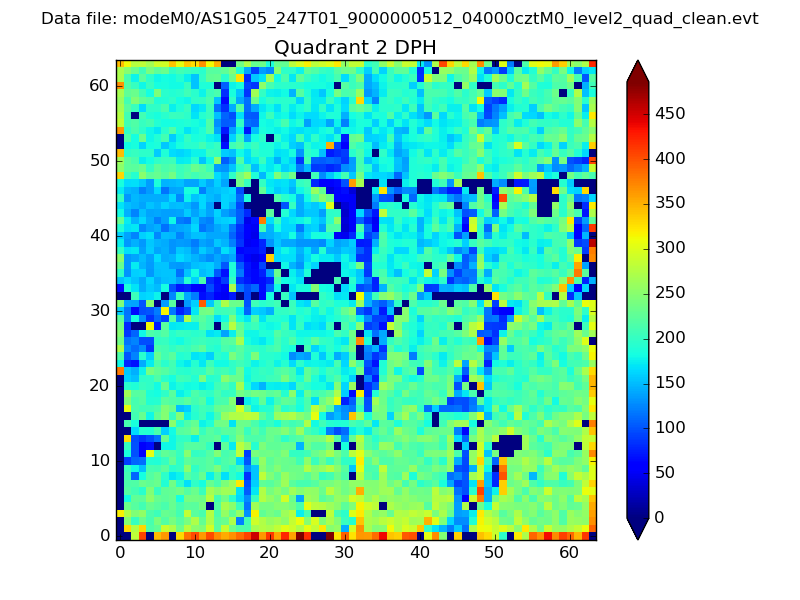 |
Quadrant C |
| Plot type | Count rate plots | Images |
|---|---|---|
| Comparison with Poisson distribution Blue bars denote a histogram of data divided into 1 sec bins. Red curve is a Poisson curve with rate = median count rate of data. |
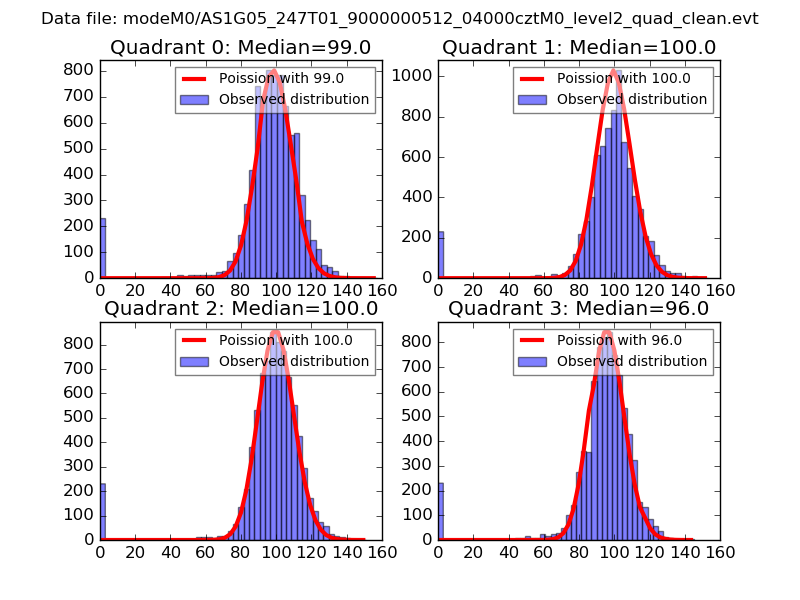 |
 |
| Quadrant-wise count rates Data is divided into 100 sec bins |
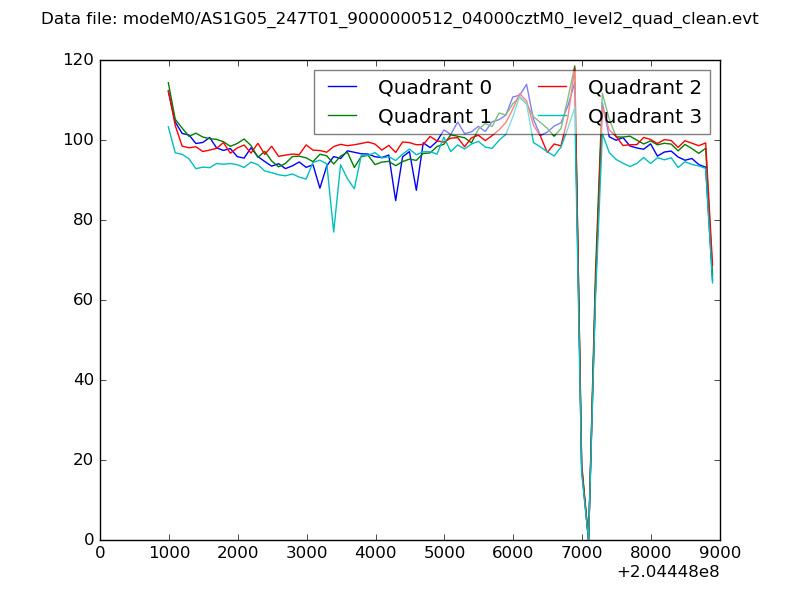 |
|
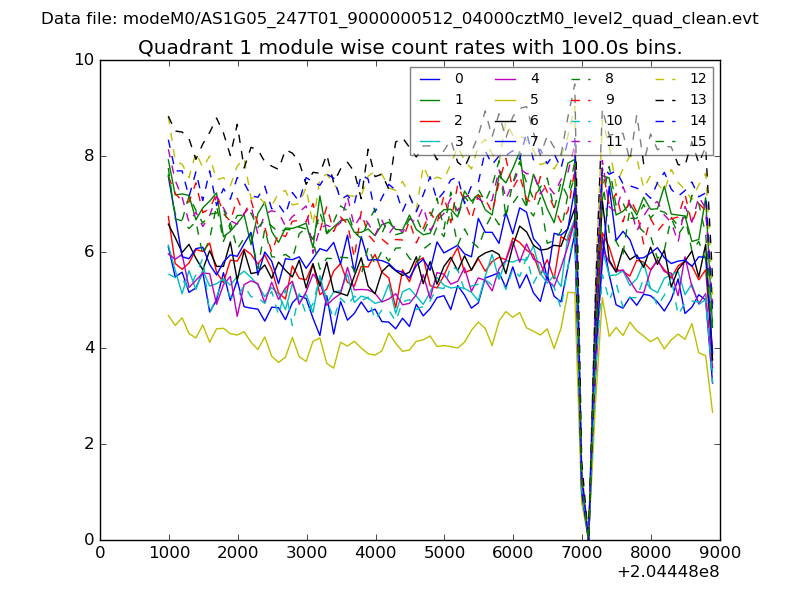
| Module-wise count rates for Quadrant A Data is divided into 100 sec bins |
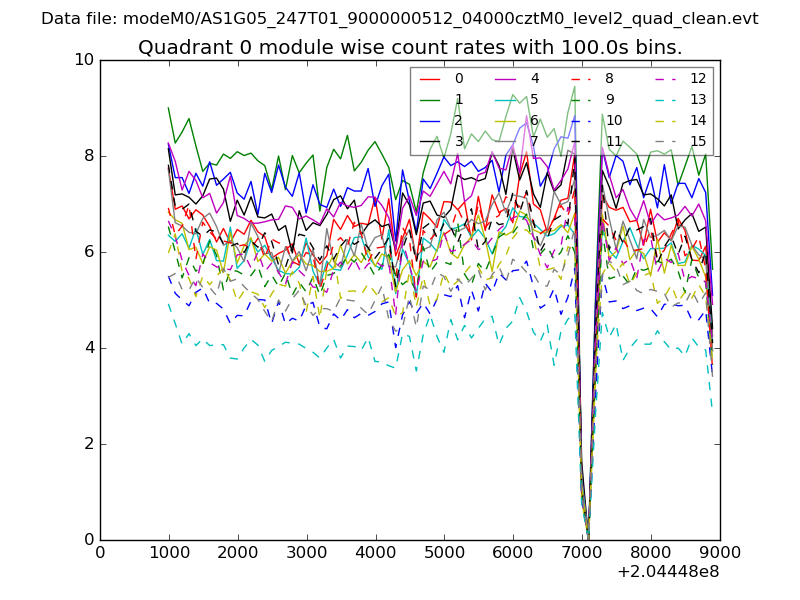 |
 |
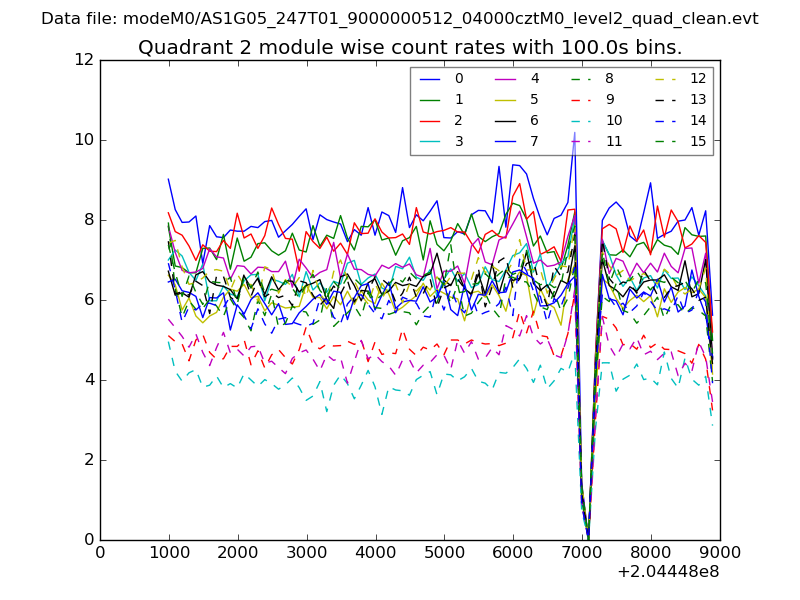
| Module-wise count rates for Quadrant B Data is divided into 100 sec bins |
 |
 |
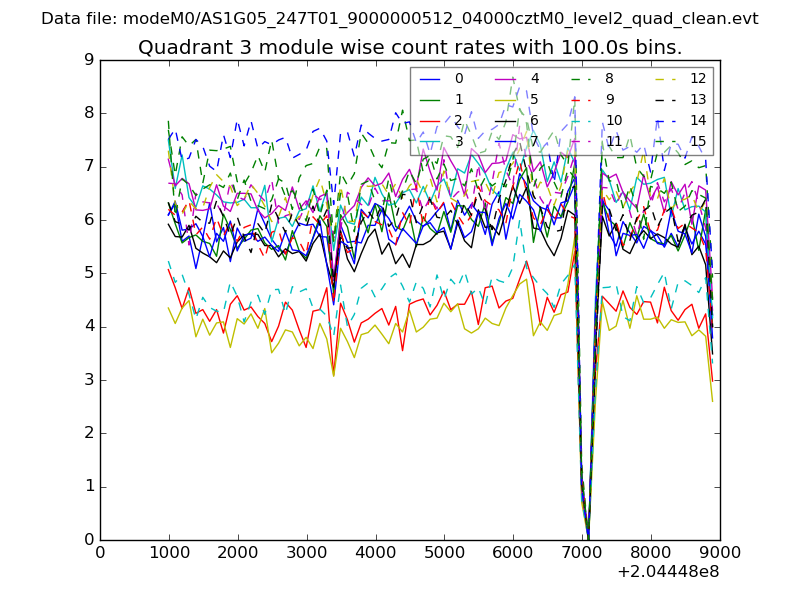
| Module-wise count rates for Quadrant C Data is divided into 100 sec bins |
 |
 |
| Module-wise count rates for Quadrant D Data is divided into 100 sec bins |
 |
 |
| Parameter | Plot |
|---|---|
| CZT HV Monitor | 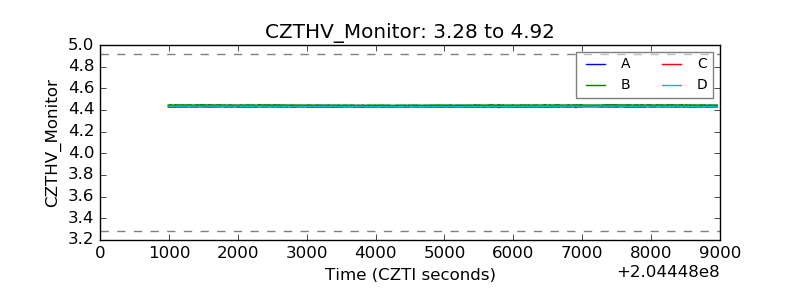 |
| D_VDD | 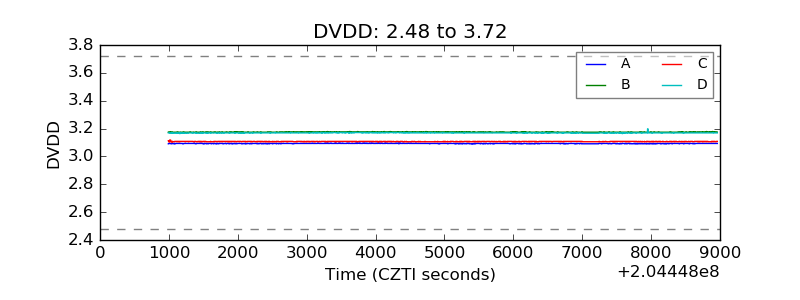 |
| Temperature 1 | 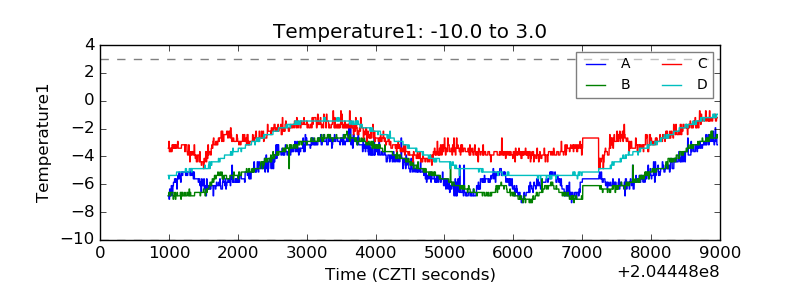 |
| Veto HV Monitor | 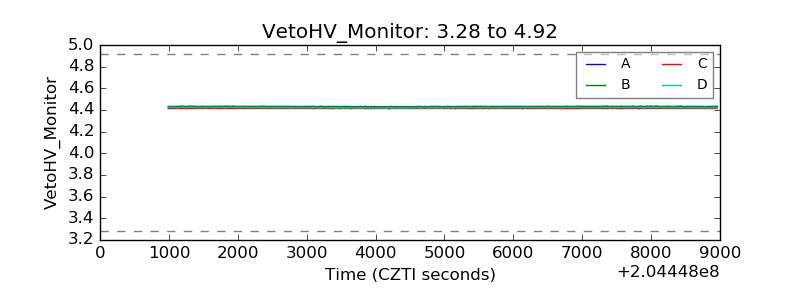 |
| Veto LLD | 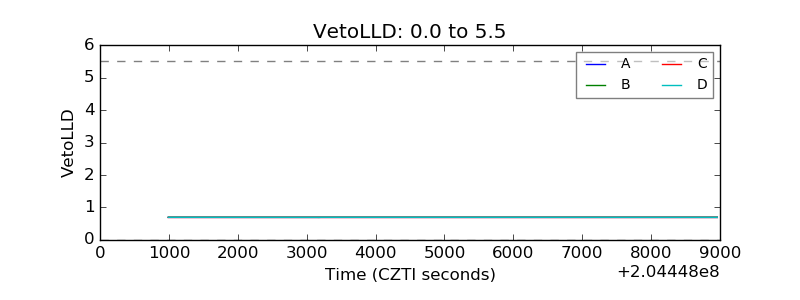 |
| Alpha Counter | 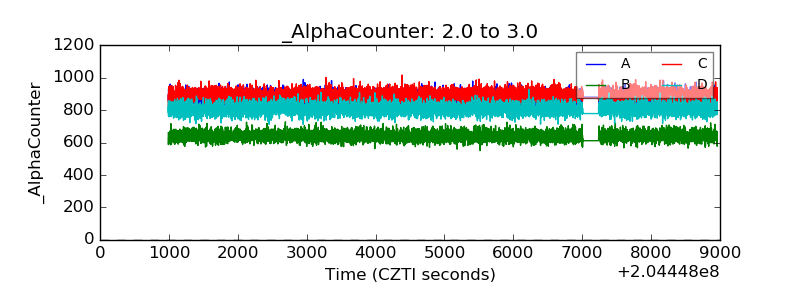 |
| _CPM_Rate | 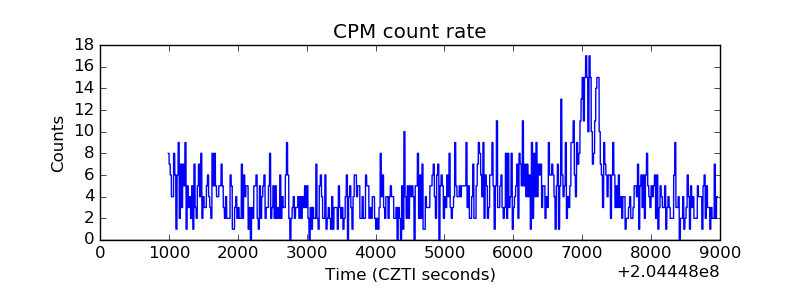 |
| CZT Counter | 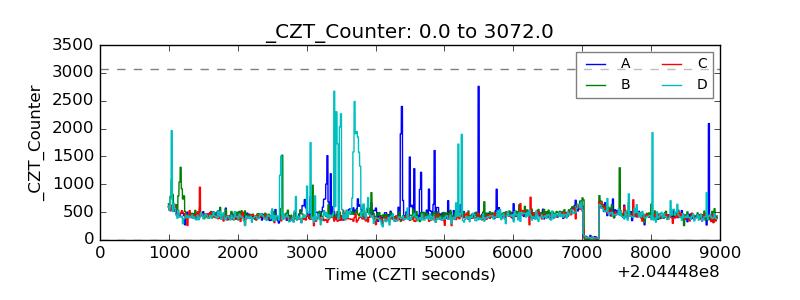 |
| +2.5 Volts monitor |  |
| +5 Volts monitor | 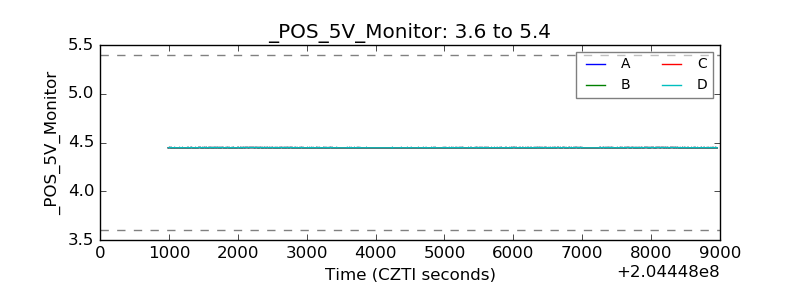 |
| _ROLL_ROT | 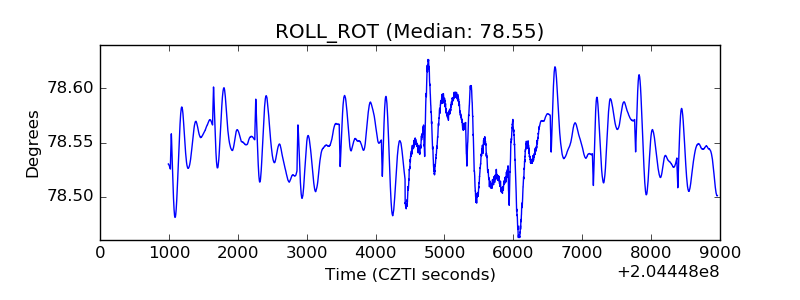 |
| _Roll_DEC | 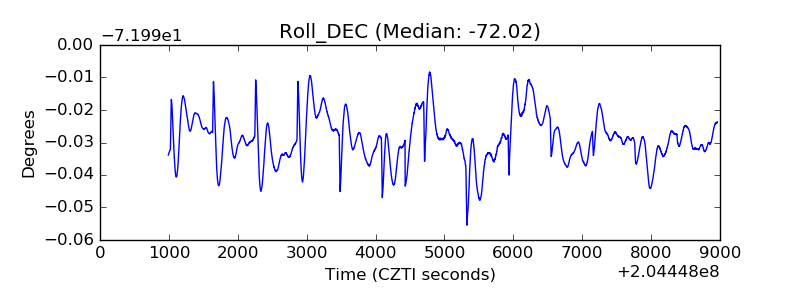 |
| _Roll_RA | 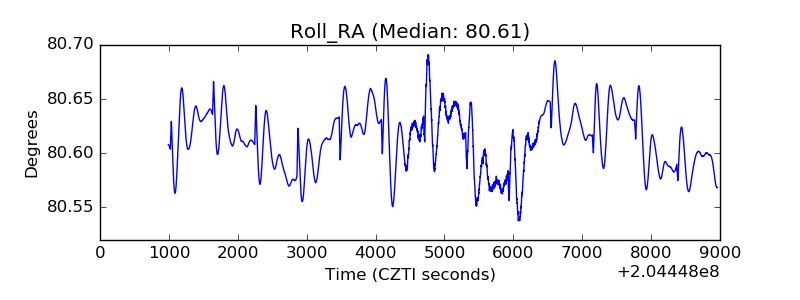 |
| Veto Counter | 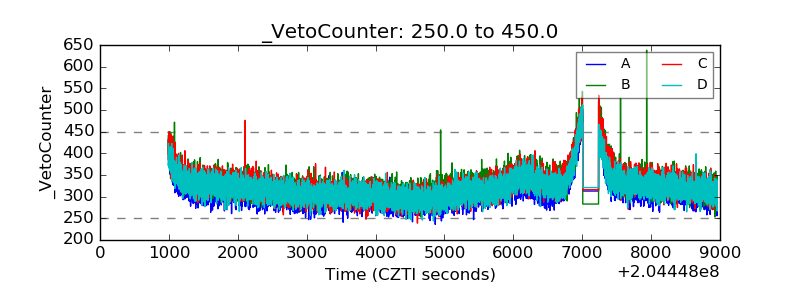 |