| Param | Original file | Final file |
|---|---|---|
| Filename | modeM0/AS1G05_247T01_9000000512_04004cztM0_level2.evt | modeM0/AS1G05_247T01_9000000512_04004cztM0_level2_quad_clean.evt |
| Size (bytes) | 435,021,120 | 93,214,080 |
| Size | 414.9 MB | 88.9 MB |
| Events in quadrant A | 4,079,540 | 590,340 |
| Events in quadrant B | 2,934,121 | 608,559 |
| Events in quadrant C | 2,551,200 | 608,332 |
| Events in quadrant D | 3,198,903 | 593,563 |
| Mode SS | |||
|---|---|---|---|
| Quadrant | BADHDUFLAG | Total packets | Discarded packets |
| A | 0 | 124 | 0 |
| B | 0 | 124 | 0 |
| C | 0 | 124 | 0 |
| D | 0 | 124 | 0 |
| Mode M9 | |||
|---|---|---|---|
| Quadrant | BADHDUFLAG | Total packets | Discarded packets |
| A | 0 | 9 | 0 |
| B | 0 | 9 | 0 |
| C | 0 | 9 | 0 |
| D | 0 | 9 | 0 |
| Mode M0 | |||
|---|---|---|---|
| Quadrant | BADHDUFLAG | Total packets | Discarded packets |
| A | 0 | 16388 | 2 |
| B | 0 | 12850 | 1 |
| C | 0 | 12239 | 1 |
| D | 0 | 14192 | 1 |
| Quadrant | Total seconds | Saturated seconds | Saturation percentage |
|---|---|---|---|
| A | 6036 | 515 | 8.532140% |
| B | 6036 | 37 | 0.612989% |
| C | 6036 | 17 | 0.281643% |
| D | 6036 | 79 | 1.308814% |
Noise dominated data is calculated using 1-second bins in cleaned event files. If a bin has >2000 counts, and if more than 50% of those come from <1% of pixels, then it is considered to be noise-dominated and hence unusable.
| Quadrant | # 1 sec bins | Bins with >0 counts | Bins with >2000 counts | High rate bins dominated by noise | Noise dominated (total time) | Noise dominated (detector-on time) | Marked lightcurve |
|---|---|---|---|---|---|---|---|
| A | 6996 | 6037 | 364 | 364 | 5.20% | 6.03% | 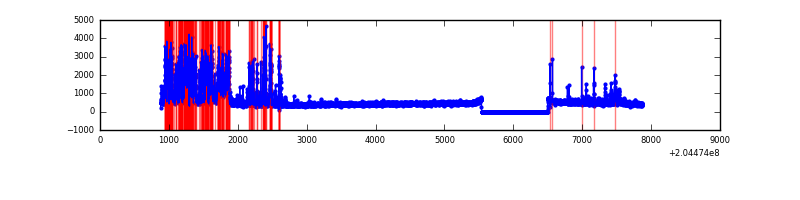 |
| B | 6996 | 6037 | 13 | 13 | 0.19% | 0.22% | 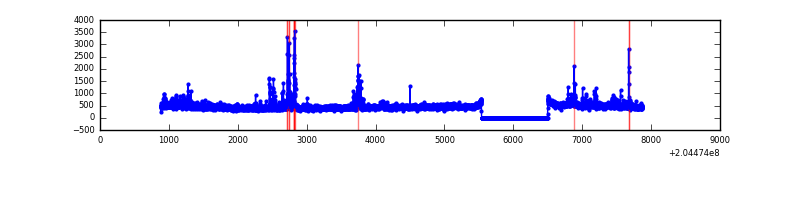 |
| C | 6996 | 6037 | 6 | 6 | 0.09% | 0.10% |  |
| D | 6996 | 6037 | 50 | 50 | 0.71% | 0.83% | 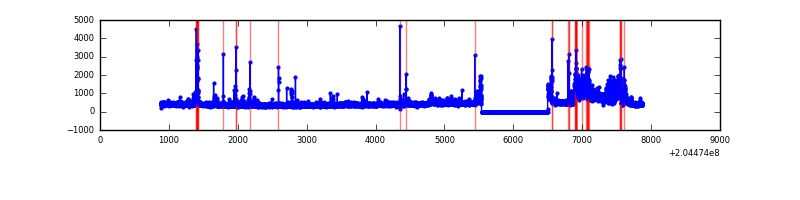 |
Top three noisy pixels from each quadrant. If the there are fewer than three noisy pixels in the level2.evt file, extra rows are filled as -1
| Pixel properties | Quadrant properties | ||||||
|---|---|---|---|---|---|---|---|
| Quadrant | DetID | PixID | Counts | Sigma | Mean | Median | Sigma |
| A | 0 | 50 | 1463723 | 11036.42 | 642 | 628 | 132.6 |
| A | 0 | 118 | 98745 | 740.12 | 642 | 628 | 132.6 |
| A | 0 | 226 | 15326 | 110.87 | 642 | 628 | 132.6 |
| B | 14 | 167 | 161210 | 1250.78 | 669 | 655 | 128.4 |
| B | 15 | 204 | 119726 | 927.6 | 669 | 655 | 128.4 |
| B | 0 | 183 | 17262 | 129.37 | 669 | 655 | 128.4 |
| C | 9 | 144 | 40710 | 267.1 | 641 | 642 | 150.0 |
| C | 12 | 4 | 6567 | 39.5 | 641 | 642 | 150.0 |
| C | 13 | 61 | 5337 | 31.3 | 641 | 642 | 150.0 |
| D | 10 | 246 | 471388 | 3042.59 | 640 | 620 | 154.7 |
| D | 2 | 232 | 138118 | 888.65 | 640 | 620 | 154.7 |
| D | 8 | 112 | 52150 | 333.04 | 640 | 620 | 154.7 |
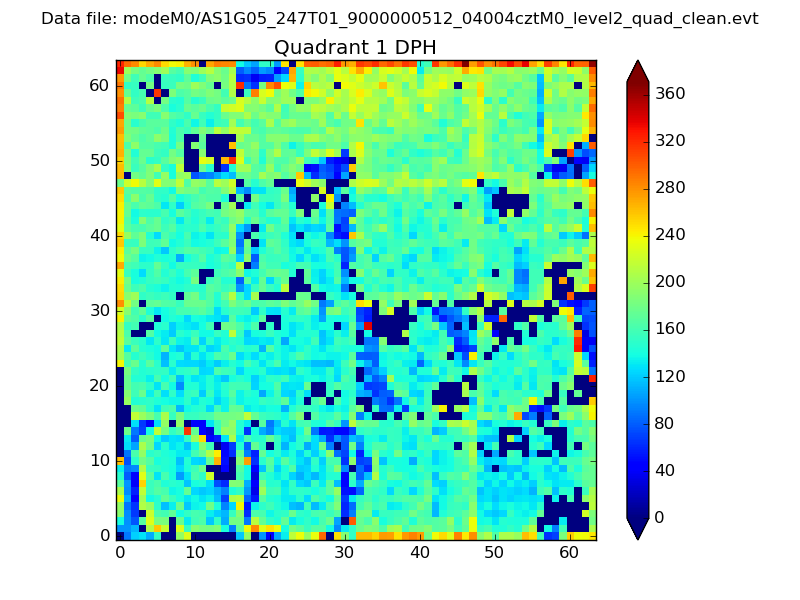
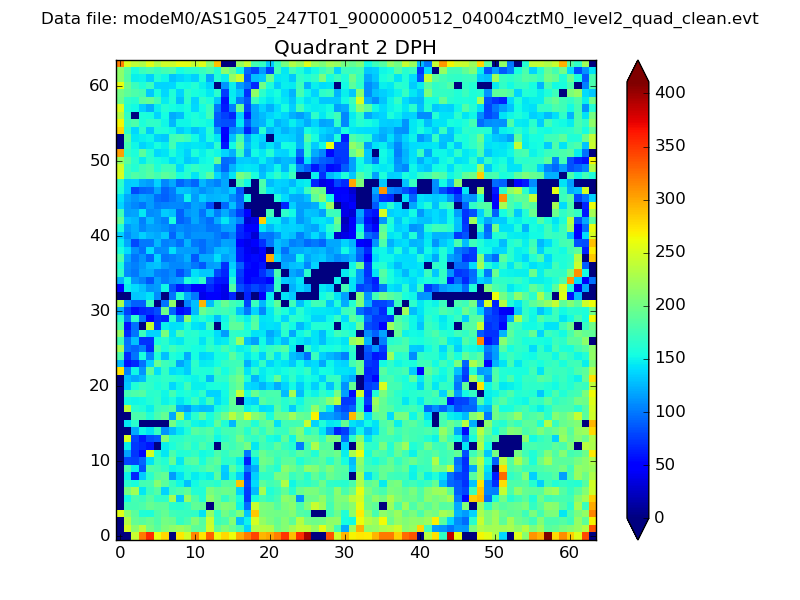
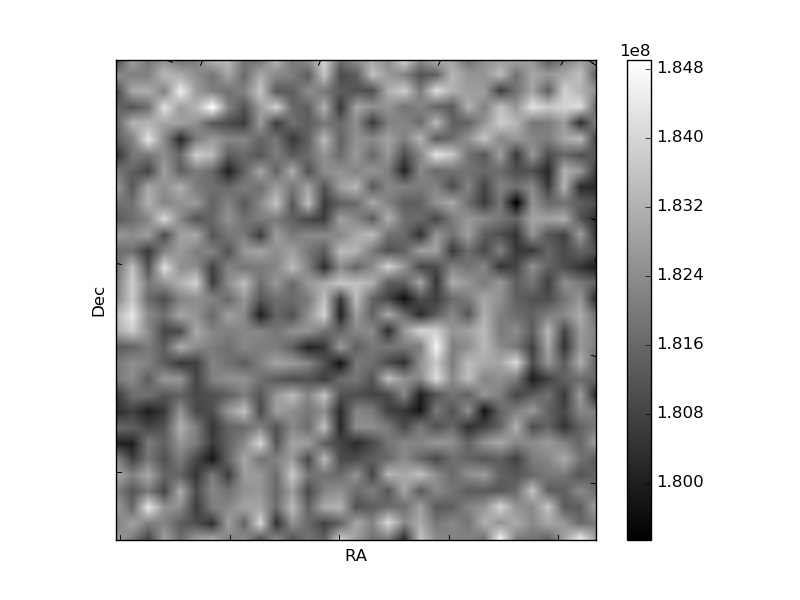
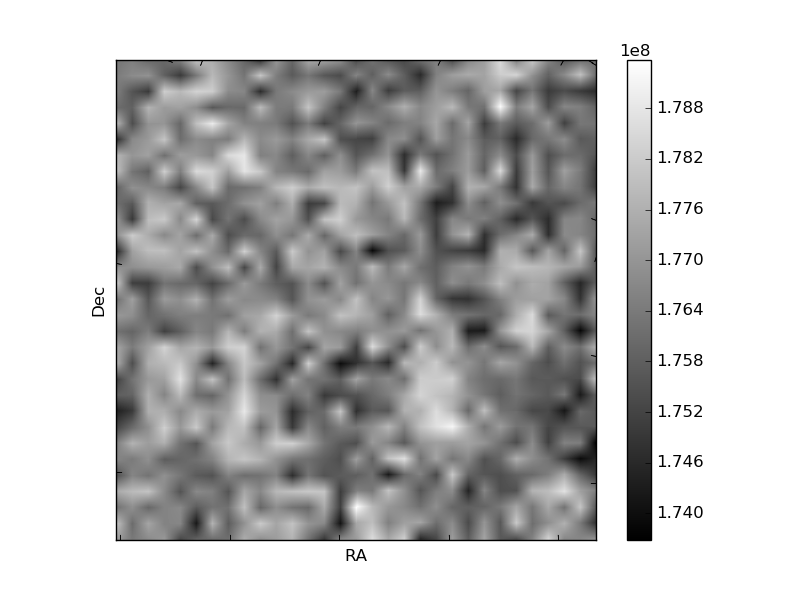
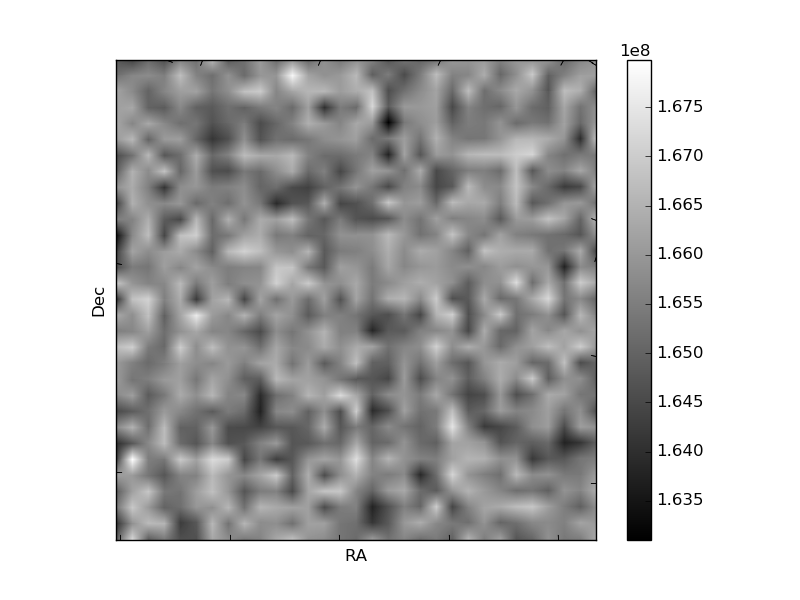
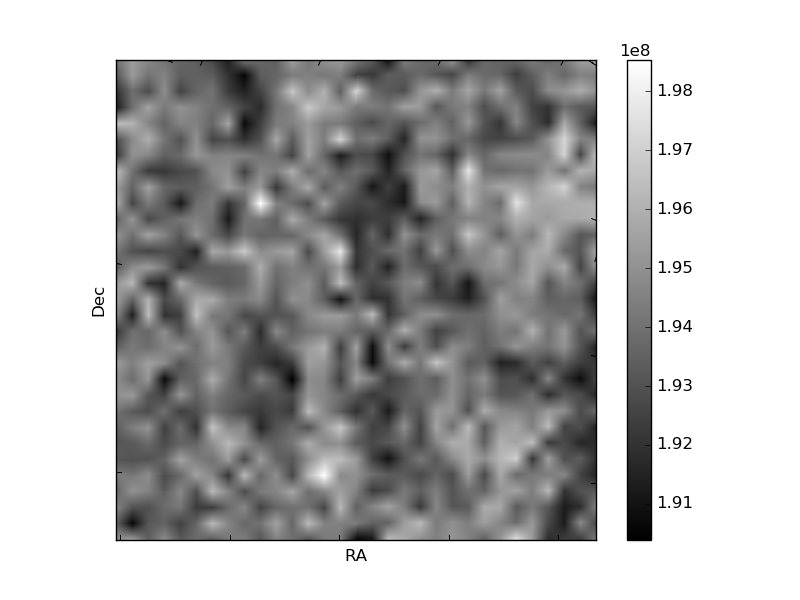
Histogram calculated using DETX and DETY for each event in the final _common_clean file
| Quadrant A | 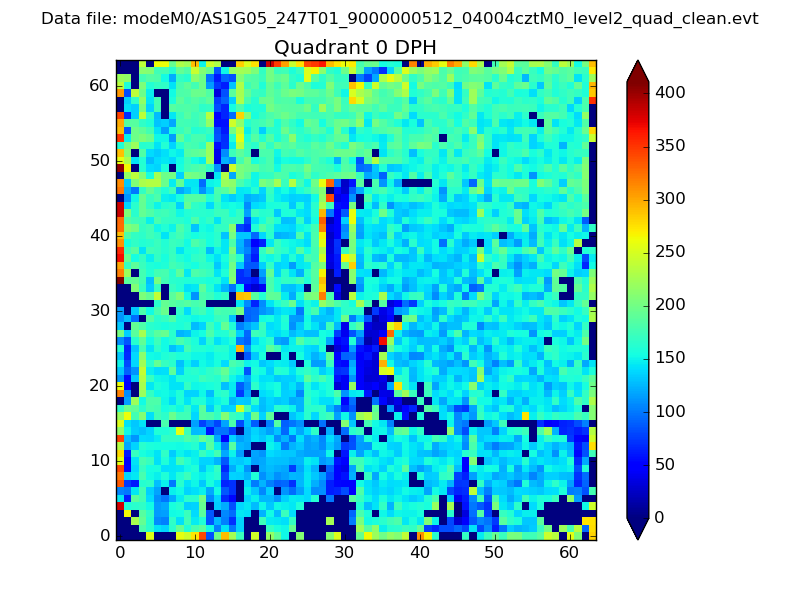 |
 |
Quadrant B |
|---|---|---|---|
| Quadrant D |  |
 |
Quadrant C |
| Plot type | Count rate plots | Images |
|---|---|---|
| Comparison with Poisson distribution Blue bars denote a histogram of data divided into 1 sec bins. Red curve is a Poisson curve with rate = median count rate of data. |
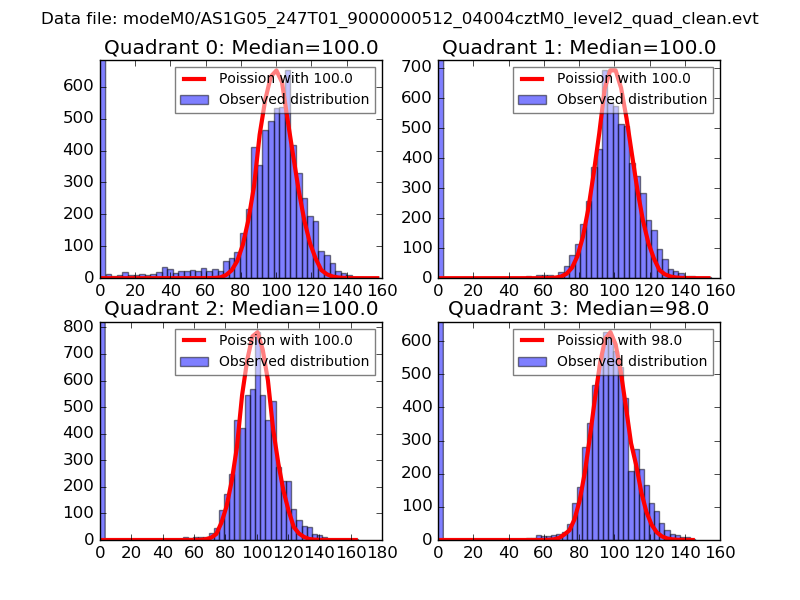 |
 |
| Quadrant-wise count rates Data is divided into 100 sec bins |
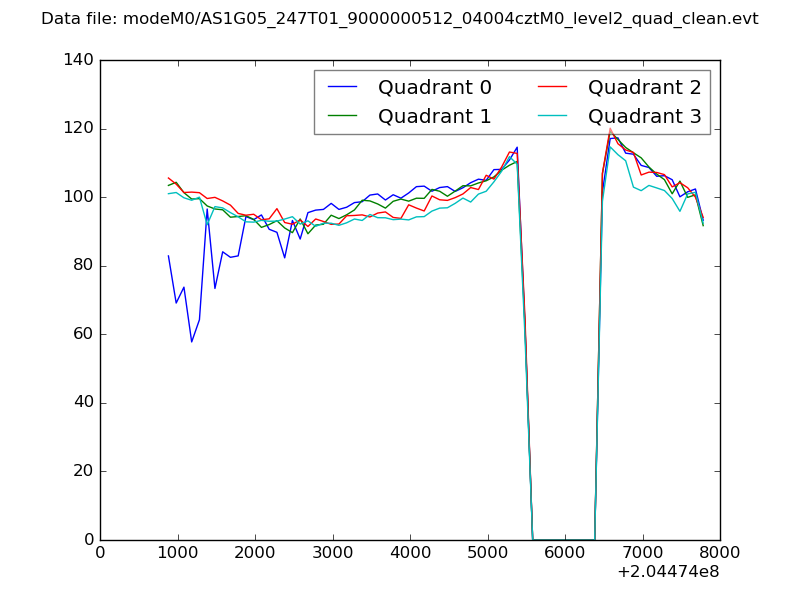 |
|
| Module-wise count rates for Quadrant A Data is divided into 100 sec bins |
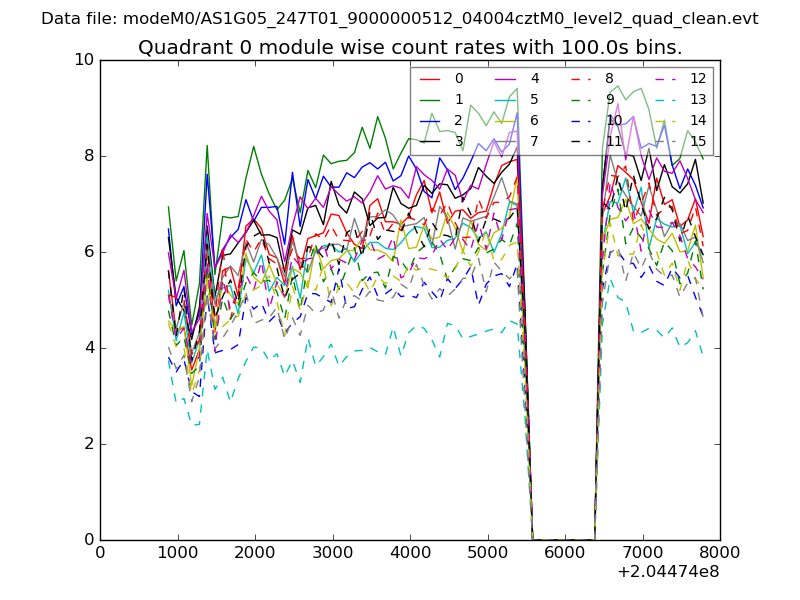 |
 |
| Module-wise count rates for Quadrant B Data is divided into 100 sec bins |
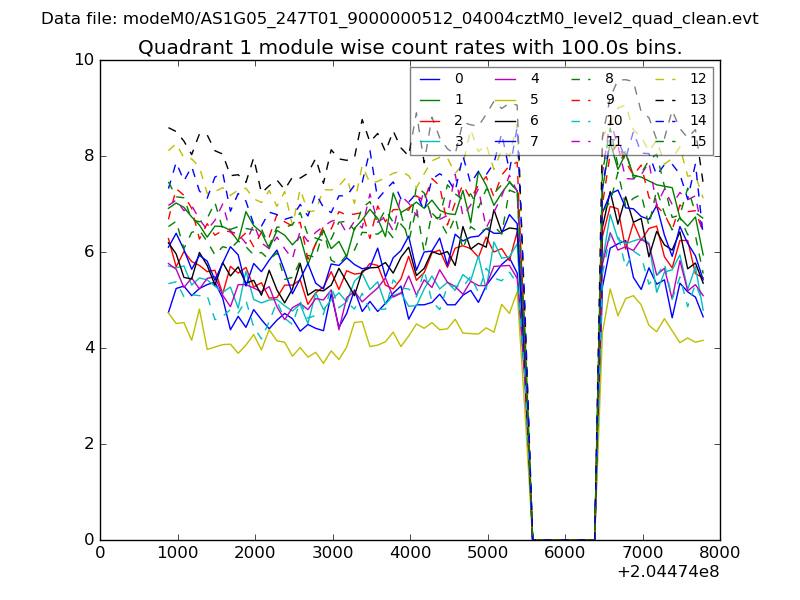 |
 |
| Module-wise count rates for Quadrant C Data is divided into 100 sec bins |
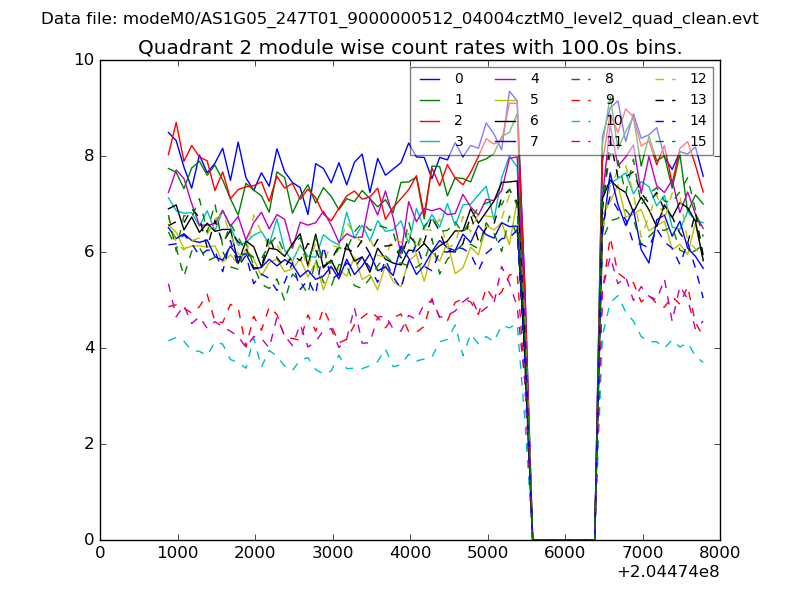 |
 |
| Module-wise count rates for Quadrant D Data is divided into 100 sec bins |
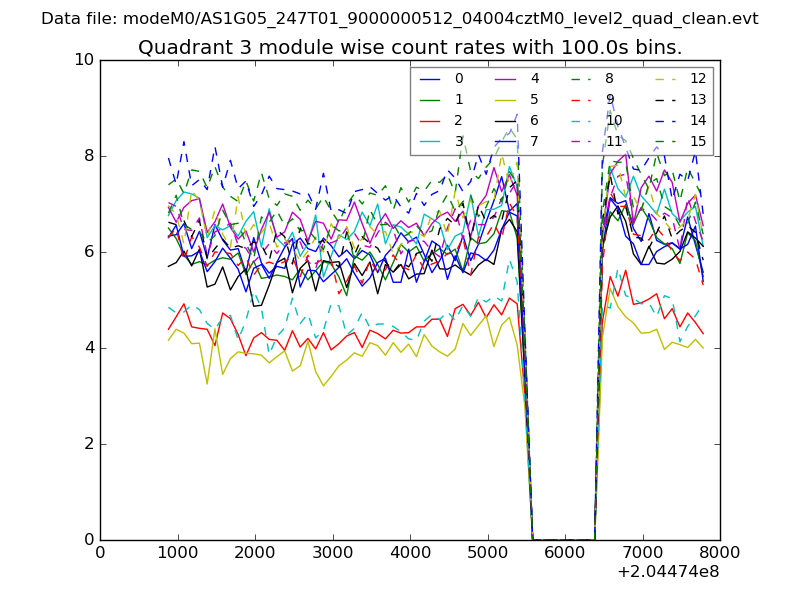 |
 |
| Parameter | Plot |
|---|---|
| CZT HV Monitor | 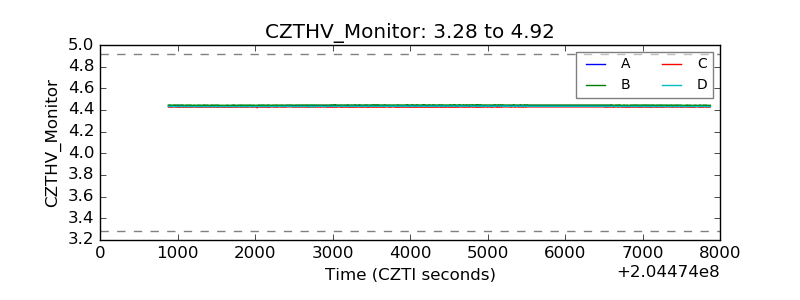 |
| D_VDD | 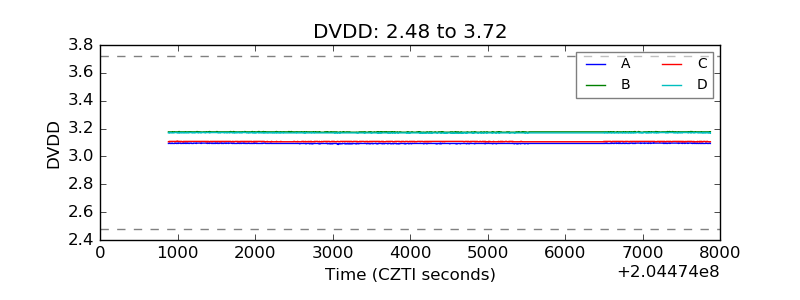 |
| Temperature 1 | 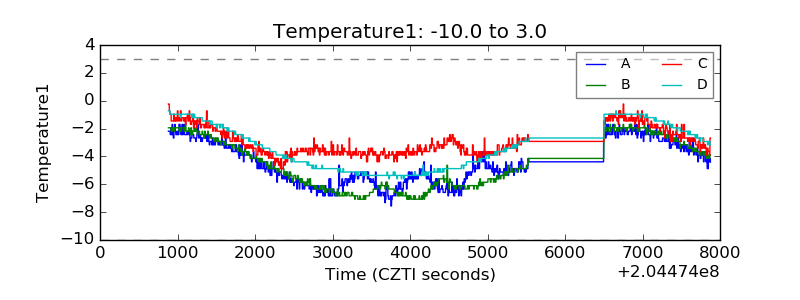 |
| Veto HV Monitor | 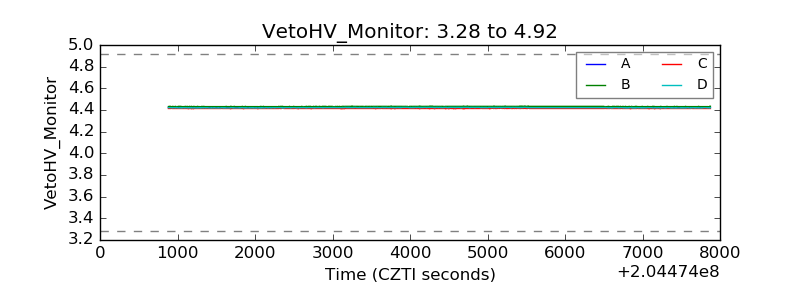 |
| Veto LLD | 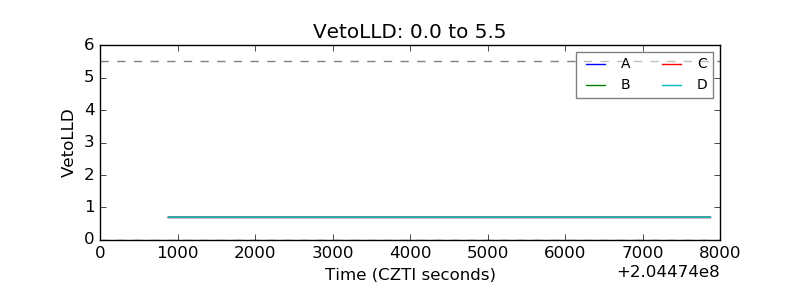 |
| Alpha Counter | 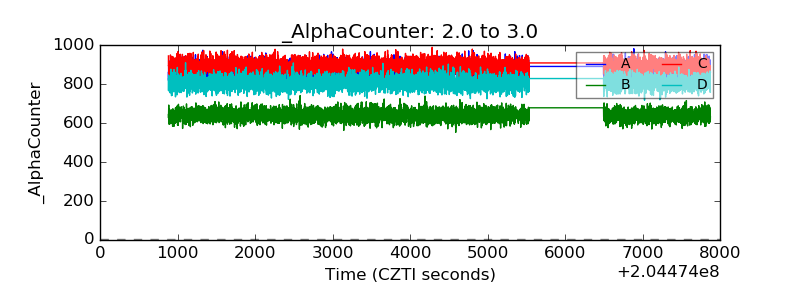 |
| _CPM_Rate | 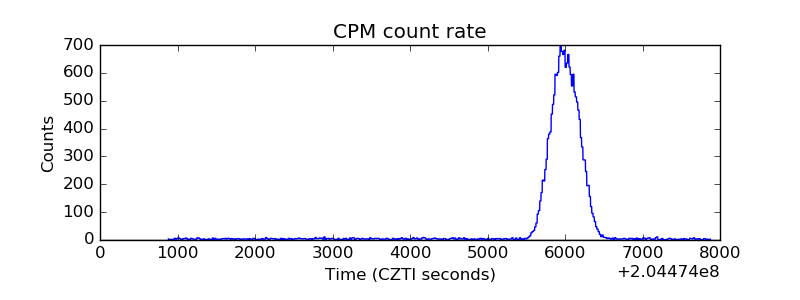 |
| CZT Counter |  |
| +2.5 Volts monitor |  |
| +5 Volts monitor |  |
| _ROLL_ROT | 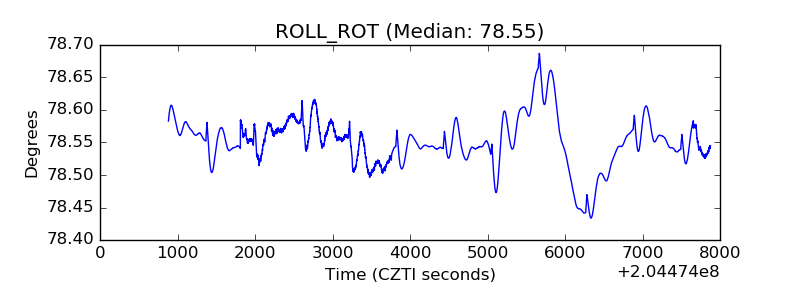 |
| _Roll_DEC | 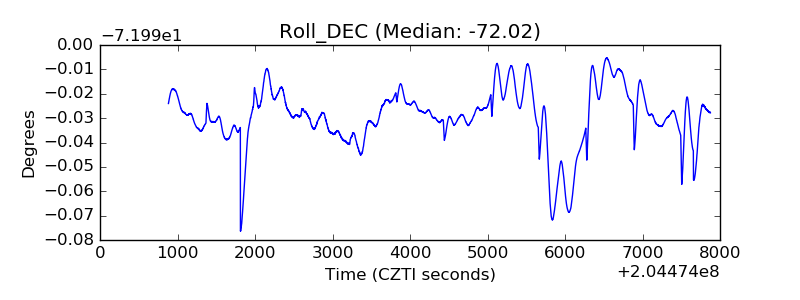 |
| _Roll_RA | 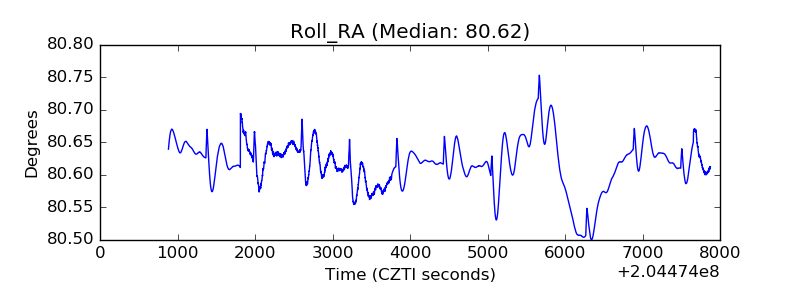 |
| Veto Counter | 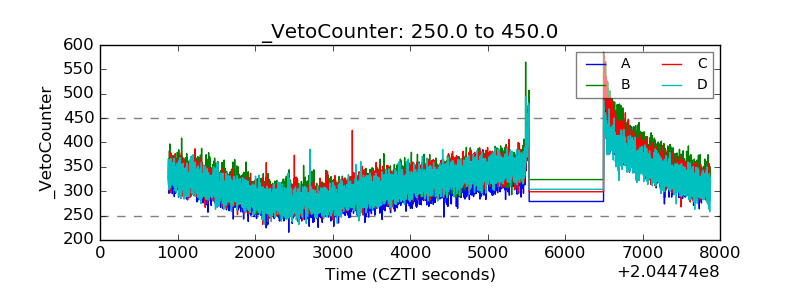 |