| Param | Original file | Final file |
|---|---|---|
| Filename | modeM0/AS1G05_247T01_9000000512_04007cztM0_level2.evt | modeM0/AS1G05_247T01_9000000512_04007cztM0_level2_quad_clean.evt |
| Size (bytes) | 441,331,200 | 104,379,840 |
| Size | 420.9 MB | 99.5 MB |
| Events in quadrant A | 3,224,314 | 691,689 |
| Events in quadrant B | 3,008,630 | 694,618 |
| Events in quadrant C | 2,837,747 | 681,260 |
| Events in quadrant D | 3,865,837 | 652,994 |
| Mode SS | |||
|---|---|---|---|
| Quadrant | BADHDUFLAG | Total packets | Discarded packets |
| A | 0 | 128 | 0 |
| B | 0 | 128 | 0 |
| C | 0 | 128 | 0 |
| D | 0 | 128 | 0 |
| Mode M9 | |||
|---|---|---|---|
| Quadrant | BADHDUFLAG | Total packets | Discarded packets |
| A | 0 | 16 | 0 |
| B | 0 | 16 | 0 |
| C | 0 | 16 | 0 |
| D | 0 | 17 | 0 |
| Mode M0 | |||
|---|---|---|---|
| Quadrant | BADHDUFLAG | Total packets | Discarded packets |
| A | 0 | 14062 | 3 |
| B | 0 | 13323 | 2 |
| C | 0 | 13014 | 2 |
| D | 0 | 16089 | 2 |
| Quadrant | Total seconds | Saturated seconds | Saturation percentage |
|---|---|---|---|
| A | 6312 | 131 | 2.075412% |
| B | 6312 | 41 | 0.649556% |
| C | 6312 | 30 | 0.475285% |
| D | 6312 | 230 | 3.643853% |
Noise dominated data is calculated using 1-second bins in cleaned event files. If a bin has >2000 counts, and if more than 50% of those come from <1% of pixels, then it is considered to be noise-dominated and hence unusable.
| Quadrant | # 1 sec bins | Bins with >0 counts | Bins with >2000 counts | High rate bins dominated by noise | Noise dominated (total time) | Noise dominated (detector-on time) | Marked lightcurve |
|---|---|---|---|---|---|---|---|
| A | 7477 | 6313 | 55 | 55 | 0.74% | 0.87% | 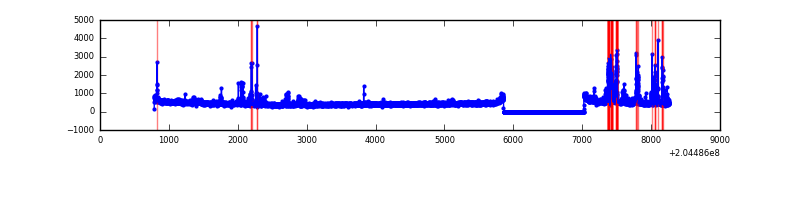 |
| B | 7477 | 6313 | 0 | 0 | 0.00% | 0.00% | 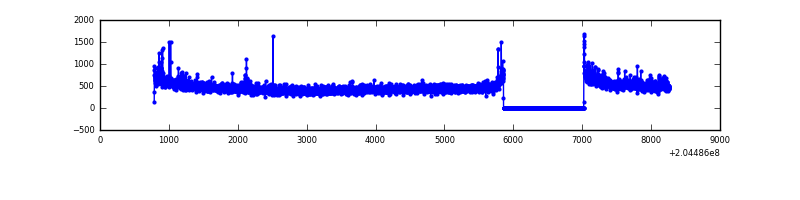 |
| C | 7477 | 6313 | 3 | 3 | 0.04% | 0.05% | 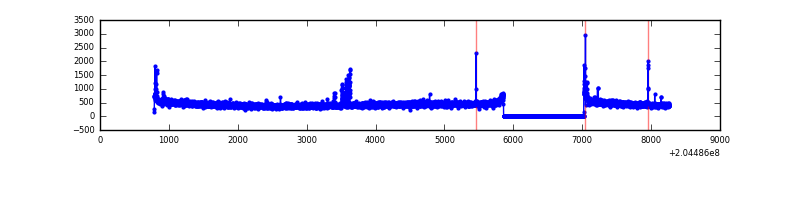 |
| D | 7477 | 6313 | 298 | 298 | 3.99% | 4.72% | 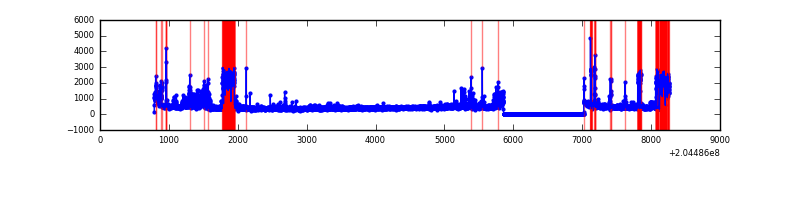 |
Top three noisy pixels from each quadrant. If the there are fewer than three noisy pixels in the level2.evt file, extra rows are filled as -1
| Pixel properties | Quadrant properties | ||||||
|---|---|---|---|---|---|---|---|
| Quadrant | DetID | PixID | Counts | Sigma | Mean | Median | Sigma |
| A | 0 | 50 | 297308 | 1994.73 | 725 | 709 | 148.7 |
| A | 0 | 118 | 99987 | 667.68 | 725 | 709 | 148.7 |
| A | 0 | 226 | 16420 | 105.66 | 725 | 709 | 148.7 |
| B | 15 | 204 | 65567 | 465.26 | 736 | 719 | 139.4 |
| B | 10 | 16 | 22603 | 157.01 | 736 | 719 | 139.4 |
| B | 15 | 54 | 18491 | 127.51 | 736 | 719 | 139.4 |
| C | 9 | 144 | 53440 | 325.82 | 698 | 703 | 161.9 |
| C | 12 | 4 | 28635 | 172.57 | 698 | 703 | 161.9 |
| C | 8 | 128 | 15591 | 91.98 | 698 | 703 | 161.9 |
| D | 9 | 82 | 747982 | 4544.2 | 691 | 672 | 164.5 |
| D | 10 | 246 | 195370 | 1183.91 | 691 | 672 | 164.5 |
| D | 13 | 53 | 72806 | 438.63 | 691 | 672 | 164.5 |
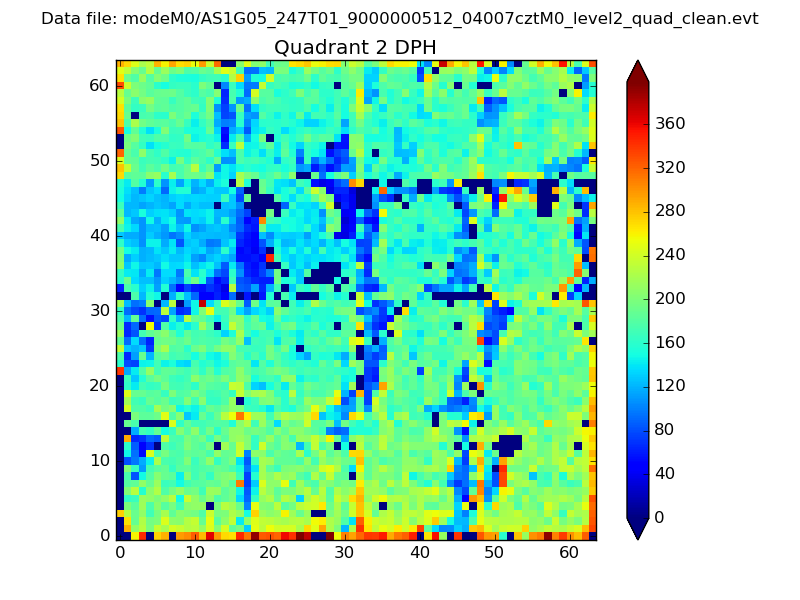
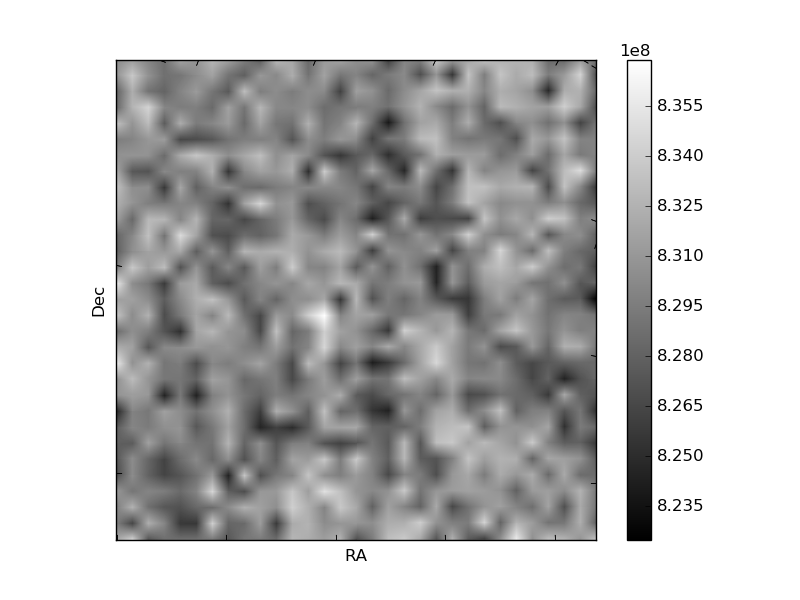
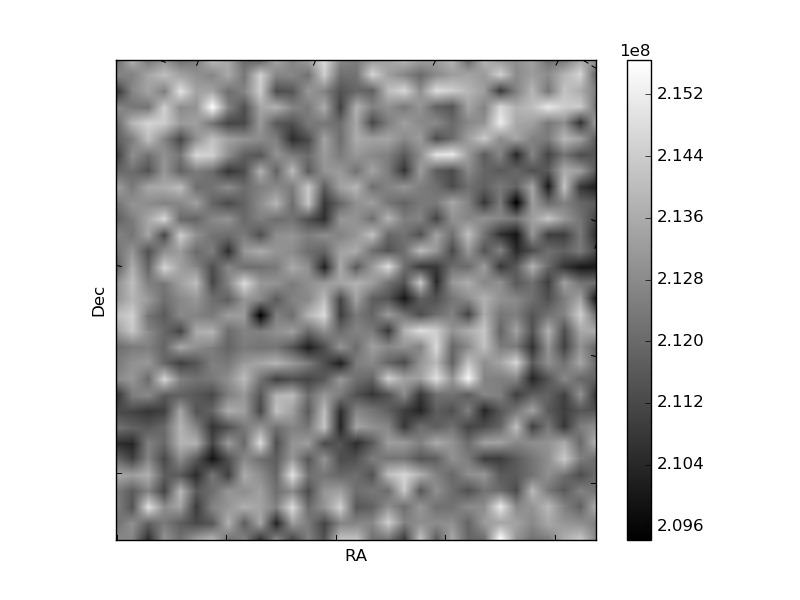
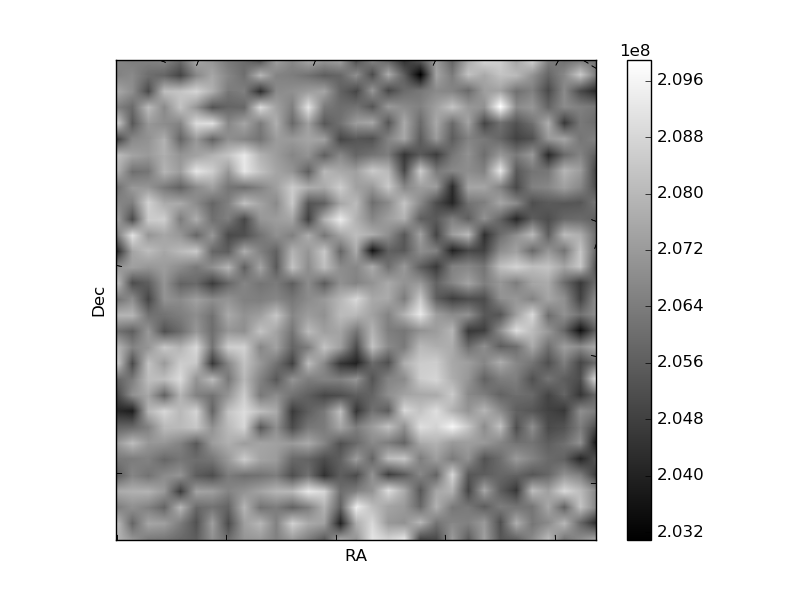
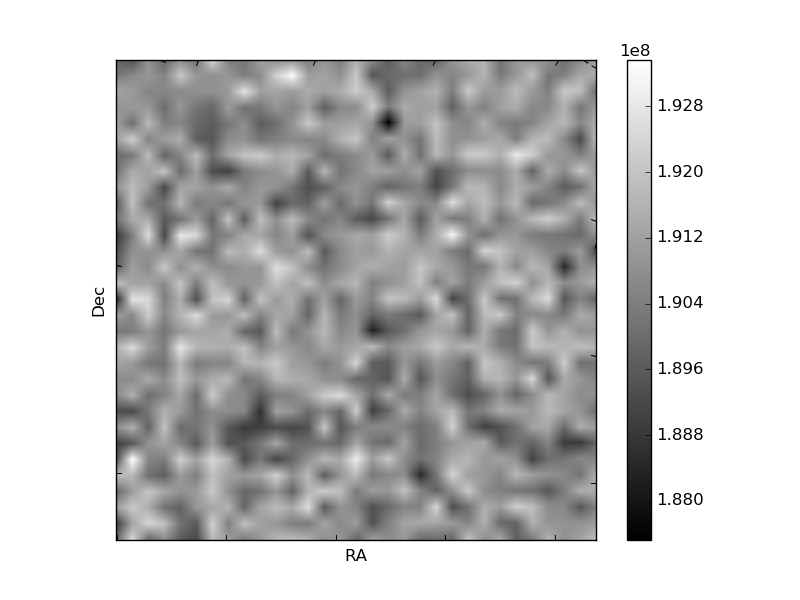
Histogram calculated using DETX and DETY for each event in the final _common_clean file
| Quadrant A | 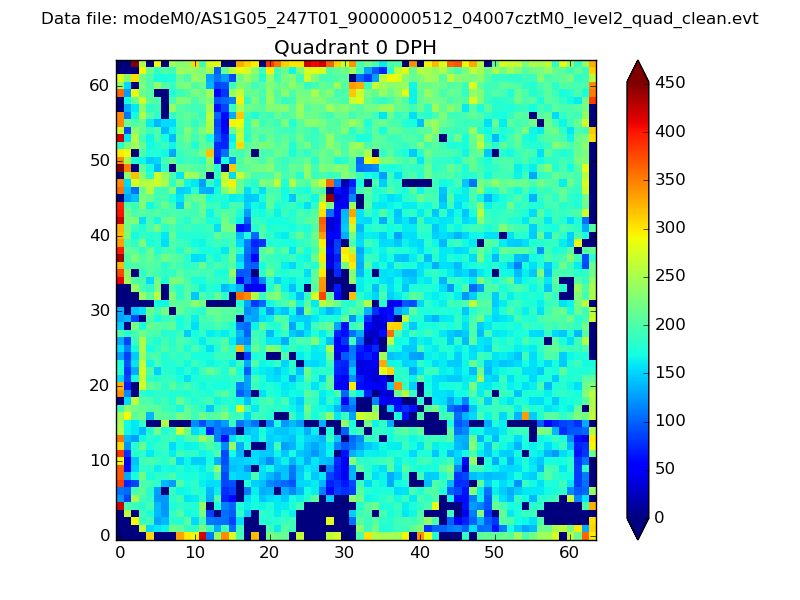 |
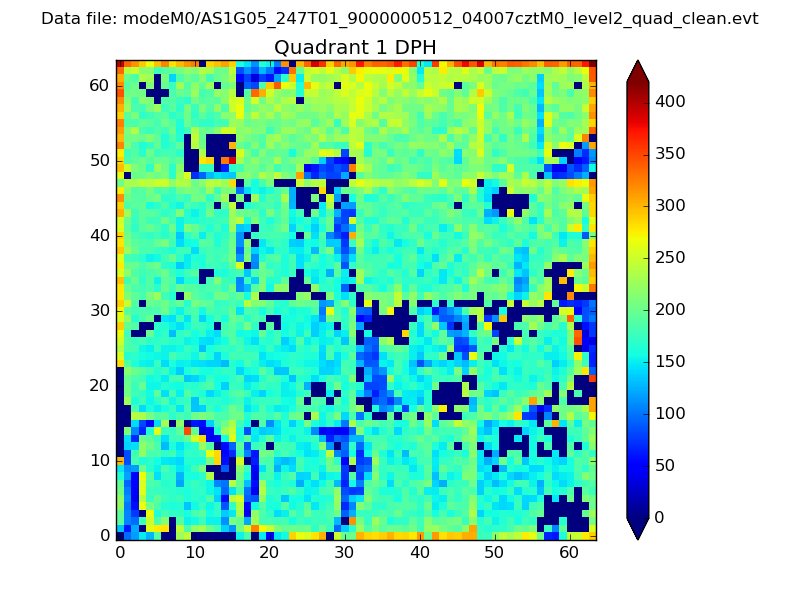 |
Quadrant B |
|---|---|---|---|
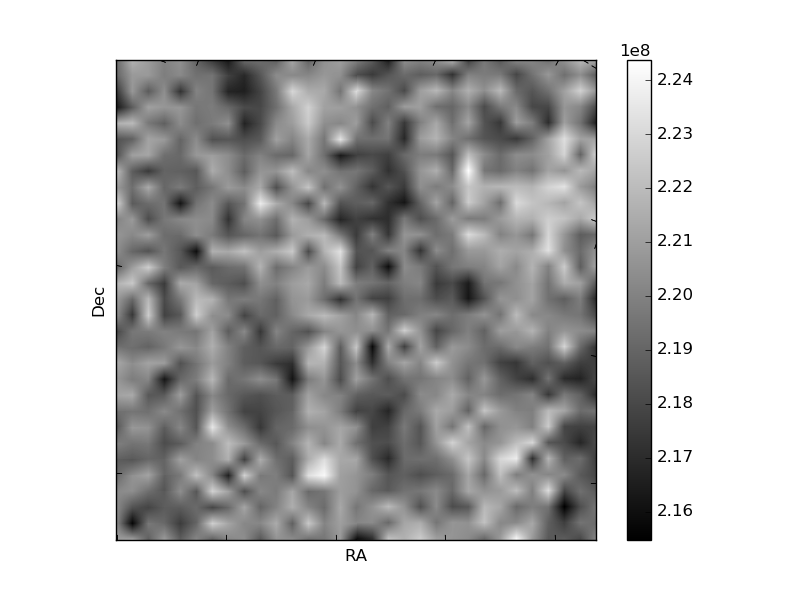
| Quadrant D | 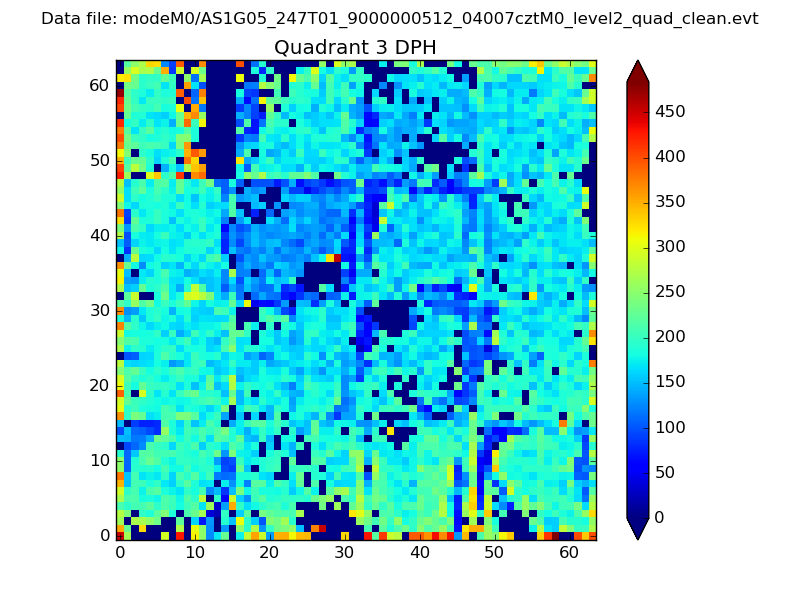 |
 |
Quadrant C |
| Plot type | Count rate plots | Images |
|---|---|---|
| Comparison with Poisson distribution Blue bars denote a histogram of data divided into 1 sec bins. Red curve is a Poisson curve with rate = median count rate of data. |
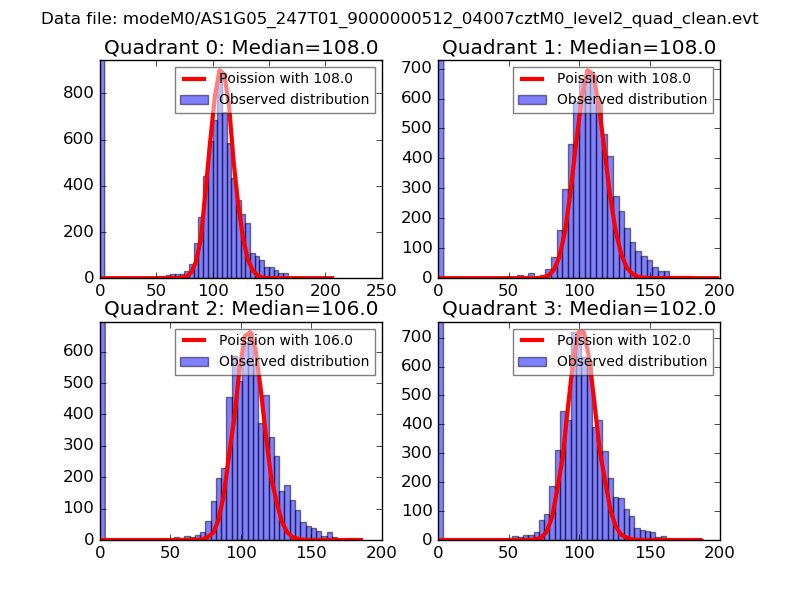 |
 |
| Quadrant-wise count rates Data is divided into 100 sec bins |
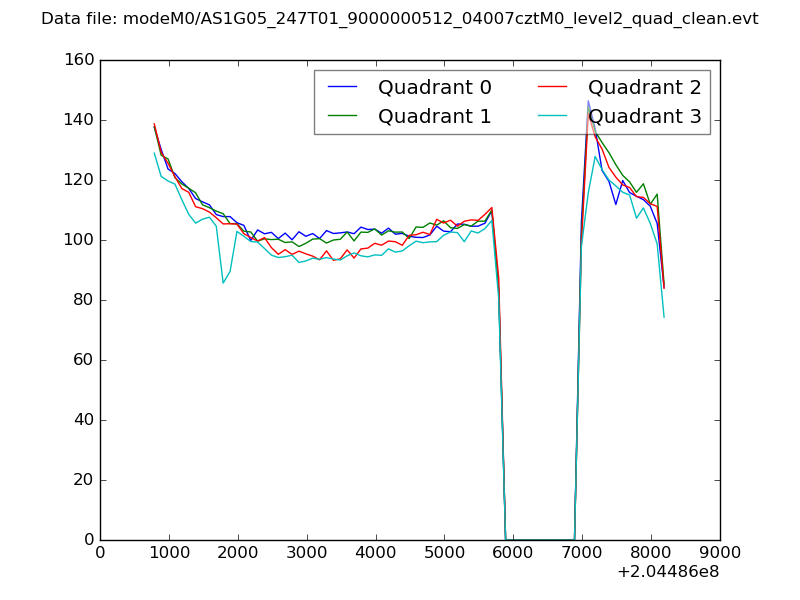 |
|
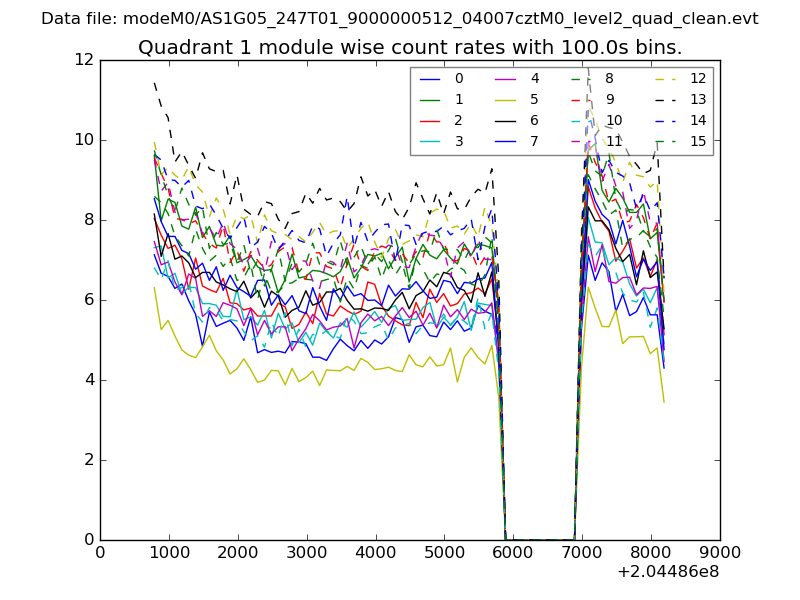
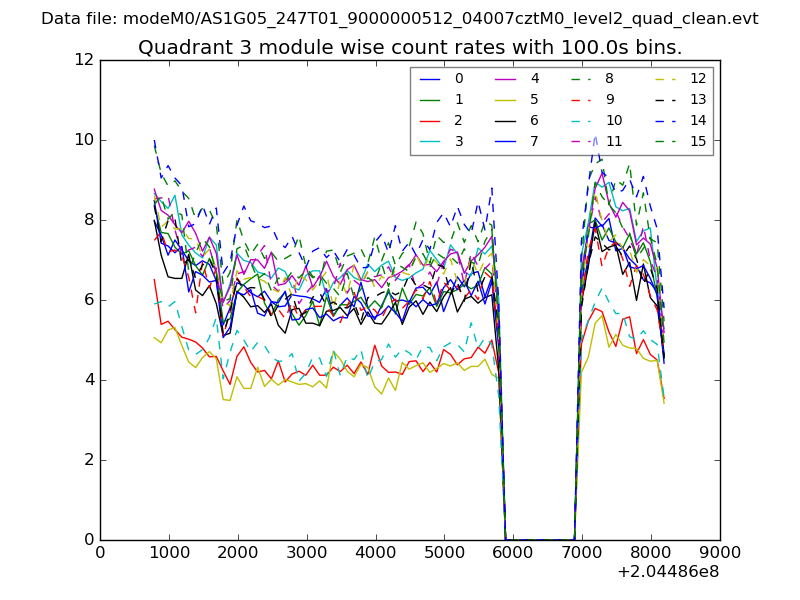
| Module-wise count rates for Quadrant A Data is divided into 100 sec bins |
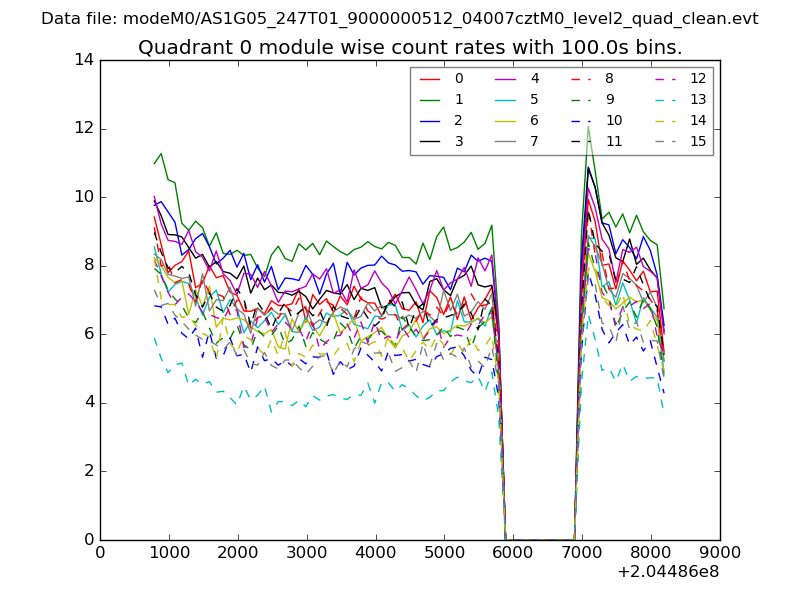 |
 |
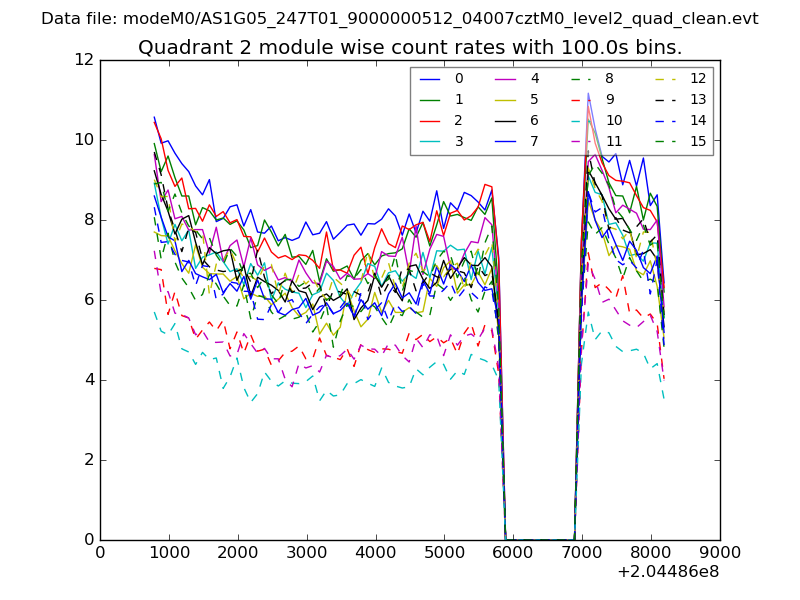
| Module-wise count rates for Quadrant B Data is divided into 100 sec bins |
 |
 |
| Module-wise count rates for Quadrant C Data is divided into 100 sec bins |
 |
 |
| Module-wise count rates for Quadrant D Data is divided into 100 sec bins |
 |
 |
| Parameter | Plot |
|---|---|
| CZT HV Monitor | 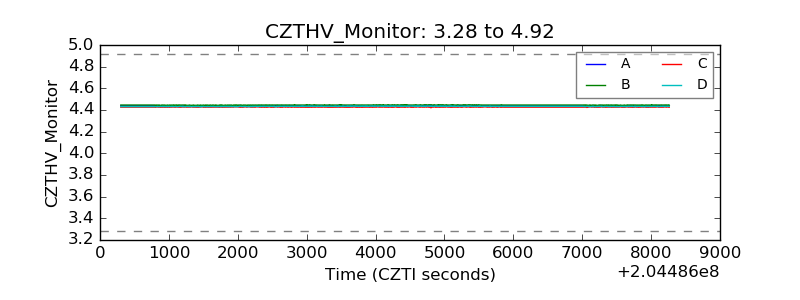 |
| D_VDD | 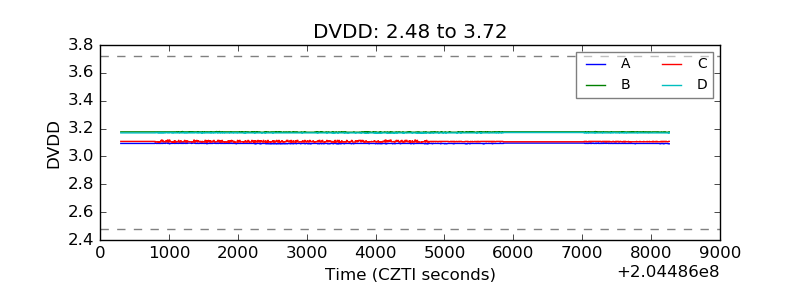 |
| Temperature 1 | 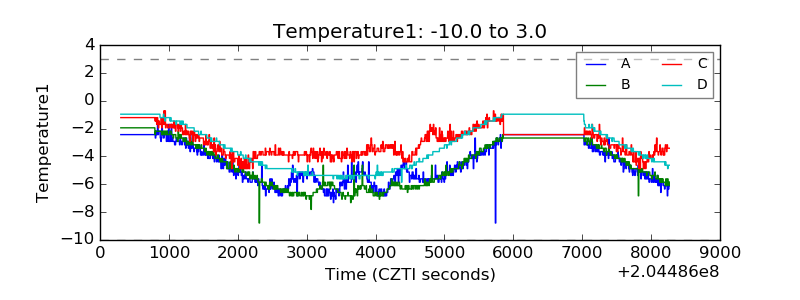 |
| Veto HV Monitor | 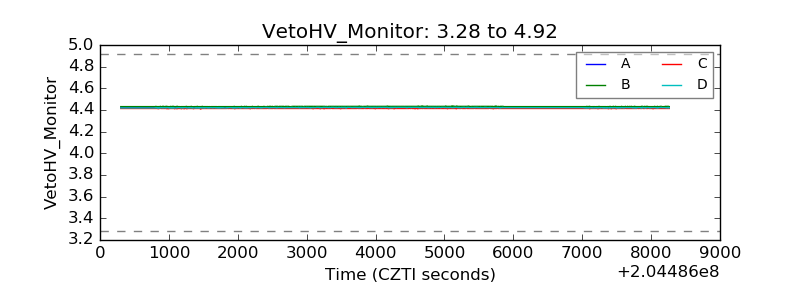 |
| Veto LLD | 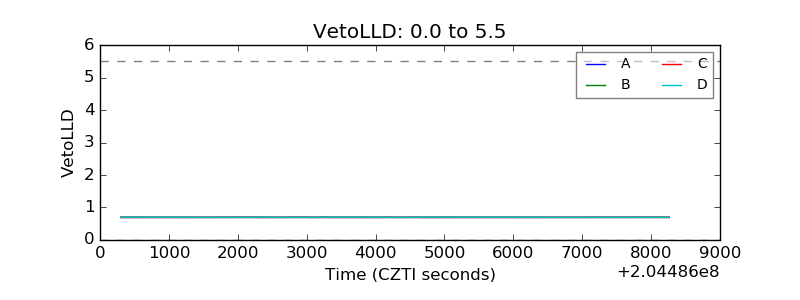 |
| Alpha Counter | 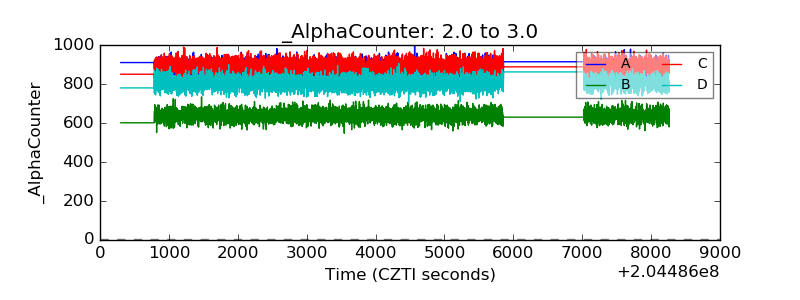 |
| _CPM_Rate | 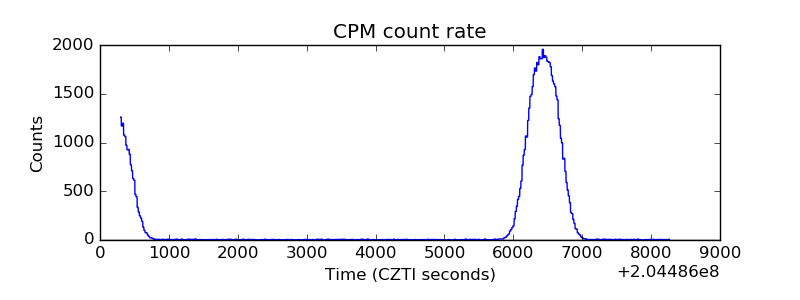 |
| CZT Counter | 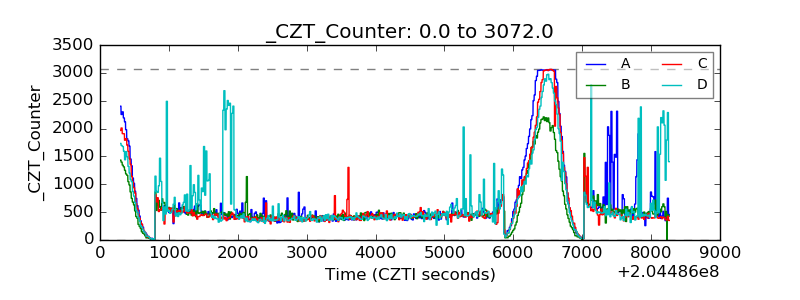 |
| +2.5 Volts monitor |  |
| +5 Volts monitor |  |
| _ROLL_ROT | 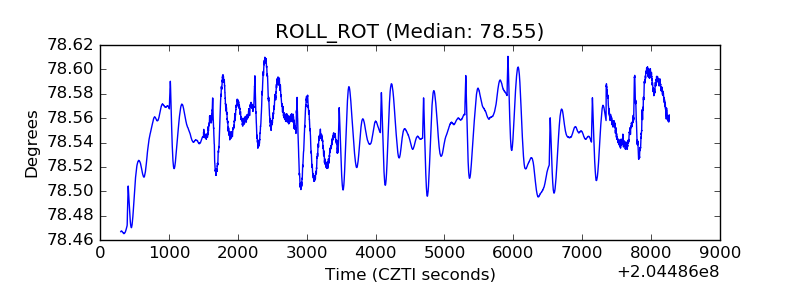 |
| _Roll_DEC | 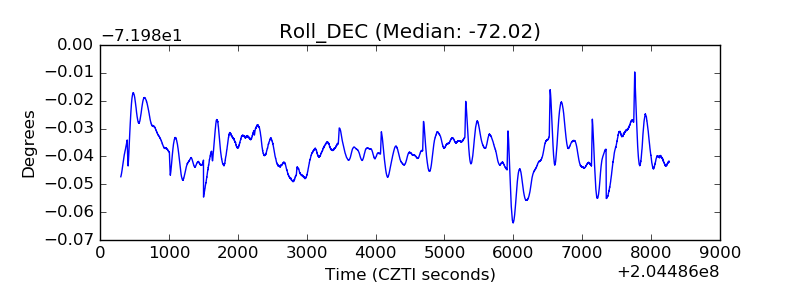 |
| _Roll_RA | 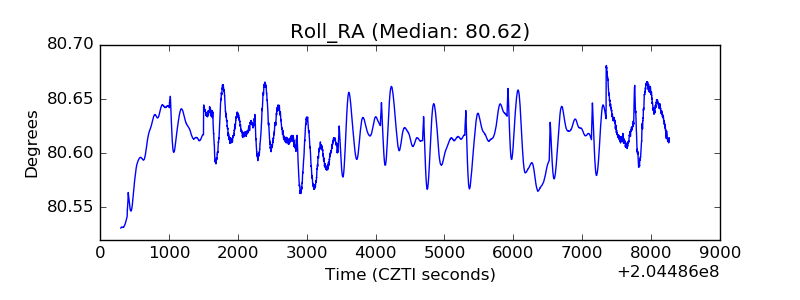 |
| Veto Counter | 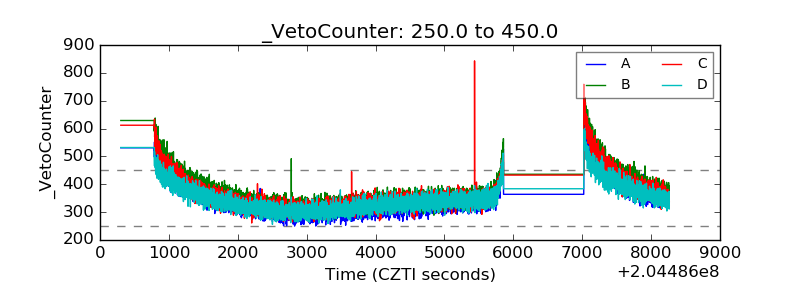 |