| Param | Original file | Final file |
|---|---|---|
| Filename | modeM0/AS1G05_247T01_9000000512_04008cztM0_level2.evt | modeM0/AS1G05_247T01_9000000512_04008cztM0_level2_quad_clean.evt |
| Size (bytes) | 507,680,640 | 104,808,960 |
| Size | 484.2 MB | 100.0 MB |
| Events in quadrant A | 3,393,840 | 700,028 |
| Events in quadrant B | 3,055,923 | 711,772 |
| Events in quadrant C | 2,765,252 | 693,099 |
| Events in quadrant D | 5,739,649 | 636,373 |
| Mode SS | |||
|---|---|---|---|
| Quadrant | BADHDUFLAG | Total packets | Discarded packets |
| A | 0 | 126 | 0 |
| B | 0 | 126 | 0 |
| C | 0 | 126 | 0 |
| D | 0 | 126 | 0 |
| Mode M9 | |||
|---|---|---|---|
| Quadrant | BADHDUFLAG | Total packets | Discarded packets |
| A | 0 | 17 | 0 |
| B | 0 | 17 | 0 |
| C | 0 | 17 | 0 |
| D | 0 | 18 | 0 |
| Mode M0 | |||
|---|---|---|---|
| Quadrant | BADHDUFLAG | Total packets | Discarded packets |
| A | 0 | 14378 | 3 |
| B | 0 | 13170 | 2 |
| C | 0 | 12669 | 2 |
| D | 0 | 21378 | 2 |
| Quadrant | Total seconds | Saturated seconds | Saturation percentage |
|---|---|---|---|
| A | 6200 | 160 | 2.580645% |
| B | 6200 | 31 | 0.500000% |
| C | 6200 | 22 | 0.354839% |
| D | 6200 | 439 | 7.080645% |
Noise dominated data is calculated using 1-second bins in cleaned event files. If a bin has >2000 counts, and if more than 50% of those come from <1% of pixels, then it is considered to be noise-dominated and hence unusable.
| Quadrant | # 1 sec bins | Bins with >0 counts | Bins with >2000 counts | High rate bins dominated by noise | Noise dominated (total time) | Noise dominated (detector-on time) | Marked lightcurve |
|---|---|---|---|---|---|---|---|
| A | 7465 | 6201 | 82 | 82 | 1.10% | 1.32% | 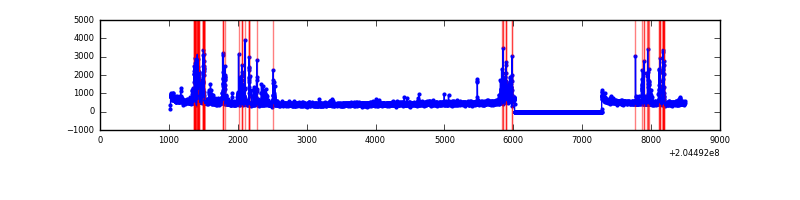 |
| B | 7465 | 6201 | 0 | 0 | 0.00% | 0.00% | 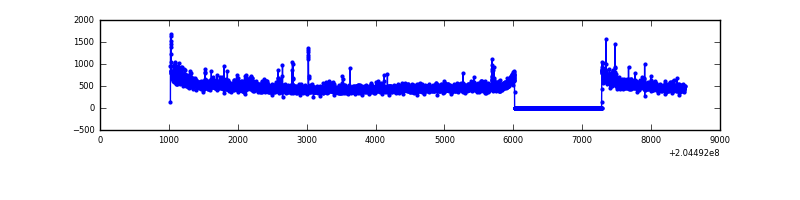 |
| C | 7465 | 6201 | 2 | 2 | 0.03% | 0.03% | 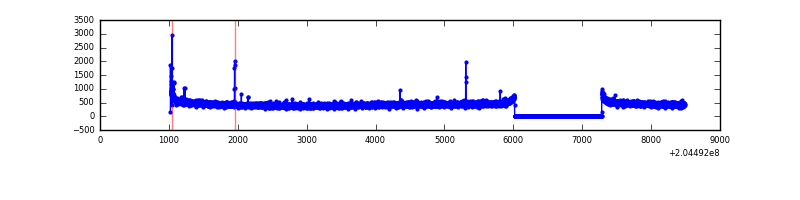 |
| D | 7465 | 6201 | 506 | 506 | 6.78% | 8.16% | 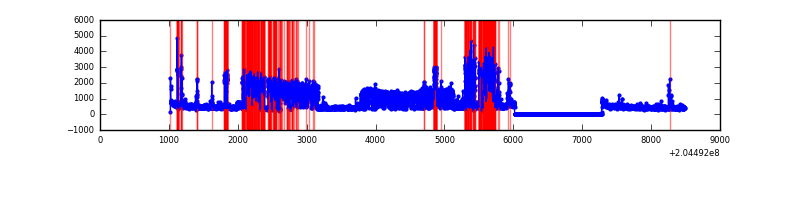 |
Top three noisy pixels from each quadrant. If the there are fewer than three noisy pixels in the level2.evt file, extra rows are filled as -1
| Pixel properties | Quadrant properties | ||||||
|---|---|---|---|---|---|---|---|
| Quadrant | DetID | PixID | Counts | Sigma | Mean | Median | Sigma |
| A | 0 | 50 | 479896 | 3280.75 | 722 | 709 | 146.1 |
| A | 0 | 118 | 52845 | 356.95 | 722 | 709 | 146.1 |
| A | 3 | 1 | 36408 | 244.41 | 722 | 709 | 146.1 |
| B | 15 | 204 | 123397 | 892.23 | 737 | 721 | 137.5 |
| B | 14 | 167 | 20079 | 140.79 | 737 | 721 | 137.5 |
| B | 4 | 81 | 18314 | 127.96 | 737 | 721 | 137.5 |
| C | 12 | 4 | 16105 | 96.16 | 699 | 702 | 160.2 |
| C | 9 | 144 | 14935 | 88.85 | 699 | 702 | 160.2 |
| C | 13 | 61 | 5948 | 32.75 | 699 | 702 | 160.2 |
| D | 9 | 82 | 2320444 | 14403.02 | 671 | 652 | 161.1 |
| D | 8 | 112 | 741176 | 4597.73 | 671 | 652 | 161.1 |
| D | 2 | 232 | 63586 | 390.74 | 671 | 652 | 161.1 |
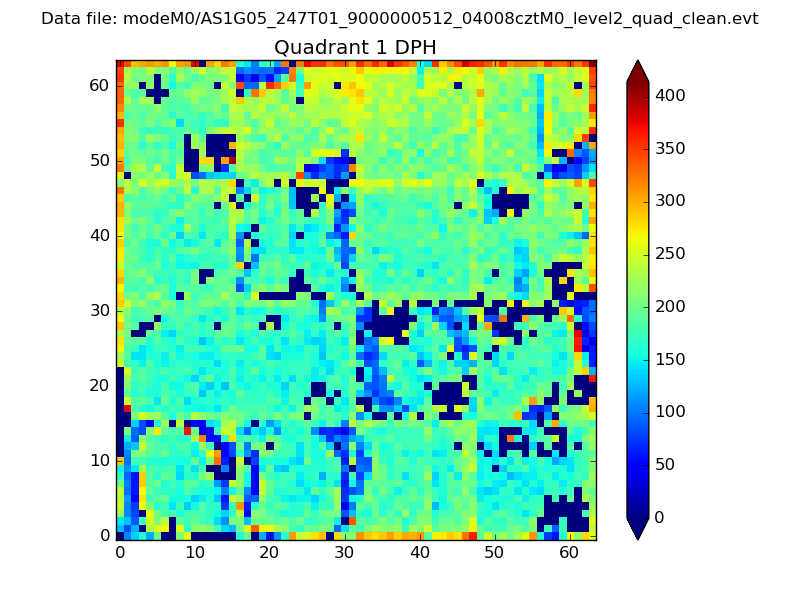
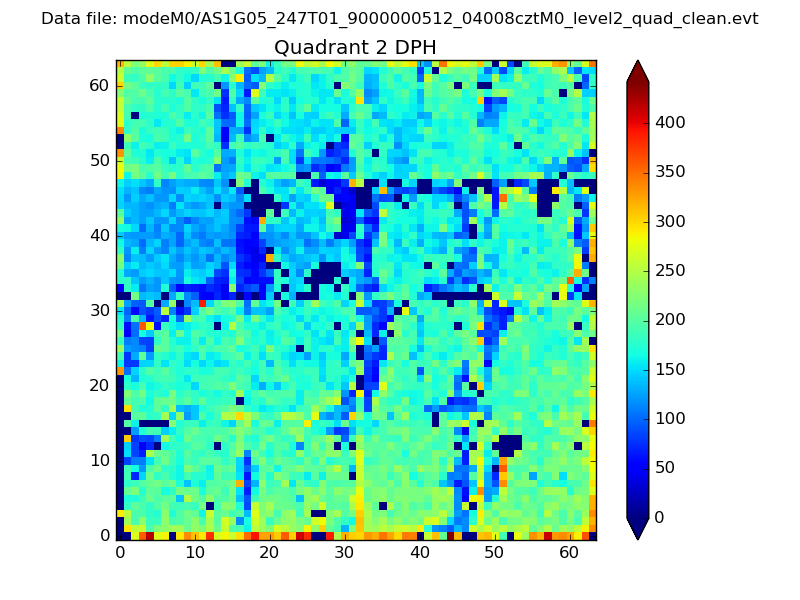
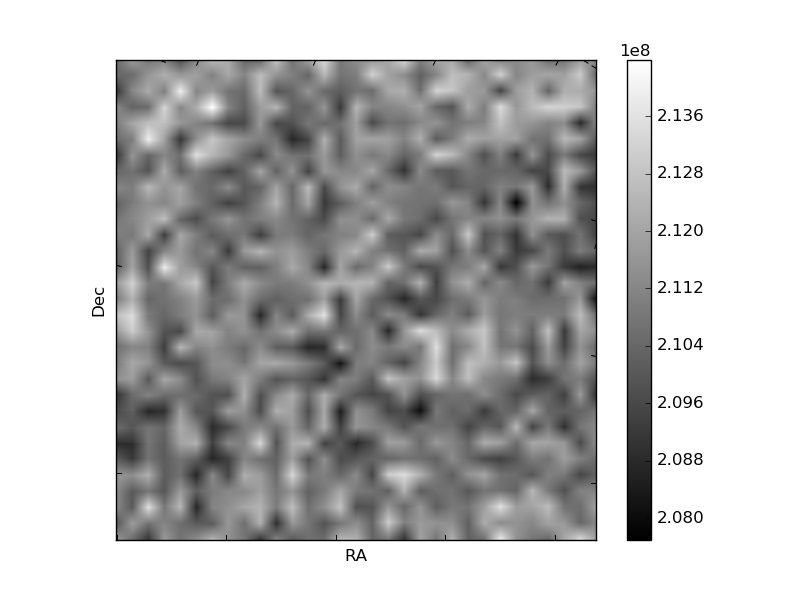
Histogram calculated using DETX and DETY for each event in the final _common_clean file
| Quadrant A |  |
 |
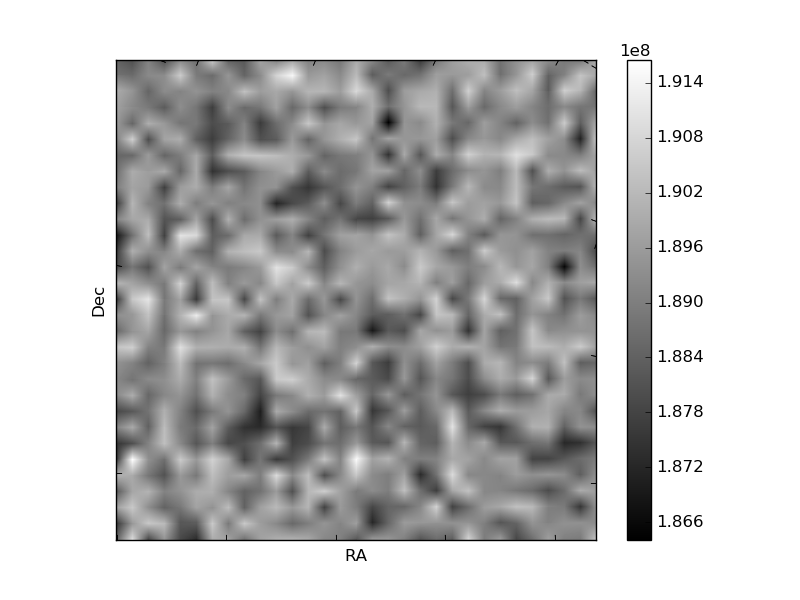
Quadrant B |
|---|---|---|---|
| Quadrant D |  |
 |
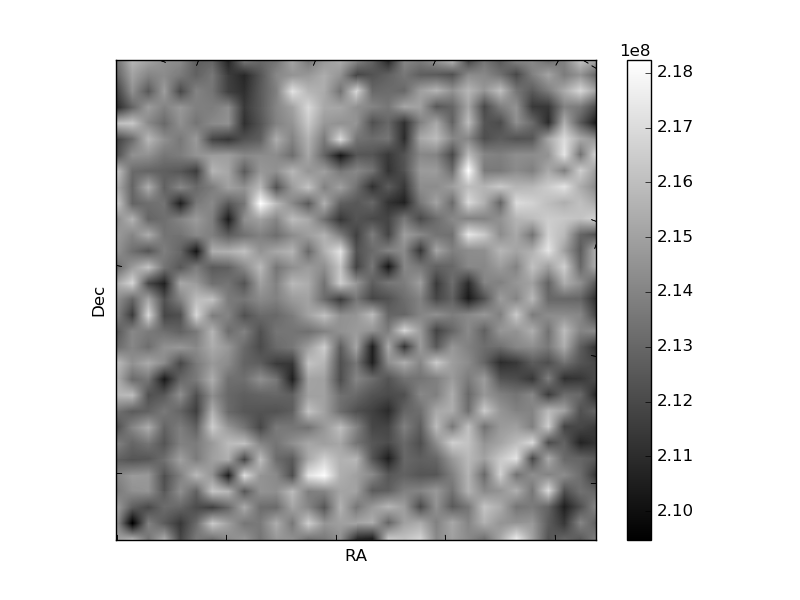
Quadrant C |
| Plot type | Count rate plots | Images |
|---|---|---|
| Comparison with Poisson distribution Blue bars denote a histogram of data divided into 1 sec bins. Red curve is a Poisson curve with rate = median count rate of data. |
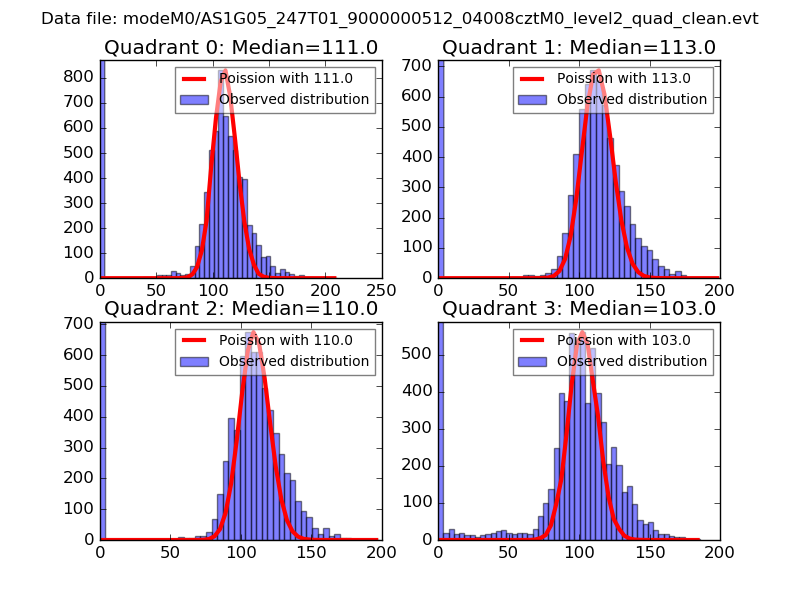 |
 |
| Quadrant-wise count rates Data is divided into 100 sec bins |
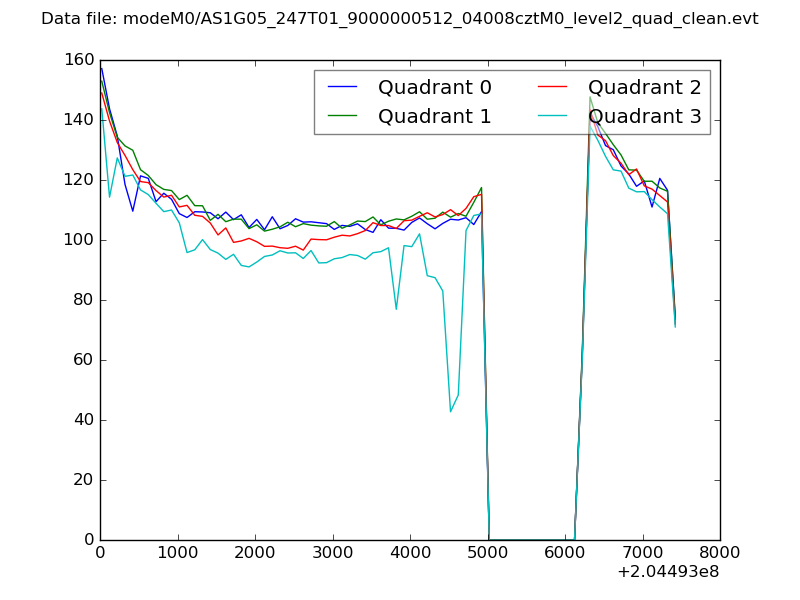 |
|
| Module-wise count rates for Quadrant A Data is divided into 100 sec bins |
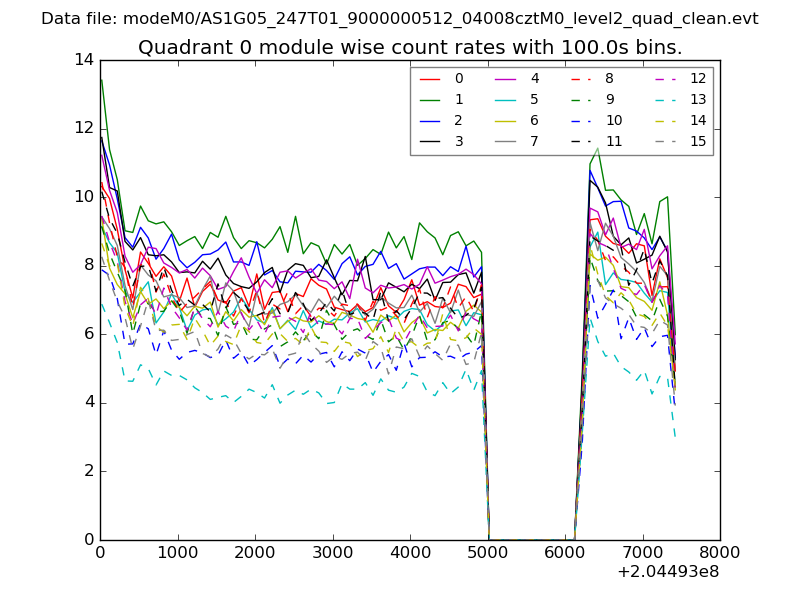 |
 |
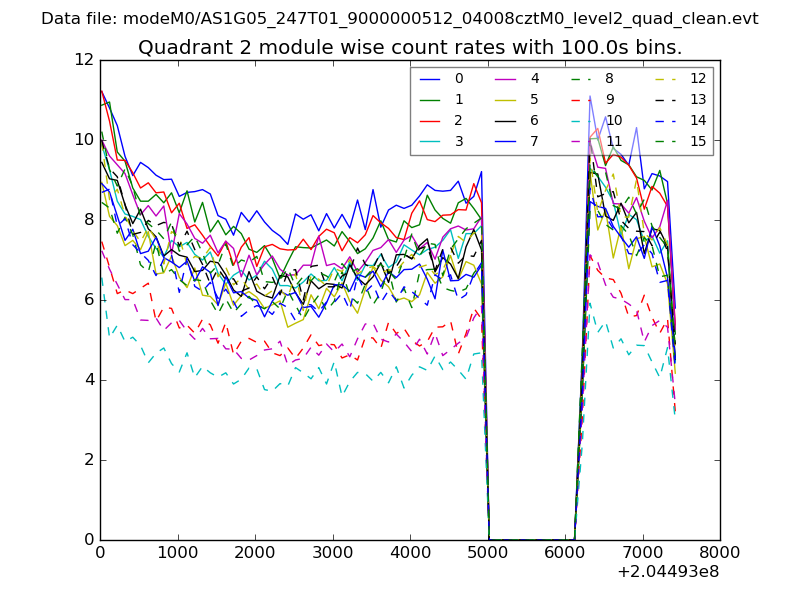
| Module-wise count rates for Quadrant B Data is divided into 100 sec bins |
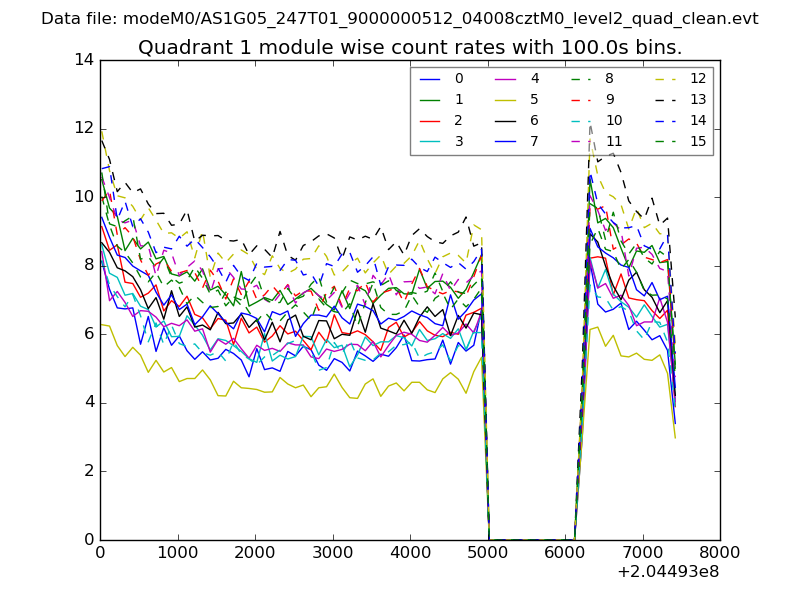 |
 |
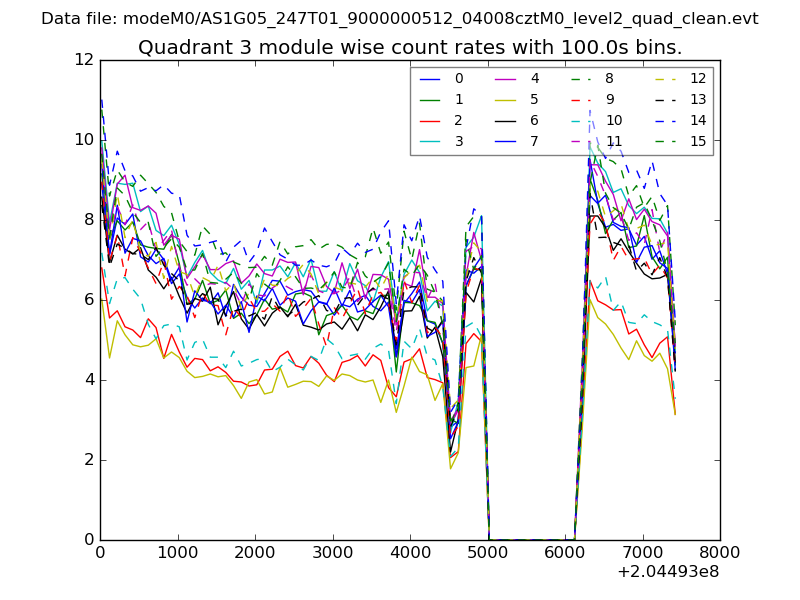
| Module-wise count rates for Quadrant C Data is divided into 100 sec bins |
 |
 |
| Module-wise count rates for Quadrant D Data is divided into 100 sec bins |
 |
 |
| Parameter | Plot |
|---|---|
| CZT HV Monitor | 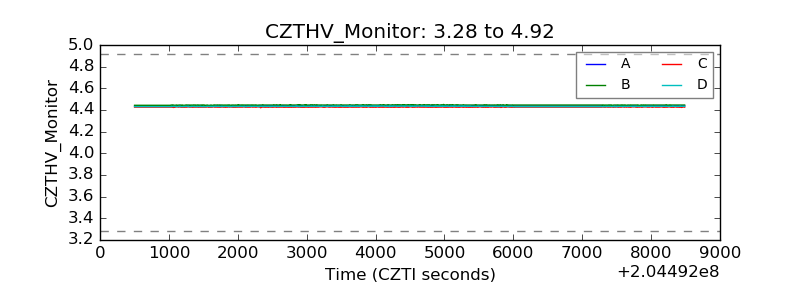 |
| D_VDD | 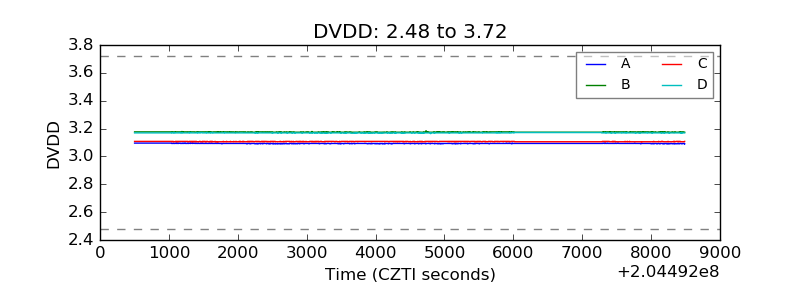 |
| Temperature 1 | 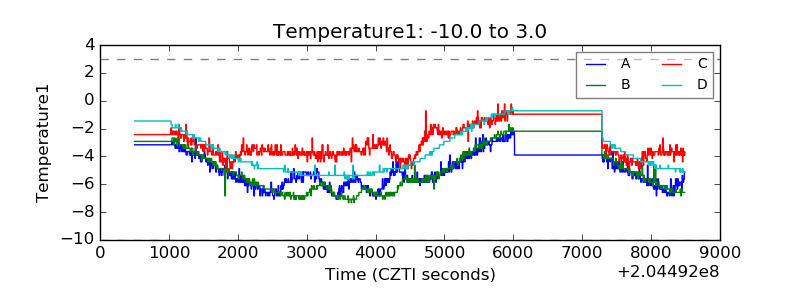 |
| Veto HV Monitor | 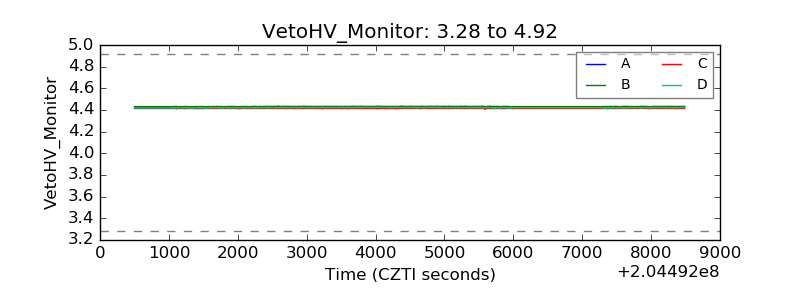 |
| Veto LLD | 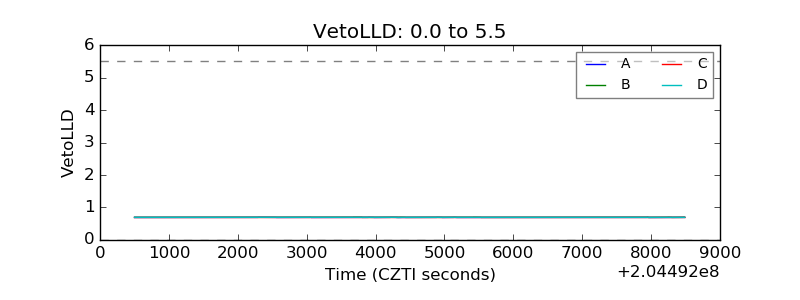 |
| Alpha Counter | 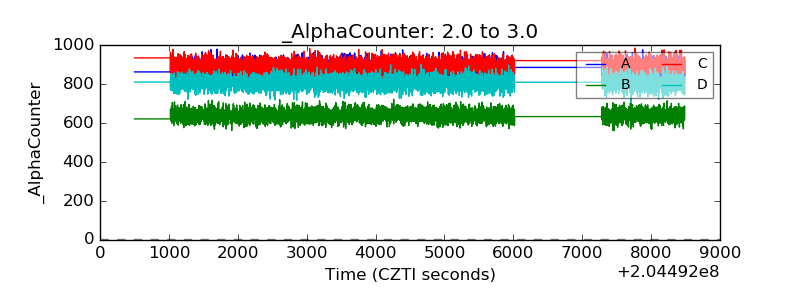 |
| _CPM_Rate | 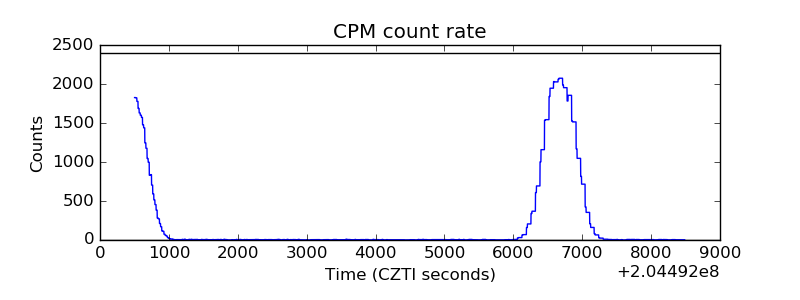 |
| CZT Counter | 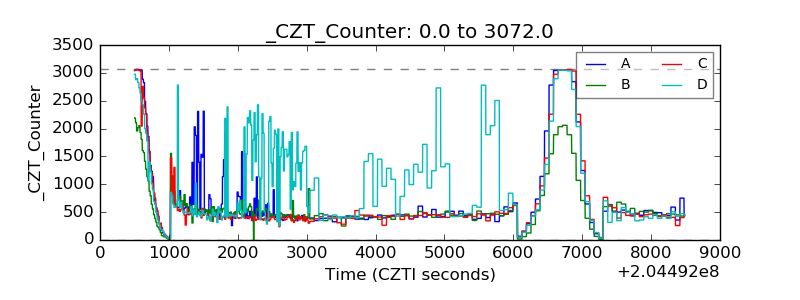 |
| +2.5 Volts monitor |  |
| +5 Volts monitor |  |
| _ROLL_ROT | 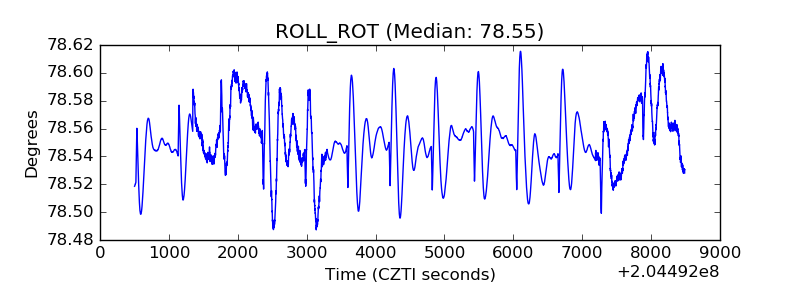 |
| _Roll_DEC | 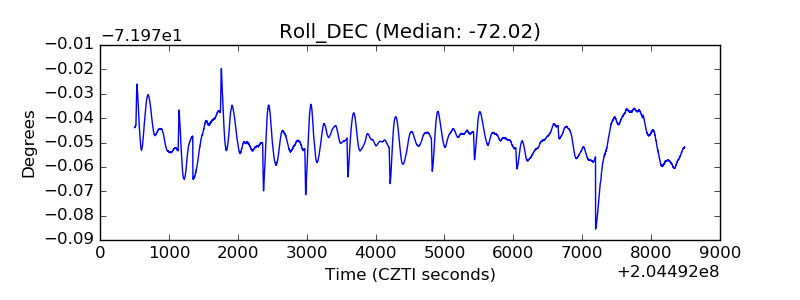 |
| _Roll_RA | 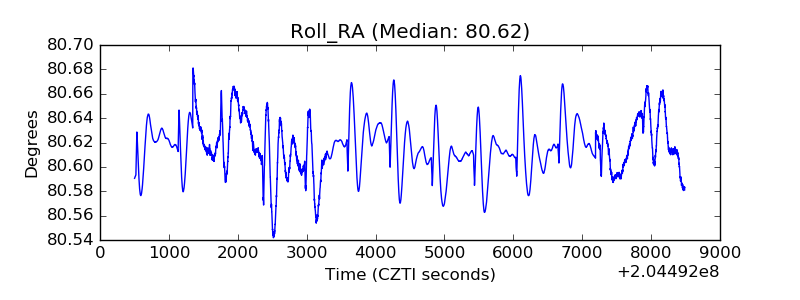 |
| Veto Counter | 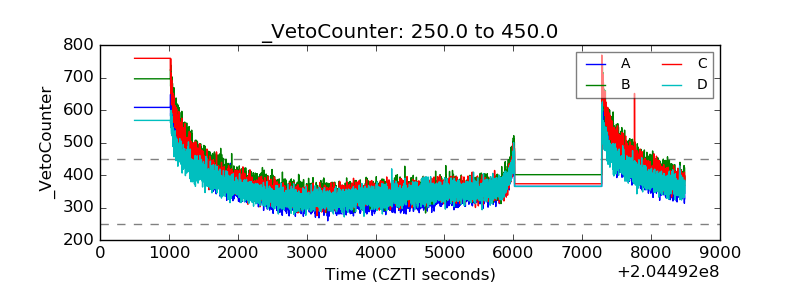 |