| Param | Original file | Final file |
|---|---|---|
| Filename | modeM0/AS1G05_247T01_9000000512_04009cztM0_level2.evt | modeM0/AS1G05_247T01_9000000512_04009cztM0_level2_quad_clean.evt |
| Size (bytes) | 1,303,421,760 | 301,654,080 |
| Size | 1.2 GB | 287.7 MB |
| Events in quadrant A | 8,972,496 | 2,007,701 |
| Events in quadrant B | 8,598,153 | 2,012,156 |
| Events in quadrant C | 8,052,987 | 1,964,473 |
| Events in quadrant D | 12,589,763 | 1,867,567 |
| Mode SS | |||
|---|---|---|---|
| Quadrant | BADHDUFLAG | Total packets | Discarded packets |
| A | 0 | 382 | 0 |
| B | 0 | 382 | 0 |
| C | 0 | 382 | 0 |
| D | 0 | 382 | 0 |
| Mode M9 | |||
|---|---|---|---|
| Quadrant | BADHDUFLAG | Total packets | Discarded packets |
| A | 0 | 34 | 0 |
| B | 0 | 34 | 0 |
| C | 0 | 34 | 0 |
| D | 0 | 34 | 0 |
| Mode M0 | |||
|---|---|---|---|
| Quadrant | BADHDUFLAG | Total packets | Discarded packets |
| A | 0 | 40099 | 3 |
| B | 0 | 38579 | 3 |
| C | 0 | 37906 | 3 |
| D | 0 | 51186 | 3 |
| Quadrant | Total seconds | Saturated seconds | Saturation percentage |
|---|---|---|---|
| A | 18641 | 260 | 1.394775% |
| B | 18641 | 97 | 0.520358% |
| C | 18641 | 60 | 0.321871% |
| D | 18641 | 694 | 3.722976% |
Noise dominated data is calculated using 1-second bins in cleaned event files. If a bin has >2000 counts, and if more than 50% of those come from <1% of pixels, then it is considered to be noise-dominated and hence unusable.
| Quadrant | # 1 sec bins | Bins with >0 counts | Bins with >2000 counts | High rate bins dominated by noise | Noise dominated (total time) | Noise dominated (detector-on time) | Marked lightcurve |
|---|---|---|---|---|---|---|---|
| A | 22156 | 18644 | 98 | 98 | 0.44% | 0.53% | 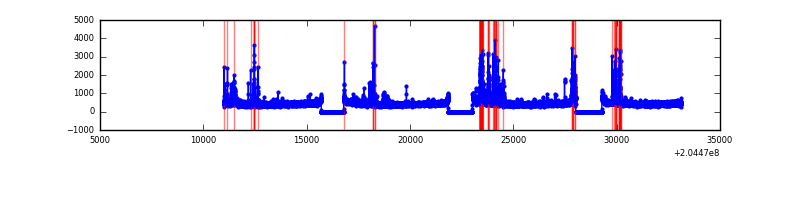 |
| B | 22156 | 18644 | 2 | 2 | 0.01% | 0.01% | 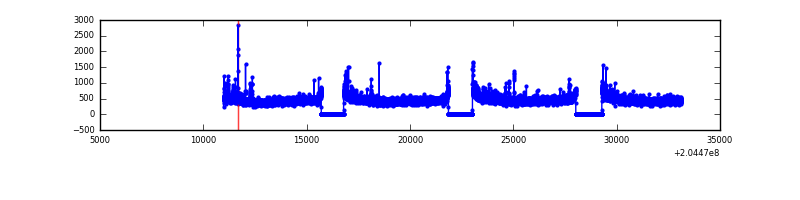 |
| C | 22156 | 18644 | 4 | 4 | 0.02% | 0.02% | 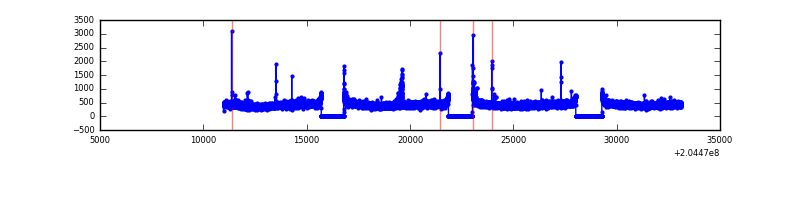 |
| D | 22156 | 18644 | 714 | 714 | 3.22% | 3.83% | 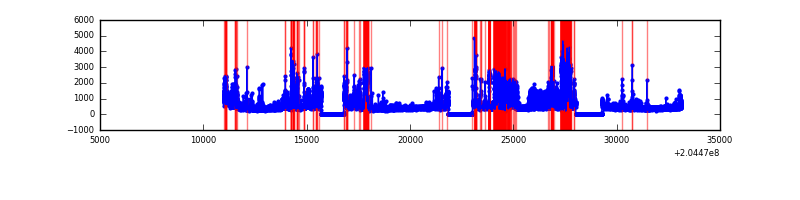 |
Top three noisy pixels from each quadrant. If the there are fewer than three noisy pixels in the level2.evt file, extra rows are filled as -1
| Pixel properties | Quadrant properties | ||||||
|---|---|---|---|---|---|---|---|
| Quadrant | DetID | PixID | Counts | Sigma | Mean | Median | Sigma |
| A | 0 | 50 | 552439 | 1308.81 | 2088 | 2045 | 420.5 |
| A | 0 | 118 | 215628 | 507.89 | 2088 | 2045 | 420.5 |
| A | 3 | 1 | 76903 | 178.01 | 2088 | 2045 | 420.5 |
| B | 15 | 204 | 169604 | 427.64 | 2119 | 2075 | 391.8 |
| B | 14 | 167 | 49704 | 121.58 | 2119 | 2075 | 391.8 |
| B | 10 | 16 | 37892 | 91.43 | 2119 | 2075 | 391.8 |
| C | 9 | 144 | 73437 | 153.91 | 2027 | 2038 | 463.9 |
| C | 12 | 4 | 30678 | 61.74 | 2027 | 2038 | 463.9 |
| C | 13 | 61 | 17357 | 33.02 | 2027 | 2038 | 463.9 |
| D | 9 | 82 | 2748273 | 5824.08 | 1986 | 1931 | 471.5 |
| D | 8 | 112 | 807011 | 1707.31 | 1986 | 1931 | 471.5 |
| D | 10 | 246 | 774948 | 1639.31 | 1986 | 1931 | 471.5 |
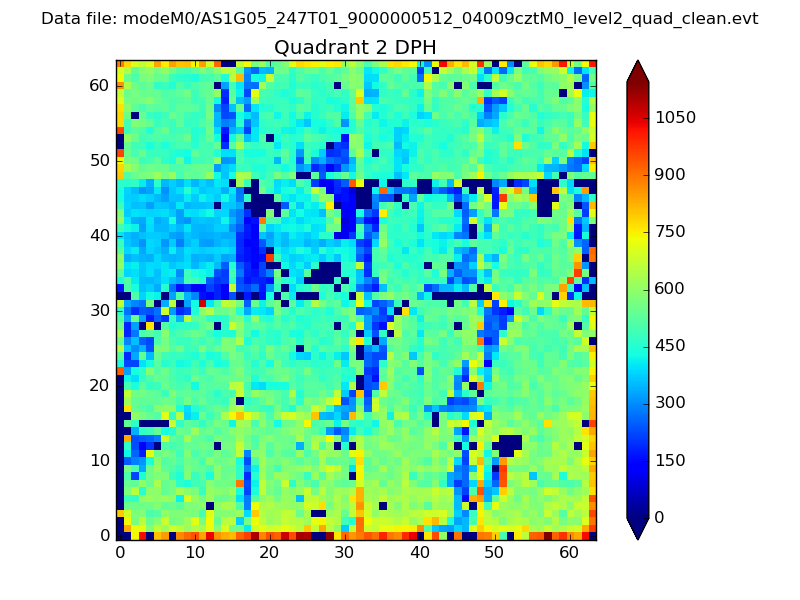
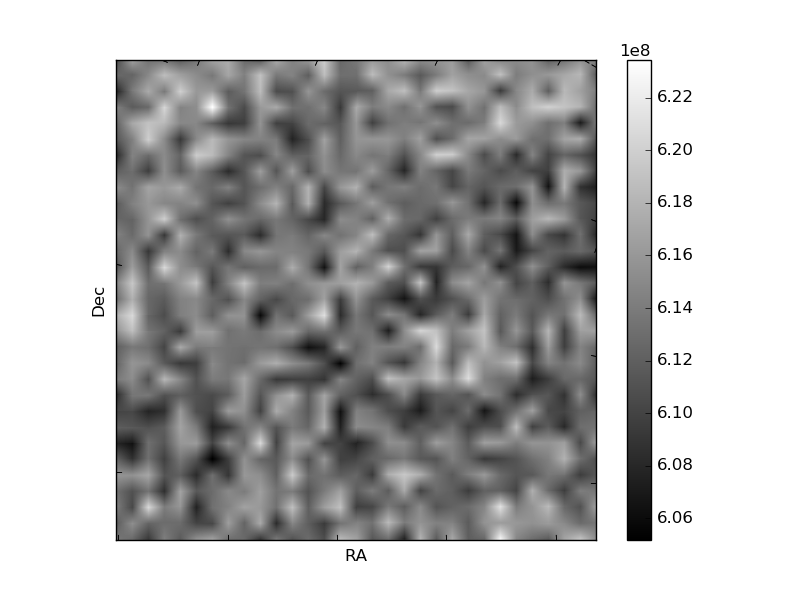
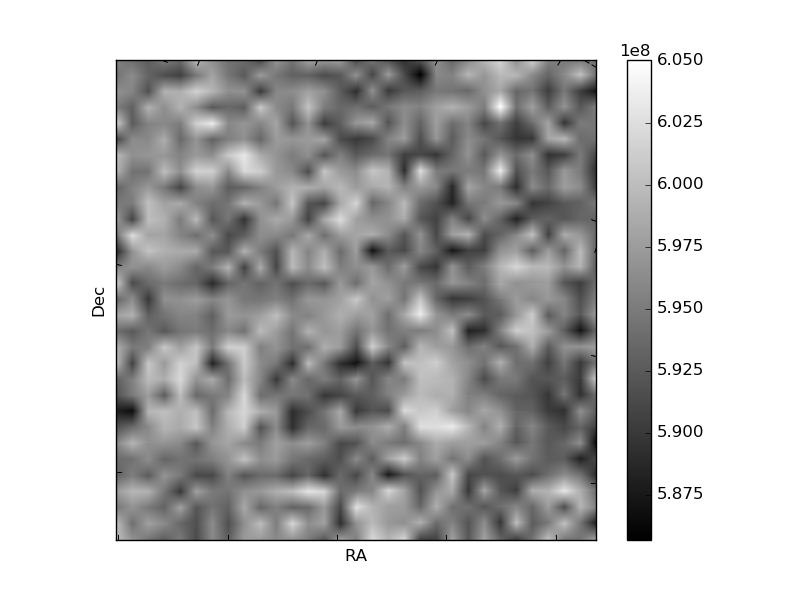
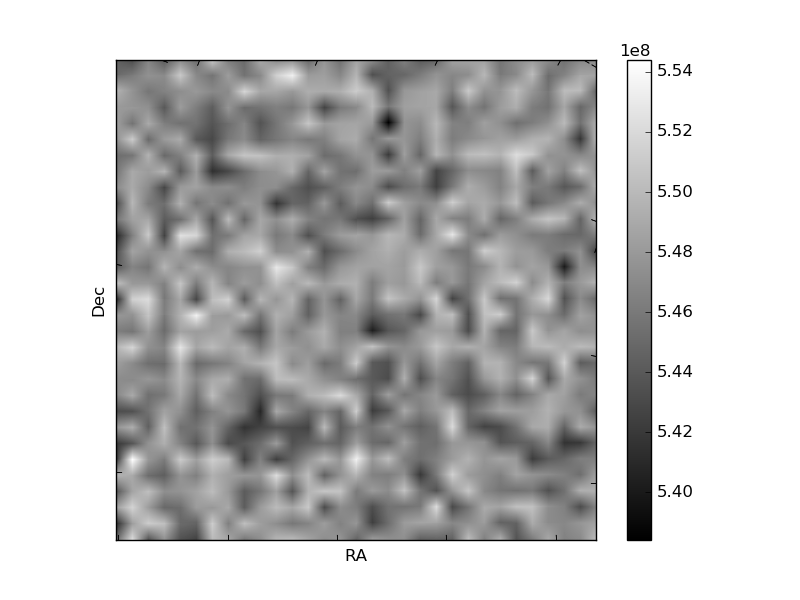
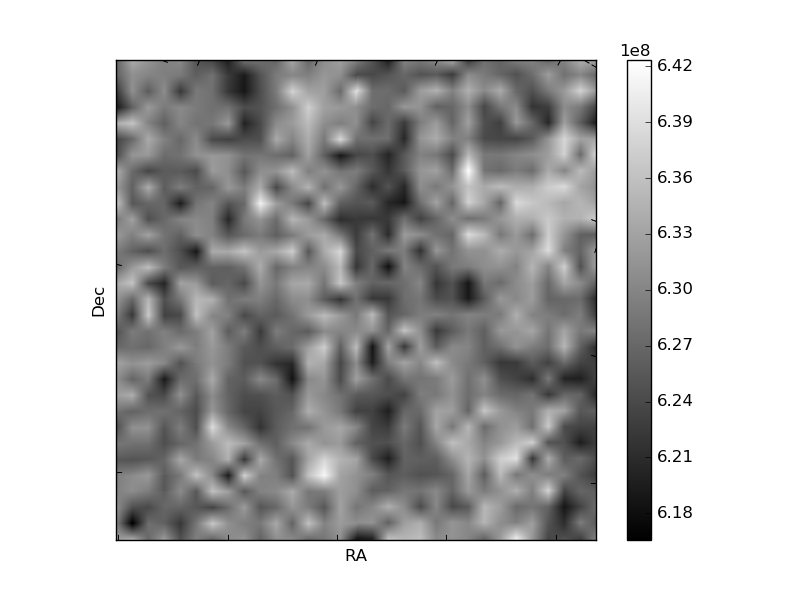
Histogram calculated using DETX and DETY for each event in the final _common_clean file
| Quadrant A | 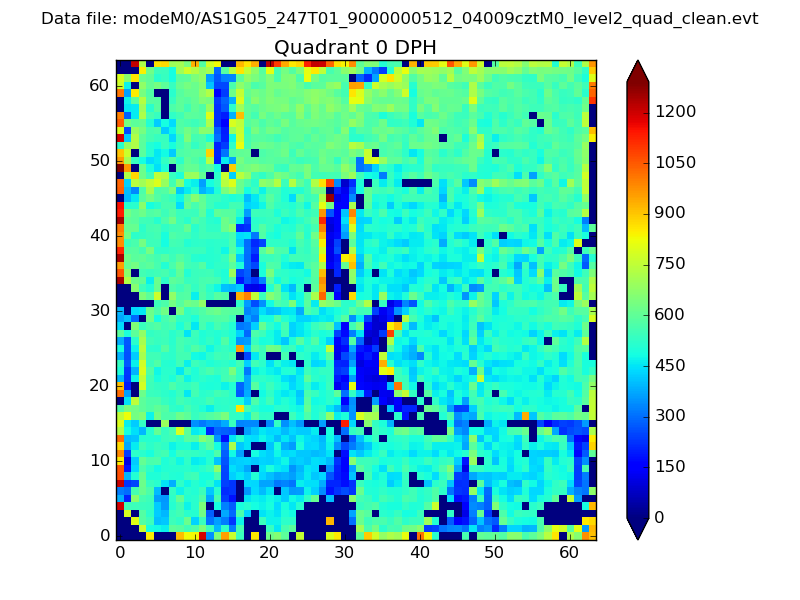 |
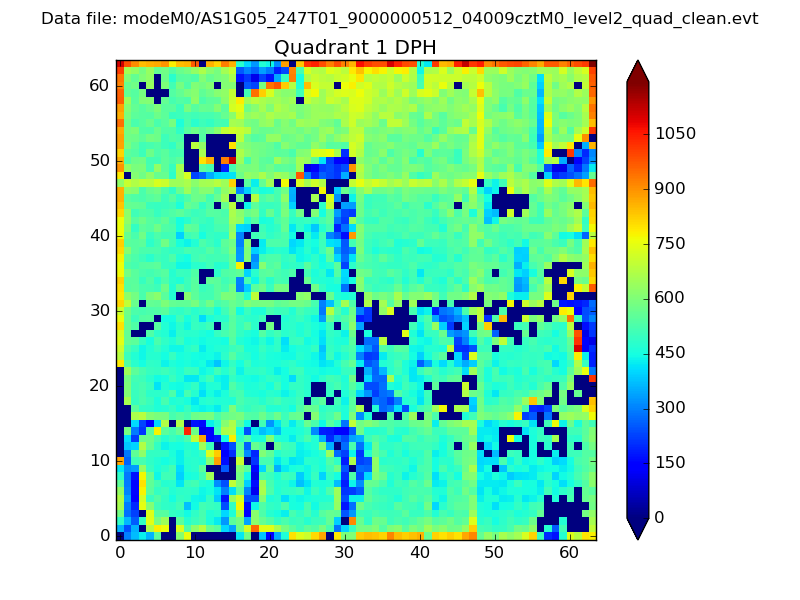 |
Quadrant B |
|---|---|---|---|
| Quadrant D | 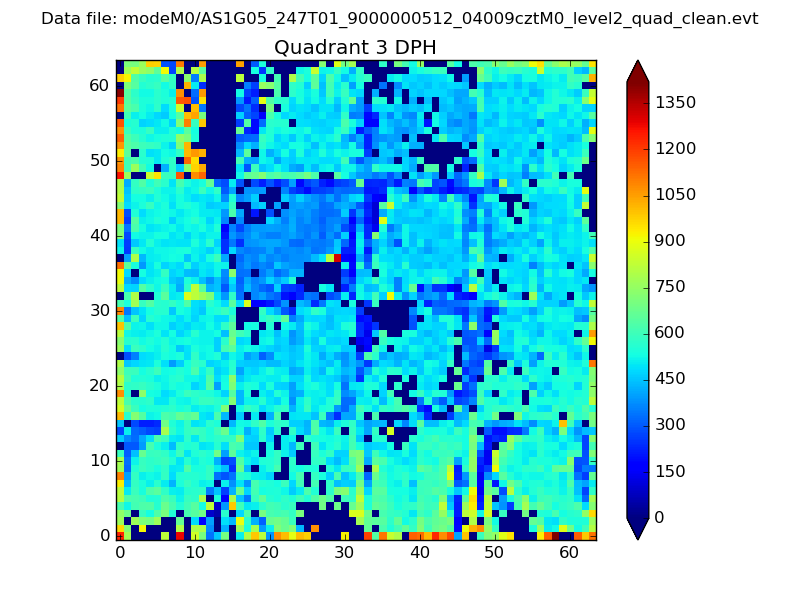 |
 |
Quadrant C |
| Plot type | Count rate plots | Images |
|---|---|---|
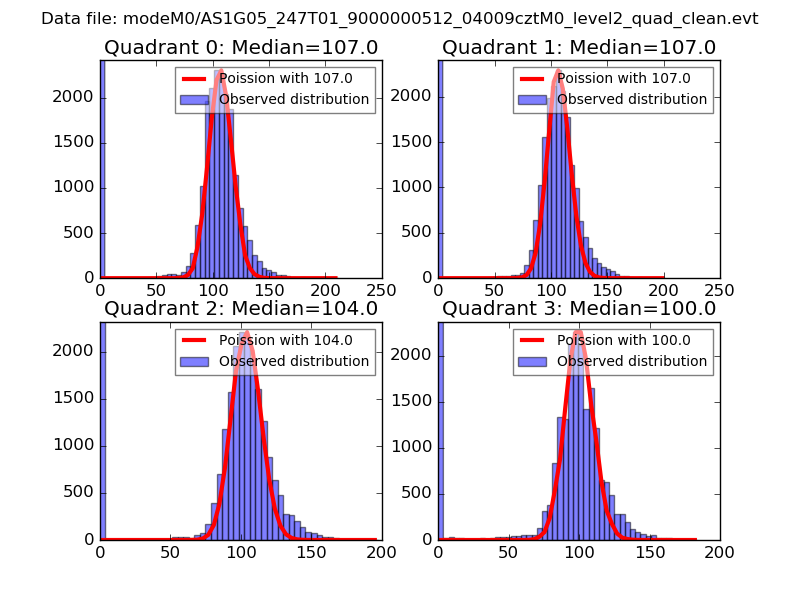
| Comparison with Poisson distribution Blue bars denote a histogram of data divided into 1 sec bins. Red curve is a Poisson curve with rate = median count rate of data. |
 |
 |
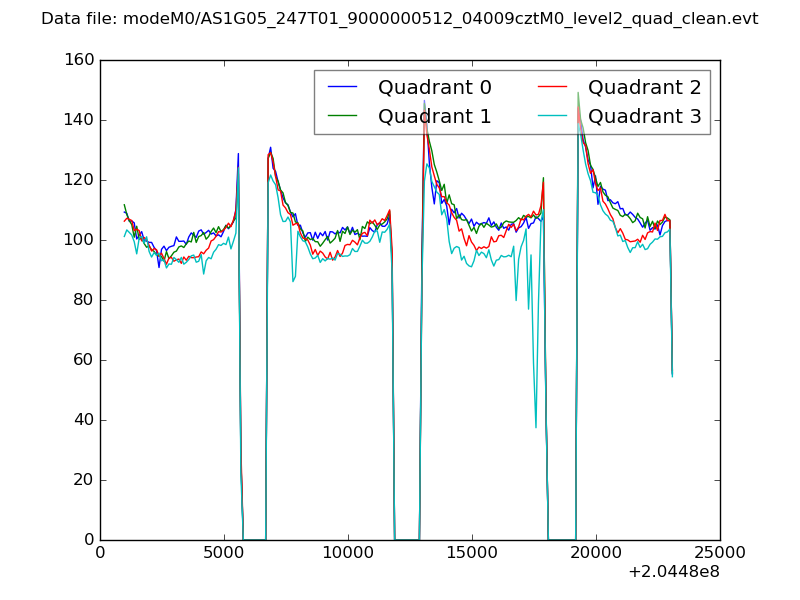
| Quadrant-wise count rates Data is divided into 100 sec bins |
 |
|
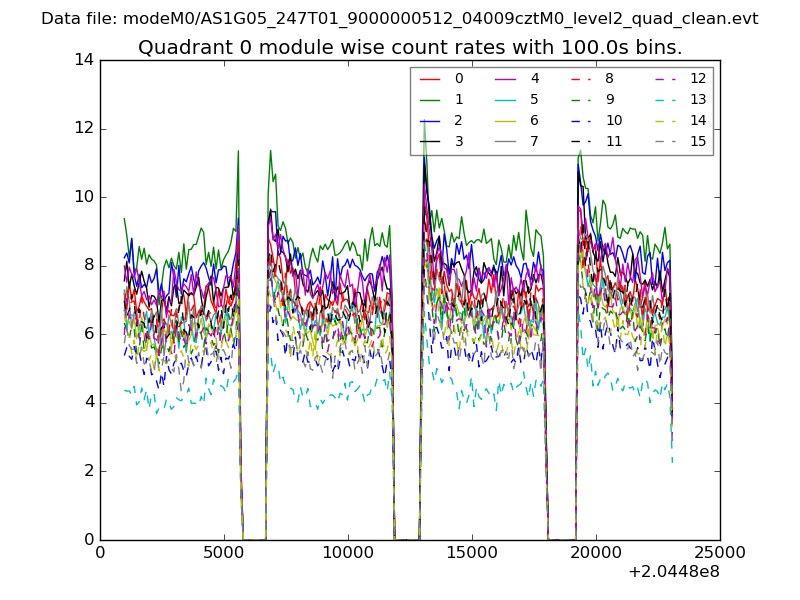
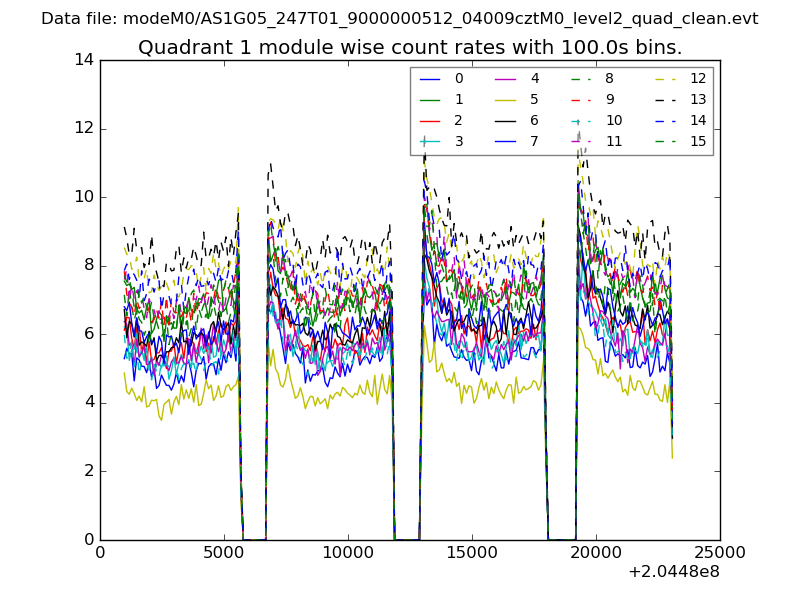
| Module-wise count rates for Quadrant A Data is divided into 100 sec bins |
 |
 |
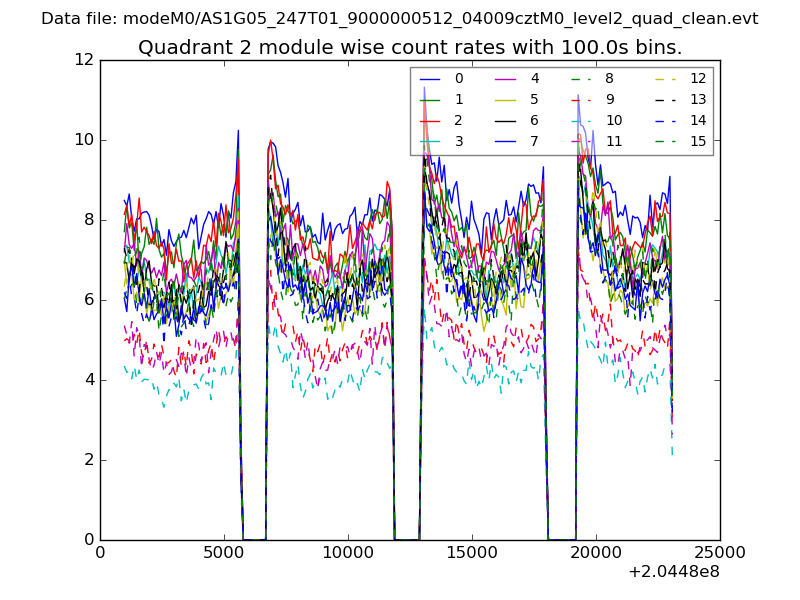
| Module-wise count rates for Quadrant B Data is divided into 100 sec bins |
 |
 |
| Module-wise count rates for Quadrant C Data is divided into 100 sec bins |
 |
 |
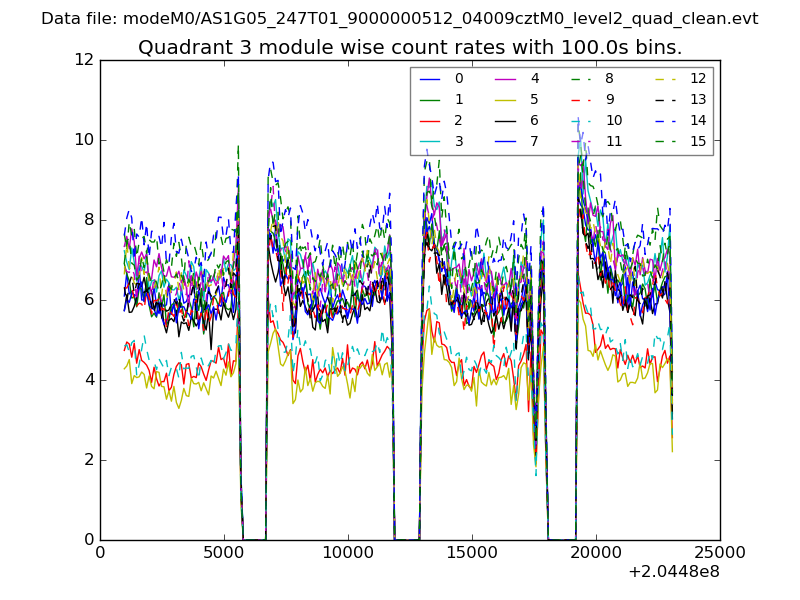
| Module-wise count rates for Quadrant D Data is divided into 100 sec bins |
 |
 |
| Parameter | Plot |
|---|---|
| CZT HV Monitor | 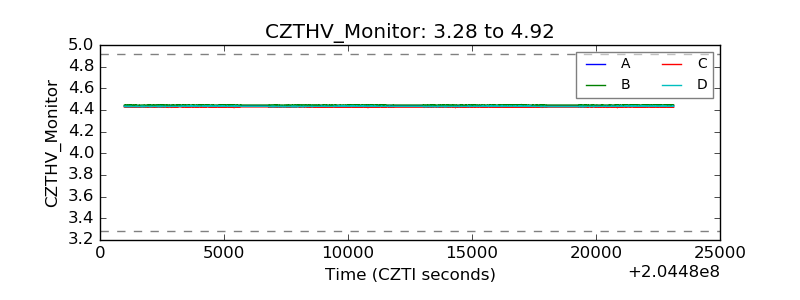 |
| D_VDD | 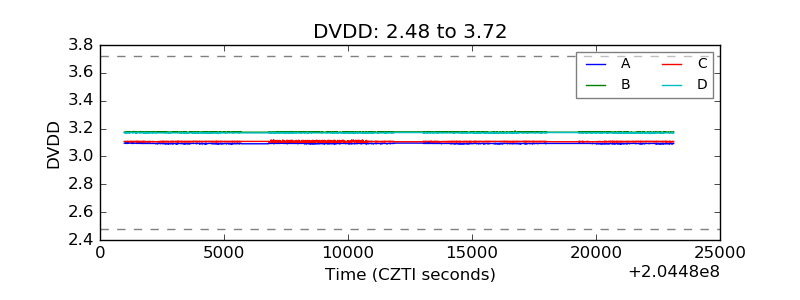 |
| Temperature 1 | 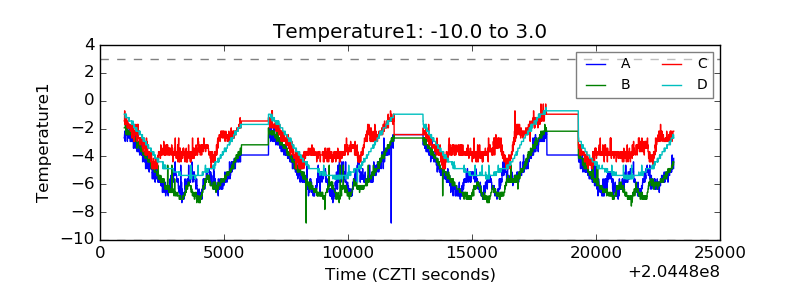 |
| Veto HV Monitor | 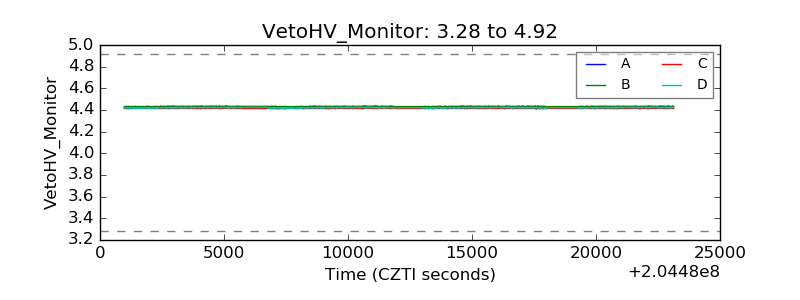 |
| Veto LLD | 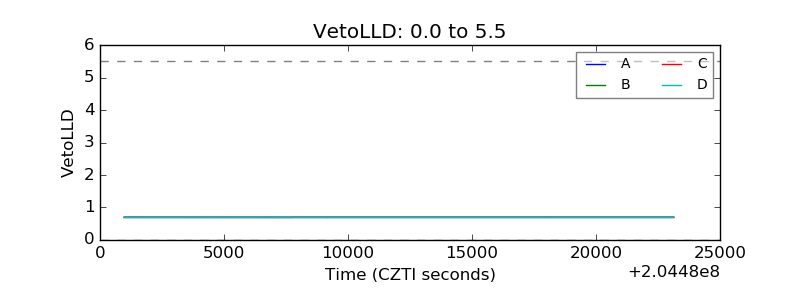 |
| Alpha Counter | 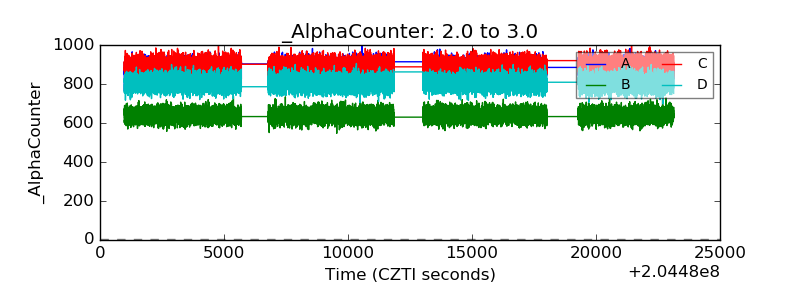 |
| _CPM_Rate | 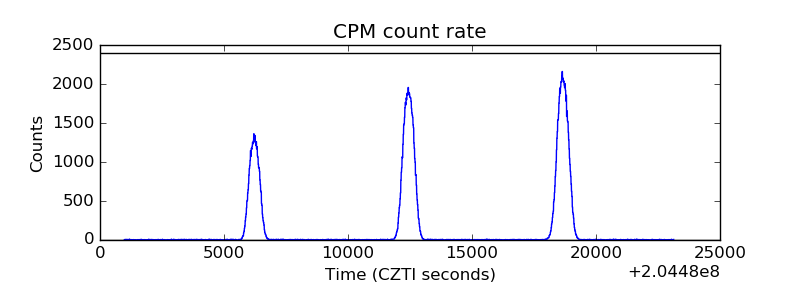 |
| CZT Counter | 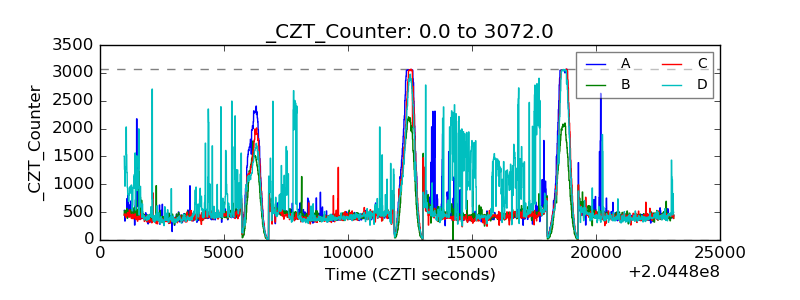 |
| +2.5 Volts monitor |  |
| +5 Volts monitor |  |
| _ROLL_ROT | 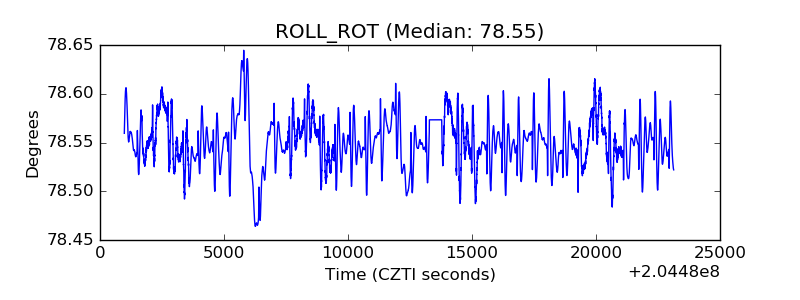 |
| _Roll_DEC | 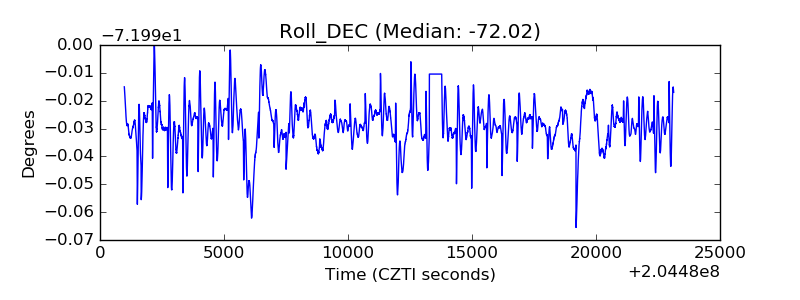 |
| _Roll_RA | 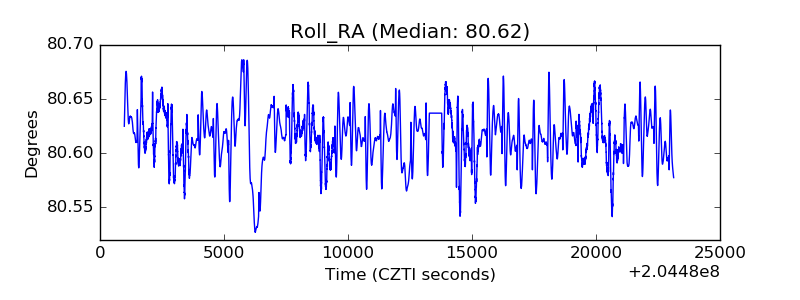 |
| Veto Counter | 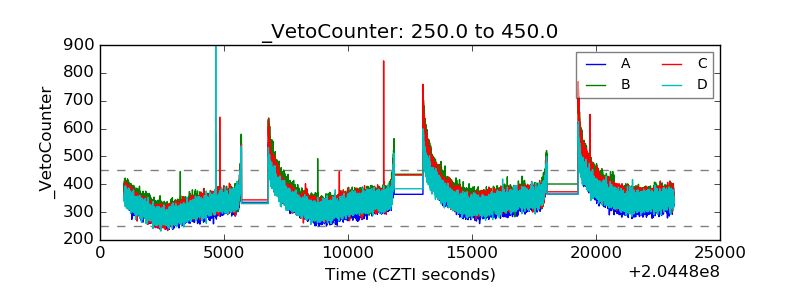 |