| Param | Original file | Final file |
|---|---|---|
| Filename | modeM0/AS1SLEW_01234_9000000509_03974cztM0_level2.evt | modeM0/AS1SLEW_01234_9000000509_03974cztM0_level2_quad_clean.evt |
| Size (bytes) | 86,008,320 | 21,741,120 |
| Size | 82.0 MB | 20.7 MB |
| Events in quadrant A | 656,979 | 140,587 |
| Events in quadrant B | 647,517 | 139,181 |
| Events in quadrant C | 568,743 | 140,576 |
| Events in quadrant D | 637,161 | 137,167 |
| Mode SS | |||
|---|---|---|---|
| Quadrant | BADHDUFLAG | Total packets | Discarded packets |
| A | 0 | 26 | 0 |
| B | 0 | 26 | 0 |
| C | 0 | 26 | 0 |
| D | 0 | 26 | 0 |
| Mode M0 | |||
|---|---|---|---|
| Quadrant | BADHDUFLAG | Total packets | Discarded packets |
| A | 0 | 2909 | 0 |
| B | 0 | 2790 | 0 |
| C | 0 | 2711 | 0 |
| D | 0 | 2910 | 0 |
| Quadrant | Total seconds | Saturated seconds | Saturation percentage |
|---|---|---|---|
| A | 1346 | 3 | 0.222883% |
| B | 1346 | 3 | 0.222883% |
| C | 1346 | 0 | 0.000000% |
| D | 1346 | 10 | 0.742942% |
Noise dominated data is calculated using 1-second bins in cleaned event files. If a bin has >2000 counts, and if more than 50% of those come from <1% of pixels, then it is considered to be noise-dominated and hence unusable.
| Quadrant | # 1 sec bins | Bins with >0 counts | Bins with >2000 counts | High rate bins dominated by noise | Noise dominated (total time) | Noise dominated (detector-on time) | Marked lightcurve |
|---|---|---|---|---|---|---|---|
| A | 1346 | 1346 | 4 | 4 | 0.30% | 0.30% |  |
| B | 1346 | 1346 | 1 | 1 | 0.07% | 0.07% | 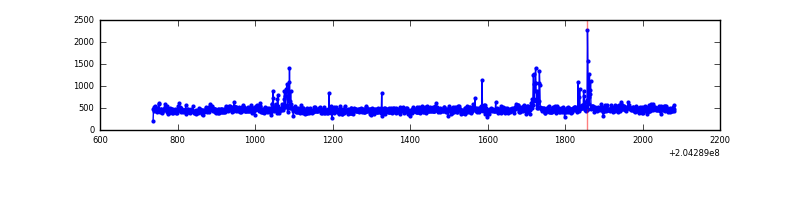 |
| C | 1346 | 1346 | 0 | 0 | 0.00% | 0.00% | 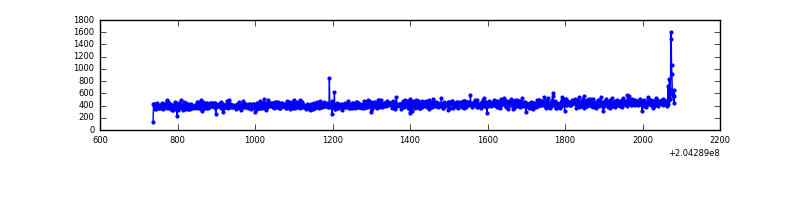 |
| D | 1346 | 1346 | 10 | 10 | 0.74% | 0.74% |  |
Top three noisy pixels from each quadrant. If the there are fewer than three noisy pixels in the level2.evt file, extra rows are filled as -1
| Pixel properties | Quadrant properties | ||||||
|---|---|---|---|---|---|---|---|
| Quadrant | DetID | PixID | Counts | Sigma | Mean | Median | Sigma |
| A | 0 | 50 | 74522 | 2297.76 | 147 | 144 | 32.4 |
| A | 0 | 118 | 8024 | 243.44 | 147 | 144 | 32.4 |
| A | 13 | 210 | 2688 | 78.59 | 147 | 144 | 32.4 |
| B | 14 | 167 | 33494 | 1054.18 | 151 | 147 | 31.6 |
| B | 15 | 204 | 16436 | 514.94 | 151 | 147 | 31.6 |
| B | 3 | 0 | 8605 | 267.38 | 151 | 147 | 31.6 |
| C | 9 | 144 | 5650 | 154.84 | 143 | 144 | 35.6 |
| C | 13 | 61 | 1243 | 30.91 | 143 | 144 | 35.6 |
| C | 4 | 112 | 388 | 6.86 | 143 | 144 | 35.6 |
| D | 2 | 232 | 24497 | 676.4 | 140 | 136 | 36.0 |
| D | 12 | 233 | 23124 | 638.28 | 140 | 136 | 36.0 |
| D | 13 | 239 | 22997 | 634.75 | 140 | 136 | 36.0 |
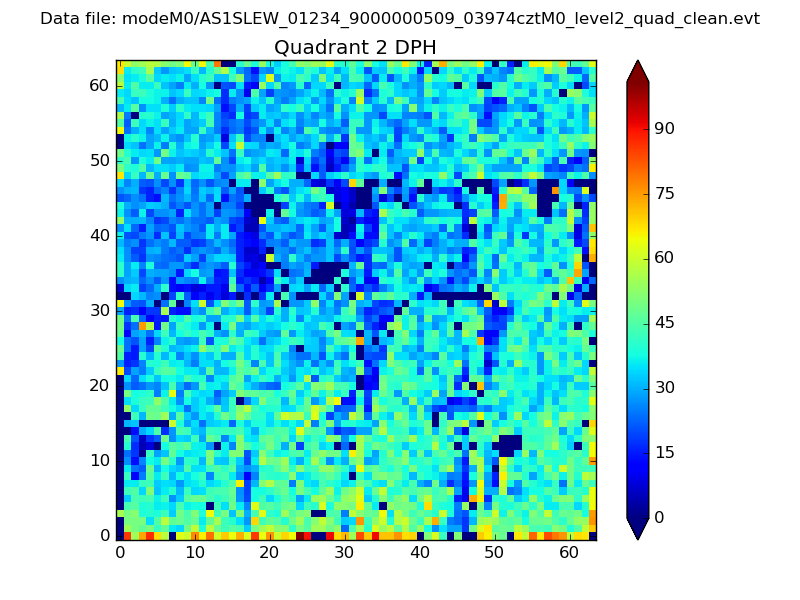
Histogram calculated using DETX and DETY for each event in the final _common_clean file
| Quadrant A | 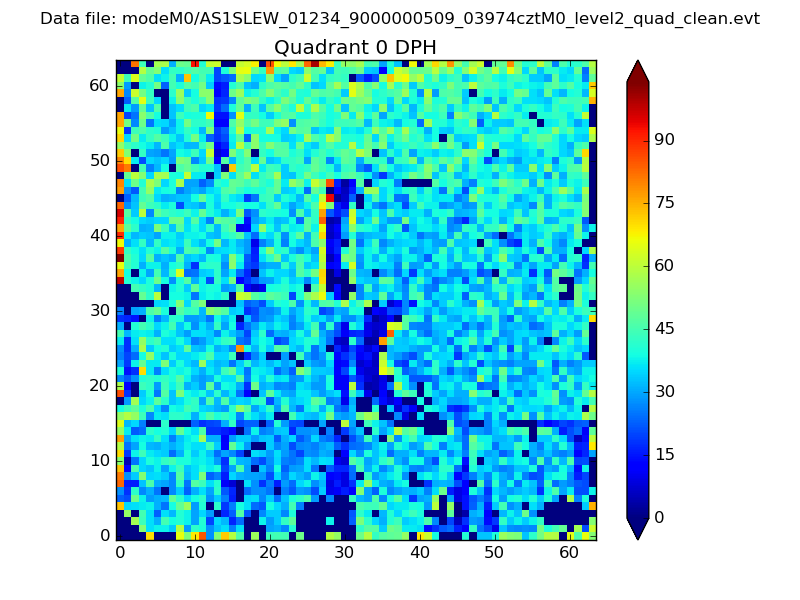 |
 |
Quadrant B |
|---|---|---|---|
| Quadrant D | 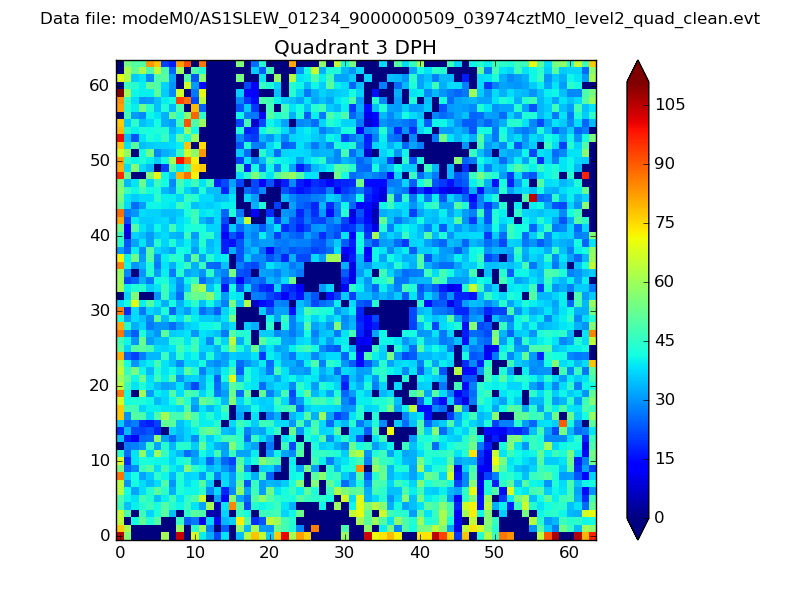 |
 |
Quadrant C |
| Plot type | Count rate plots | Images |
|---|---|---|
| Comparison with Poisson distribution Blue bars denote a histogram of data divided into 1 sec bins. Red curve is a Poisson curve with rate = median count rate of data. |
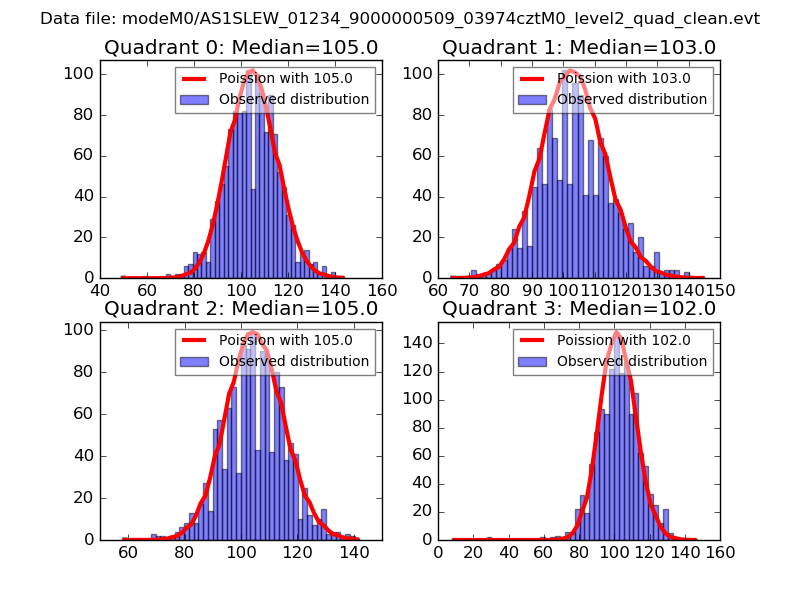 |
 |
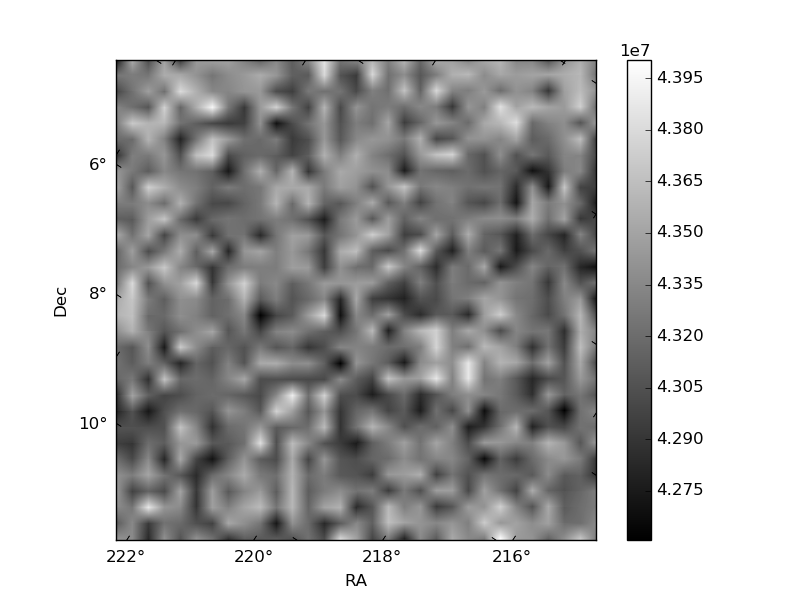
| Quadrant-wise count rates Data is divided into 100 sec bins |
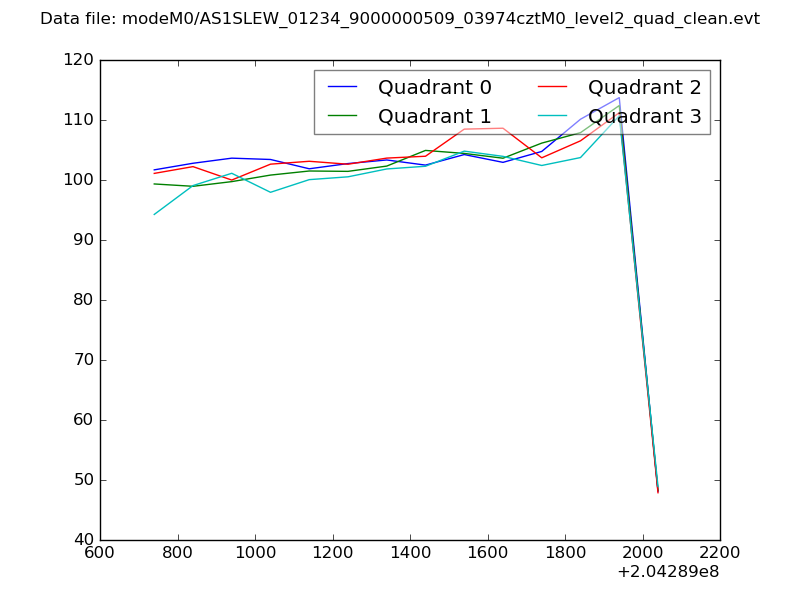 |
|
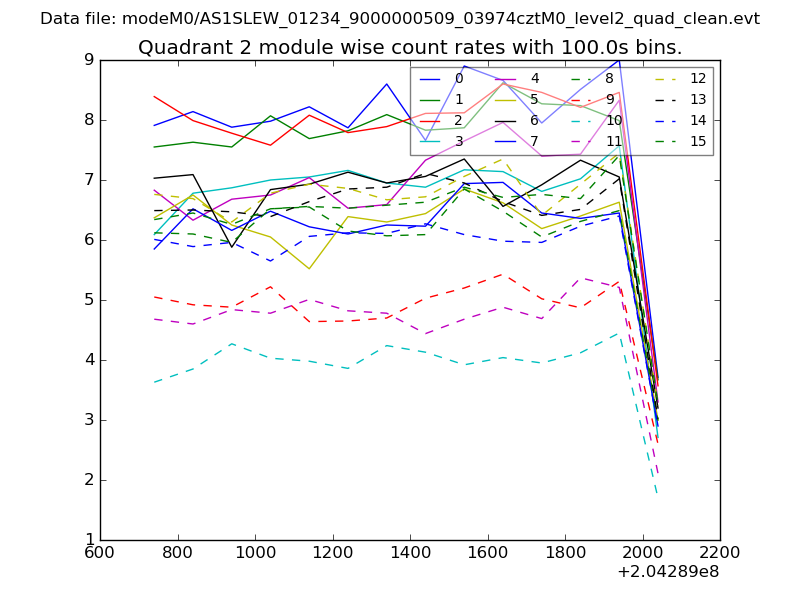
| Module-wise count rates for Quadrant A Data is divided into 100 sec bins |
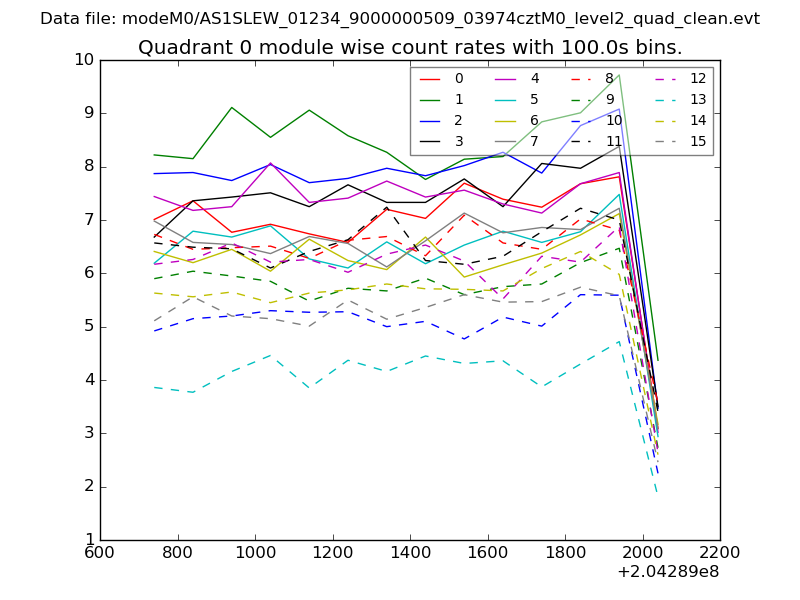 |
 |
| Module-wise count rates for Quadrant B Data is divided into 100 sec bins |
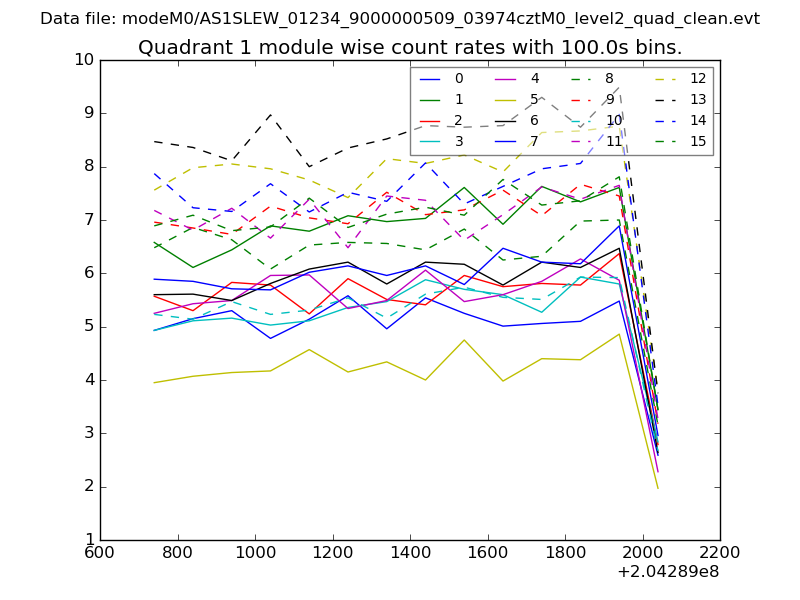 |
 |
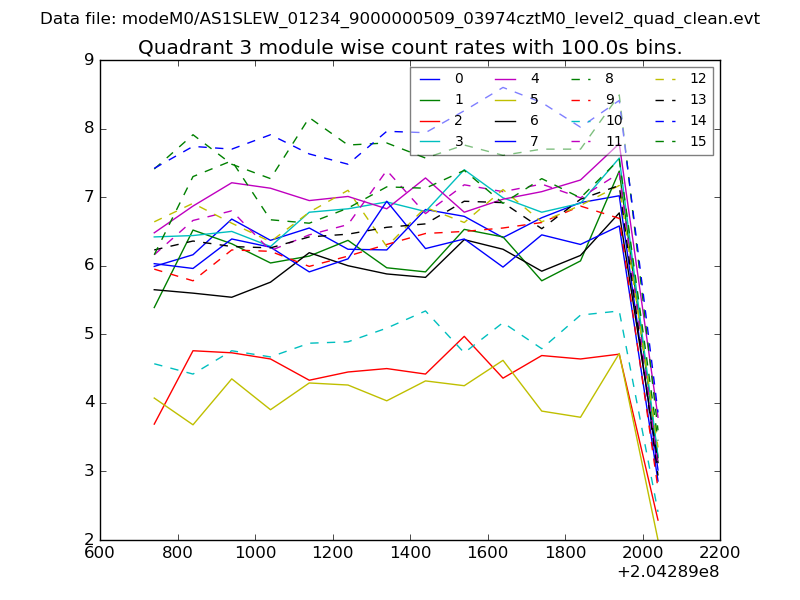
| Module-wise count rates for Quadrant C Data is divided into 100 sec bins |
 |
 |
| Module-wise count rates for Quadrant D Data is divided into 100 sec bins |
 |
 |
| Parameter | Plot |
|---|---|
| CZT HV Monitor | 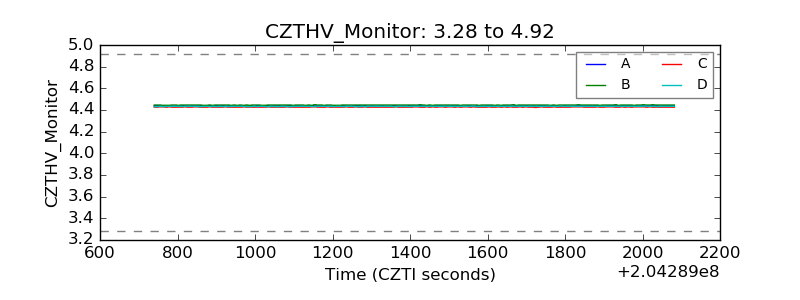 |
| D_VDD | 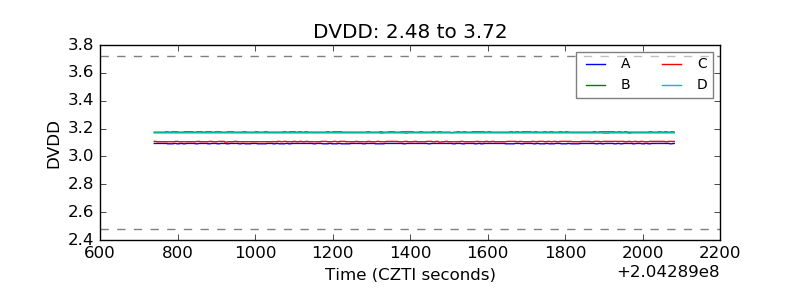 |
| Temperature 1 |  |
| Veto HV Monitor | 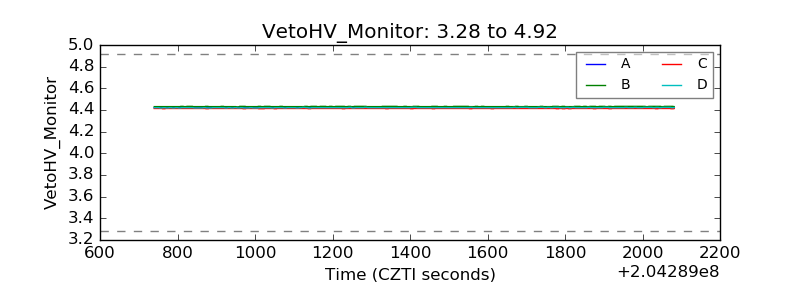 |
| Veto LLD |  |
| Alpha Counter | 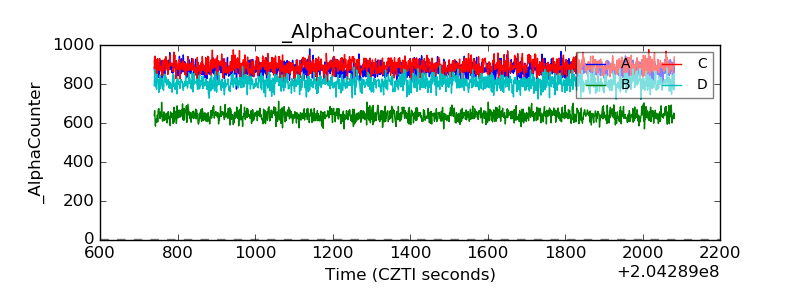 |
| _CPM_Rate | 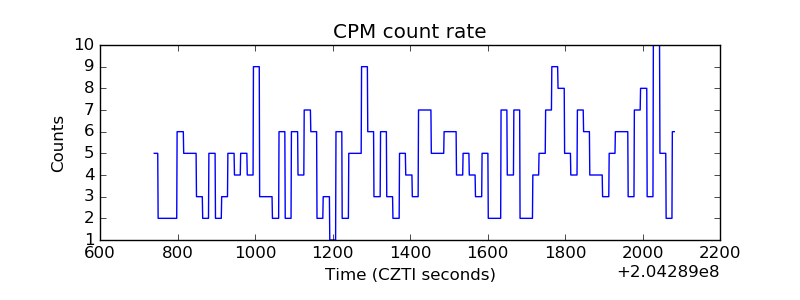 |
| CZT Counter | 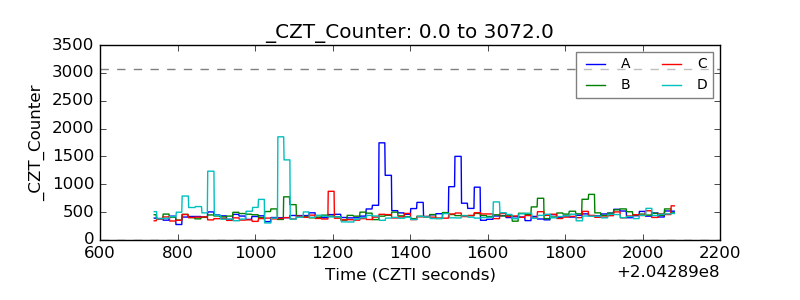 |
| +2.5 Volts monitor |  |
| +5 Volts monitor |  |
| _ROLL_ROT | 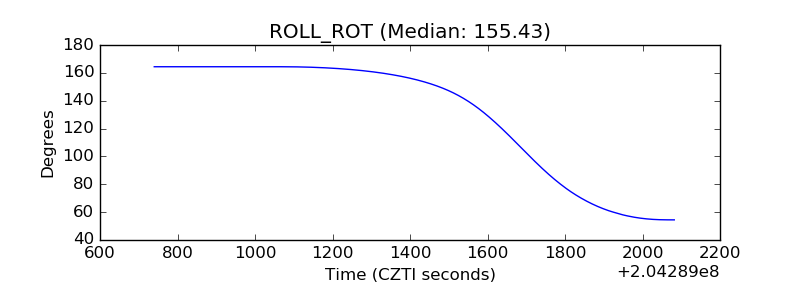 |
| _Roll_DEC | 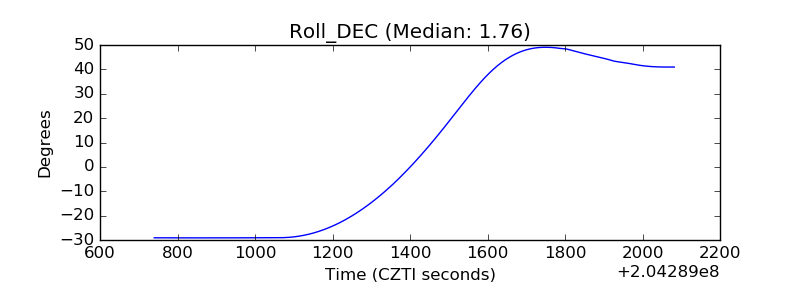 |
| _Roll_RA | 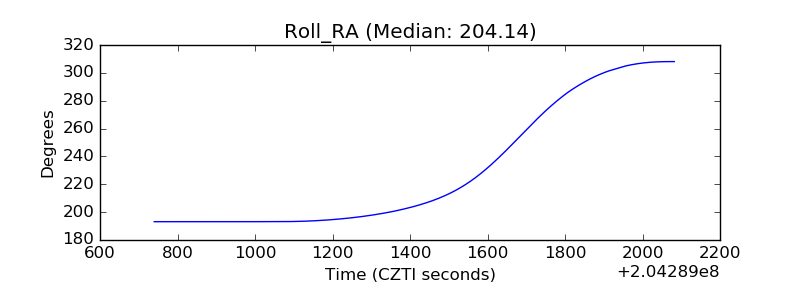 |
| Veto Counter | 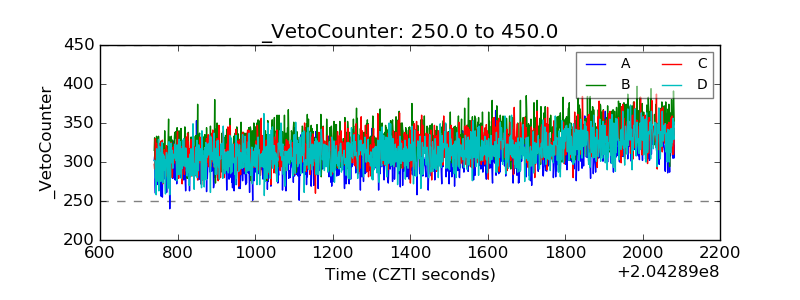 |