| Param | Original file | Final file |
|---|---|---|
| Filename | modeM0/AS1G05_173T01_9000000514cztM0_level2.fits | modeM0/AS1G05_173T01_9000000514cztM0_level2_quad_clean.evt |
| Size (bytes) | 1,028,525,760 | 1,072,586,880 |
| Size | 980.9 MB | 1022.9 MB |
| Events in quadrant A | 6,100,590 | 6,374,062 |
| Events in quadrant B | 5,959,802 | 6,450,714 |
| Events in quadrant C | 6,046,494 | 6,173,178 |
| Events in quadrant D | 5,216,856 | 5,664,068 |
| Mode M9 | |||
|---|---|---|---|
| Quadrant | BADHDUFLAG | Total packets | Discarded packets |
| A | 0 | 155 | 0 |
| B | 0 | 155 | 0 |
| C | 0 | 155 | 0 |
| D | 0 | 156 | 0 |
| Mode M0 | |||
|---|---|---|---|
| Quadrant | BADHDUFLAG | Total packets | Discarded packets |
| A | 0 | 245082 | 0 |
| B | 0 | 238569 | 0 |
| C | 0 | 233626 | 0 |
| D | 0 | 257258 | 0 |
| Mode SS | |||
|---|---|---|---|
| Quadrant | BADHDUFLAG | Total packets | Discarded packets |
| A | 0 | 2322 | 0 |
| B | 0 | 2318 | 0 |
| C | 0 | 2322 | 0 |
| D | 0 | 2320 | 0 |
| Quadrant | Total seconds | Saturated seconds | Saturation percentage |
|---|---|---|---|
| A | 114153 | 2708 | 2.372255% |
| B | 114169 | 1887 | 1.652813% |
| C | 114159 | 1378 | 1.207088% |
| D | 114150 | 2295 | 2.010512% |
Noise dominated data is calculated using 1-second bins in cleaned event files. If a bin has >2000 counts, and if more than 50% of those come from <1% of pixels, then it is considered to be noise-dominated and hence unusable.
| Quadrant | # 1 sec bins | Bins with >0 counts | Bins with >2000 counts | High rate bins dominated by noise | Noise dominated (total time) | Noise dominated (detector-on time) | Marked lightcurve |
|---|---|---|---|---|---|---|---|
| A | 128966 | 114226 | 0 | 0 | 0.00% | 0.00% |  |
| B | 128966 | 114229 | 0 | 0 | 0.00% | 0.00% |  |
| C | 128966 | 114232 | 0 | 0 | 0.00% | 0.00% |  |
| D | 128966 | 114229 | 0 | 0 | 0.00% | 0.00% |  |
Top three noisy pixels from each quadrant. If the there are fewer than three noisy pixels in the level2.evt file, extra rows are filled as -1
| Pixel properties | Quadrant properties | ||||||
|---|---|---|---|---|---|---|---|
| Quadrant | DetID | PixID | Counts | Sigma | Mean | Median | Sigma |
| A | 14 | 188 | 6107 | 11.32 | 1584 | 1474 | 409.3 |
| A | 0 | 29 | 5859 | 10.71 | 1584 | 1474 | 409.3 |
| A | 14 | 204 | 5308 | 9.37 | 1584 | 1474 | 409.3 |
| B | 2 | 9 | 5212 | 11.7 | 1571 | 1490 | 318.1 |
| B | 12 | 226 | 4441 | 9.28 | 1571 | 1490 | 318.1 |
| B | 14 | 254 | 4176 | 8.44 | 1571 | 1490 | 318.1 |
| C | 12 | 241 | 4158 | 6.3 | 1597 | 1470 | 426.8 |
| C | 7 | 111 | 4106 | 6.17 | 1597 | 1470 | 426.8 |
| C | 2 | 191 | 4096 | 6.15 | 1597 | 1470 | 426.8 |
| D | 11 | 82 | 4460 | 7.82 | 1485 | 1346 | 398.2 |
| D | 3 | 14 | 3946 | 6.53 | 1485 | 1346 | 398.2 |
| D | 6 | 231 | 3842 | 6.27 | 1485 | 1346 | 398.2 |
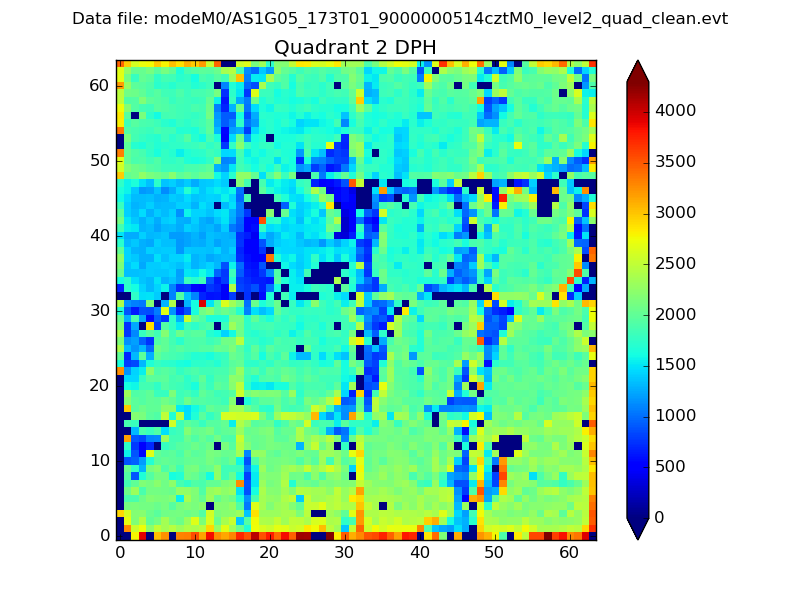
Histogram calculated using DETX and DETY for each event in the final _common_clean file
| Quadrant A |  |
 |
Quadrant B |
|---|---|---|---|
| Quadrant D | 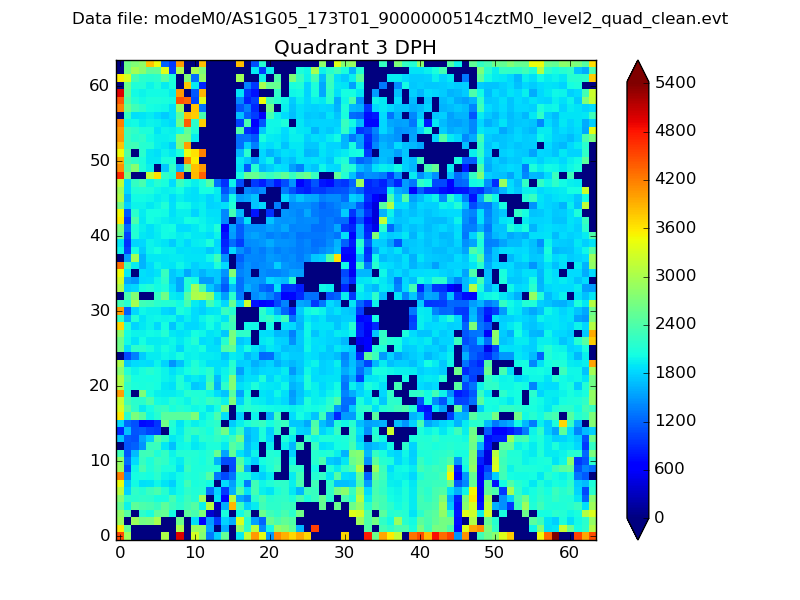 |
 |
Quadrant C |
| Plot type | Count rate plots | Images |
|---|---|---|
| Comparison with Poisson distribution Blue bars denote a histogram of data divided into 1 sec bins. Red curve is a Poisson curve with rate = median count rate of data. |
 |
 |
| Quadrant-wise count rates Data is divided into 100 sec bins |
 |
|
| Module-wise count rates for Quadrant A Data is divided into 100 sec bins |
 |
 |
| Module-wise count rates for Quadrant B Data is divided into 100 sec bins |
 |
 |
| Module-wise count rates for Quadrant C Data is divided into 100 sec bins |
 |
 |
| Module-wise count rates for Quadrant D Data is divided into 100 sec bins |
 |
 |
| Parameter | Plot |
|---|---|
| CZT HV Monitor |  |
| D_VDD |  |
| Temperature 1 |  |
| Veto HV Monitor |  |
| Veto LLD |  |
| Alpha Counter |  |
| _CPM_Rate |  |
| CZT Counter |  |
| +2.5 Volts monitor |  |
| +5 Volts monitor |  |
| _ROLL_ROT |  |
| _Roll_DEC |  |
| _Roll_RA |  |
| Veto Counter |  |