| Param | Original file | Final file |
|---|---|---|
| Filename | modeM0/AS1G05_173T01_9000000514_04011cztM0_level2.evt | modeM0/AS1G05_173T01_9000000514_04011cztM0_level2_quad_clean.evt |
| Size (bytes) | 404,173,440 | 60,111,360 |
| Size | 385.4 MB | 57.3 MB |
| Events in quadrant A | 2,994,010 | 344,208 |
| Events in quadrant B | 3,014,192 | 348,935 |
| Events in quadrant C | 2,886,710 | 344,902 |
| Events in quadrant D | 2,909,361 | 334,659 |
| Mode M9 | |||
|---|---|---|---|
| Quadrant | BADHDUFLAG | Total packets | Discarded packets |
| A | 0 | 22 | 0 |
| B | 0 | 22 | 0 |
| C | 0 | 22 | 0 |
| D | 0 | 23 | 0 |
| Mode M0 | |||
|---|---|---|---|
| Quadrant | BADHDUFLAG | Total packets | Discarded packets |
| A | 0 | 13325 | 3 |
| B | 0 | 13211 | 2 |
| C | 0 | 13116 | 2 |
| D | 0 | 13479 | 2 |
| Mode SS | |||
|---|---|---|---|
| Quadrant | BADHDUFLAG | Total packets | Discarded packets |
| A | 0 | 130 | 0 |
| B | 0 | 130 | 0 |
| C | 0 | 130 | 0 |
| D | 0 | 130 | 0 |
| Quadrant | Total seconds | Saturated seconds | Saturation percentage |
|---|---|---|---|
| A | 6407 | 54 | 0.842828% |
| B | 6407 | 44 | 0.686749% |
| C | 6407 | 40 | 0.624317% |
| D | 6407 | 29 | 0.452630% |
Noise dominated data is calculated using 1-second bins in cleaned event files. If a bin has >2000 counts, and if more than 50% of those come from <1% of pixels, then it is considered to be noise-dominated and hence unusable.
| Quadrant | # 1 sec bins | Bins with >0 counts | Bins with >2000 counts | High rate bins dominated by noise | Noise dominated (total time) | Noise dominated (detector-on time) | Marked lightcurve |
|---|---|---|---|---|---|---|---|
| A | 7552 | 6408 | 20 | 20 | 0.26% | 0.31% | 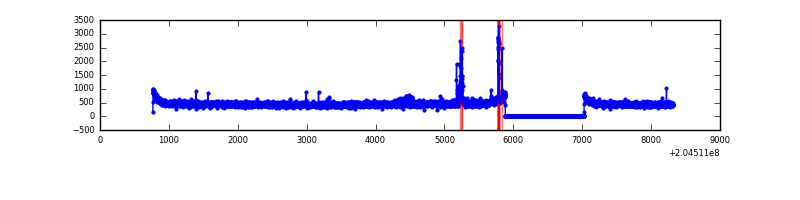 |
| B | 7552 | 6408 | 2 | 2 | 0.03% | 0.03% | 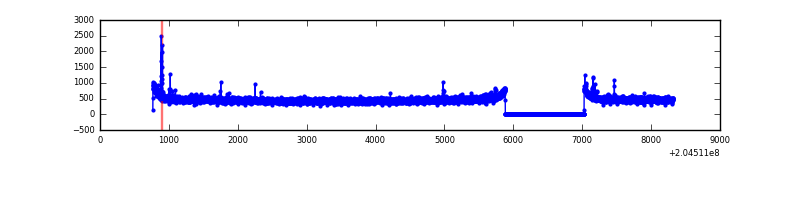 |
| C | 7552 | 6408 | 9 | 9 | 0.12% | 0.14% |  |
| D | 7552 | 6408 | 18 | 18 | 0.24% | 0.28% | 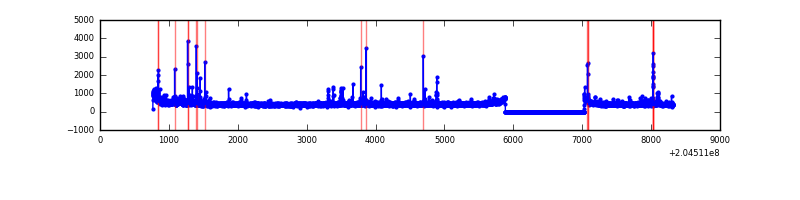 |
Top three noisy pixels from each quadrant. If the there are fewer than three noisy pixels in the level2.evt file, extra rows are filled as -1
| Pixel properties | Quadrant properties | ||||||
|---|---|---|---|---|---|---|---|
| Quadrant | DetID | PixID | Counts | Sigma | Mean | Median | Sigma |
| A | 13 | 251 | 48849 | 313.35 | 746 | 729 | 153.6 |
| A | 3 | 1 | 25675 | 162.45 | 746 | 729 | 153.6 |
| A | 0 | 50 | 20799 | 130.69 | 746 | 729 | 153.6 |
| B | 15 | 204 | 30160 | 204.1 | 757 | 739 | 144.1 |
| B | 4 | 81 | 22700 | 152.35 | 757 | 739 | 144.1 |
| B | 7 | 252 | 18553 | 123.58 | 757 | 739 | 144.1 |
| C | 9 | 144 | 37205 | 217.47 | 725 | 729 | 167.7 |
| C | 14 | 67 | 16680 | 95.1 | 725 | 729 | 167.7 |
| C | 13 | 61 | 6008 | 31.47 | 725 | 729 | 167.7 |
| D | 2 | 63 | 78663 | 450.77 | 719 | 697 | 173.0 |
| D | 2 | 232 | 33262 | 188.28 | 719 | 697 | 173.0 |
| D | 2 | 206 | 26446 | 148.87 | 719 | 697 | 173.0 |
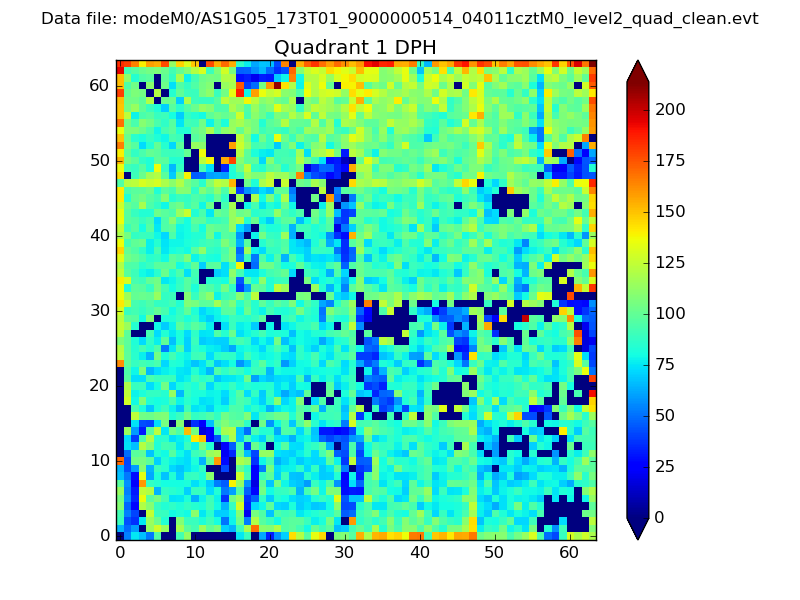
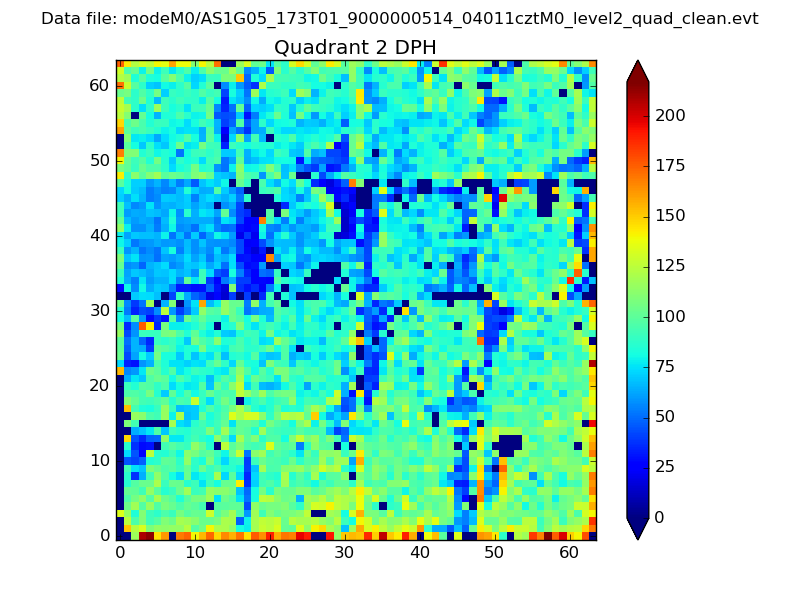
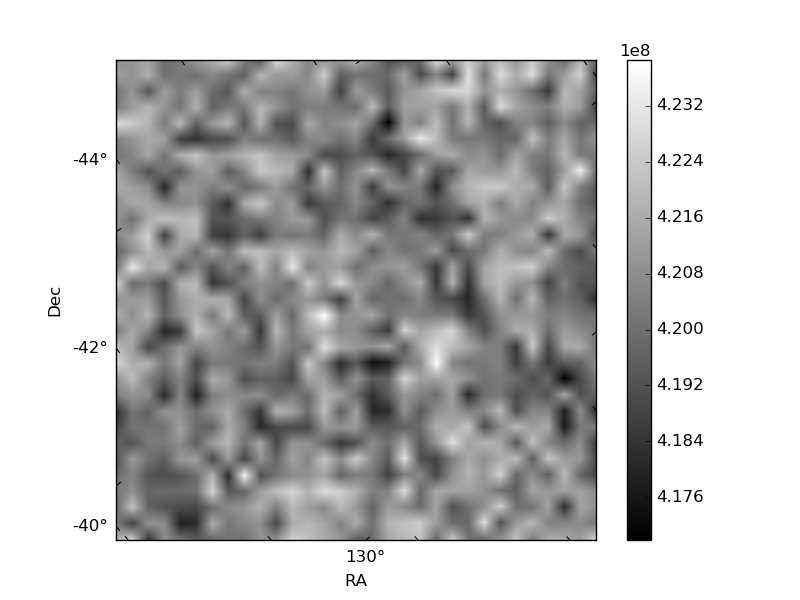
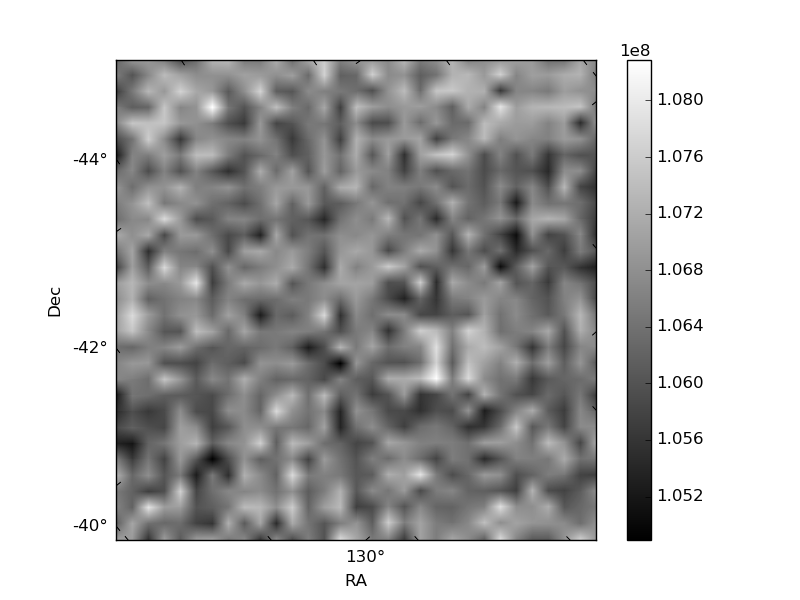
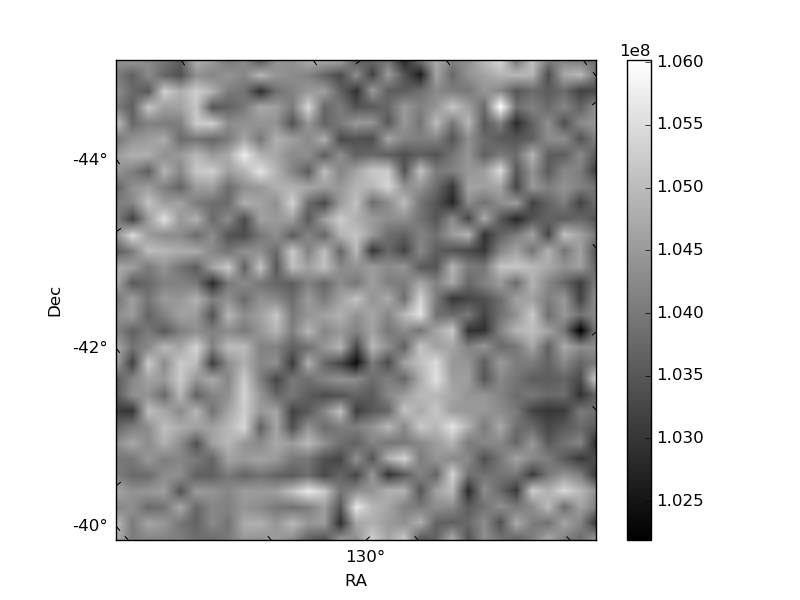
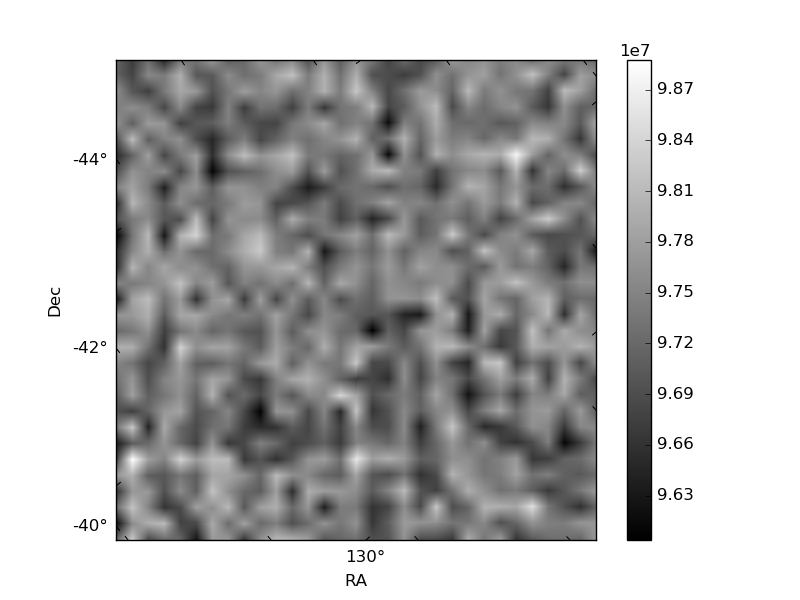
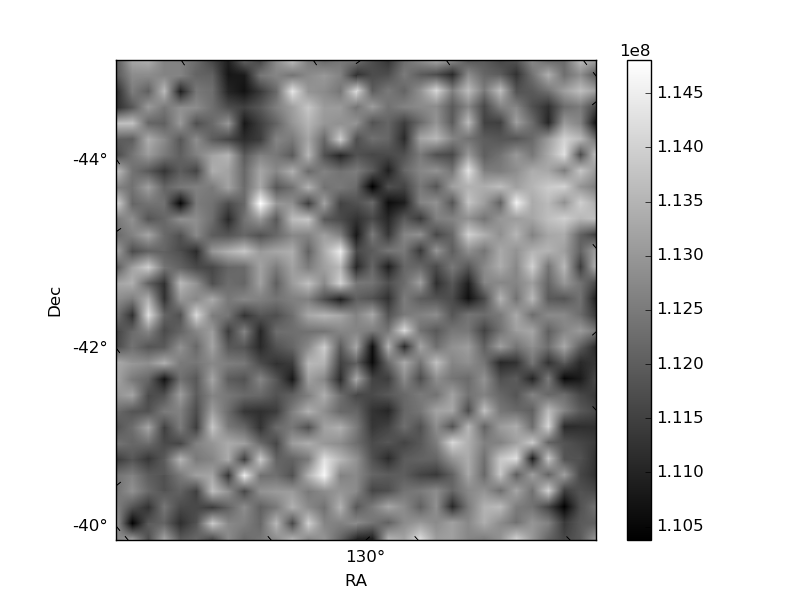
Histogram calculated using DETX and DETY for each event in the final _common_clean file
| Quadrant A | 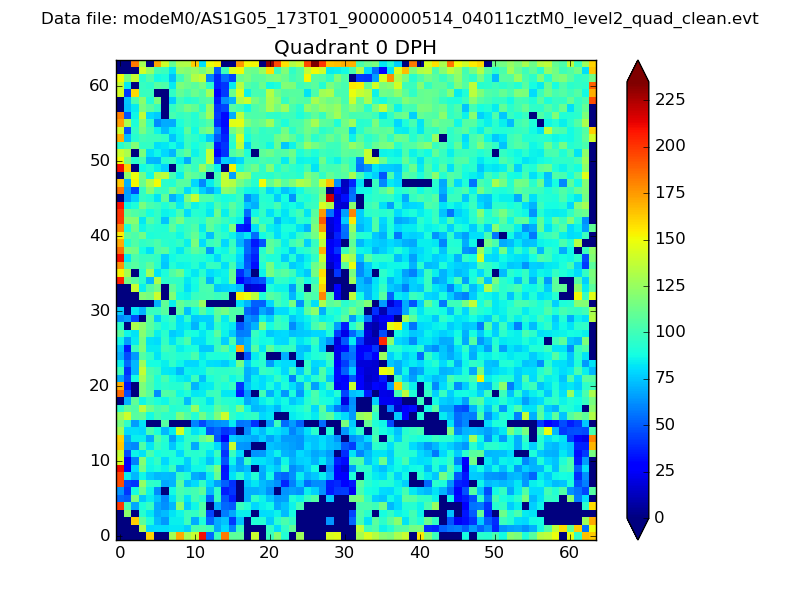 |
 |
Quadrant B |
|---|---|---|---|
| Quadrant D | 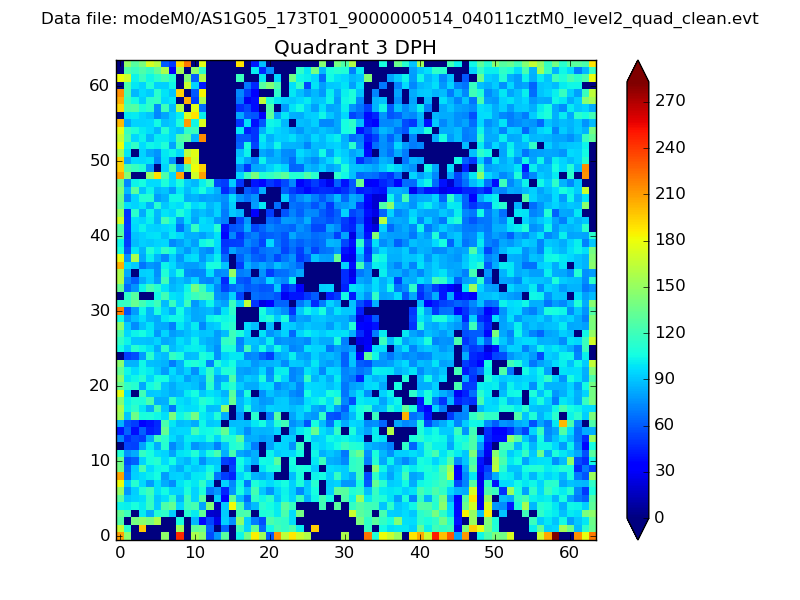 |
 |
Quadrant C |
| Plot type | Count rate plots | Images |
|---|---|---|
| Comparison with Poisson distribution Blue bars denote a histogram of data divided into 1 sec bins. Red curve is a Poisson curve with rate = median count rate of data. |
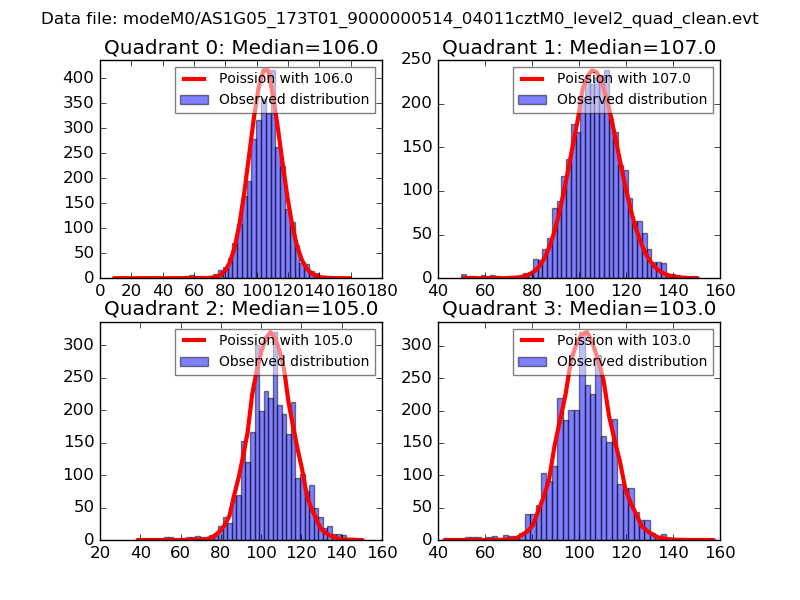 |
 |
| Quadrant-wise count rates Data is divided into 100 sec bins |
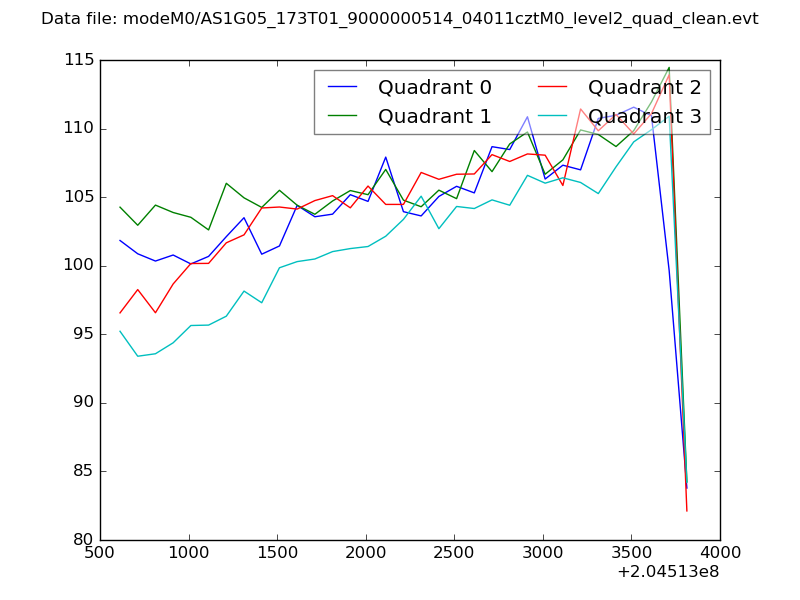 |
|
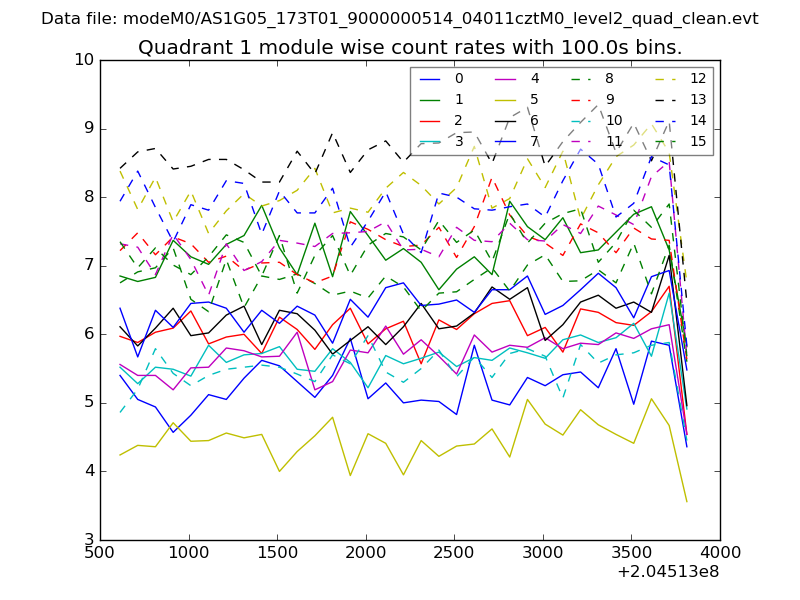
| Module-wise count rates for Quadrant A Data is divided into 100 sec bins |
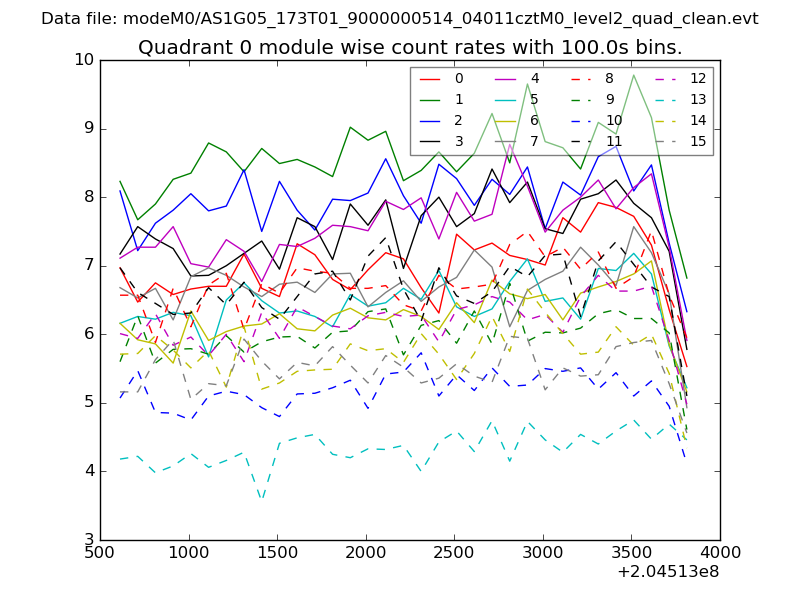 |
 |
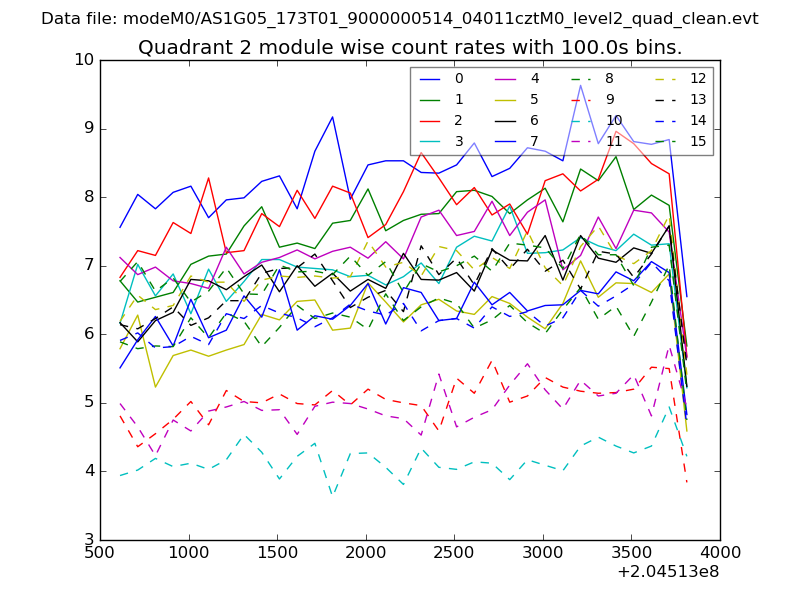
| Module-wise count rates for Quadrant B Data is divided into 100 sec bins |
 |
 |
| Module-wise count rates for Quadrant C Data is divided into 100 sec bins |
 |
 |
| Module-wise count rates for Quadrant D Data is divided into 100 sec bins |
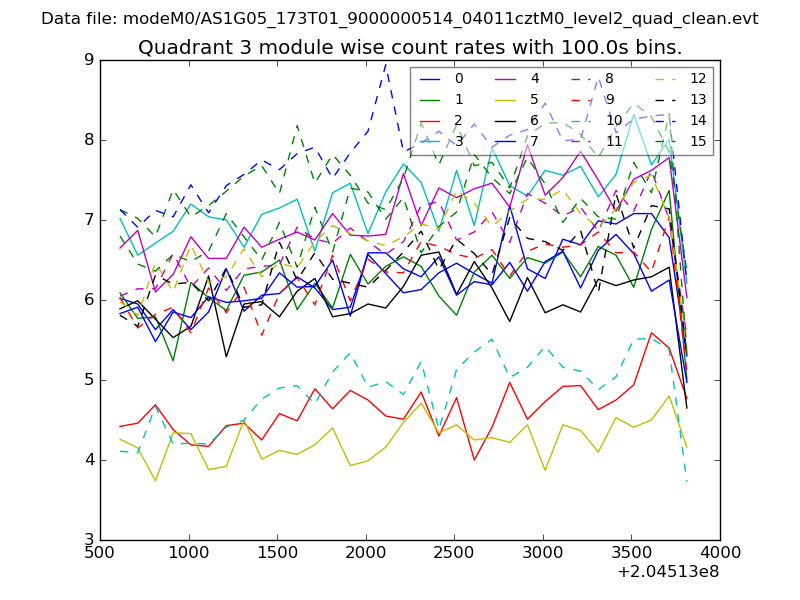 |
 |
| Parameter | Plot |
|---|---|
| CZT HV Monitor | 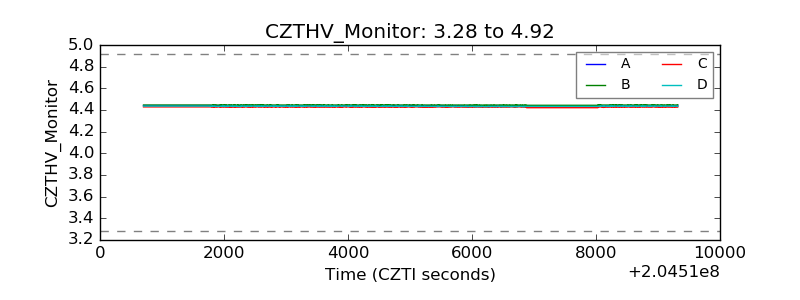 |
| D_VDD | 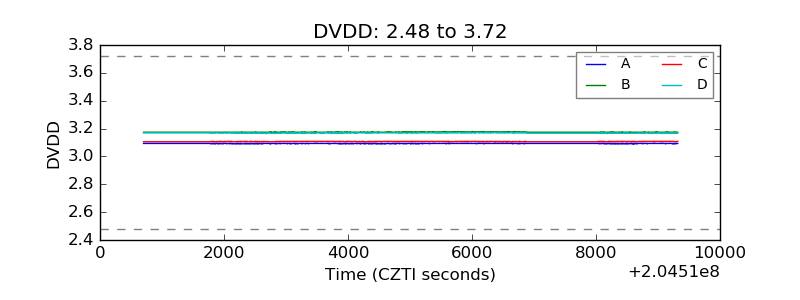 |
| Temperature 1 | 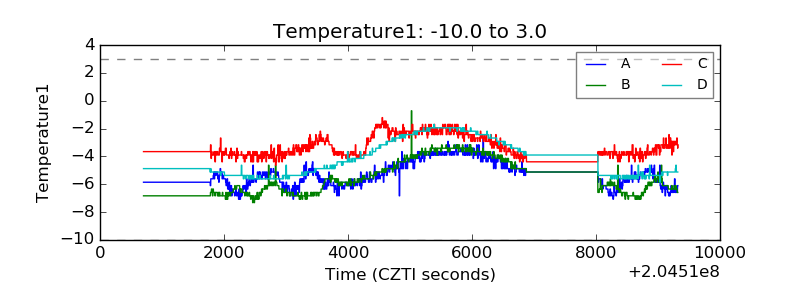 |
| Veto HV Monitor | 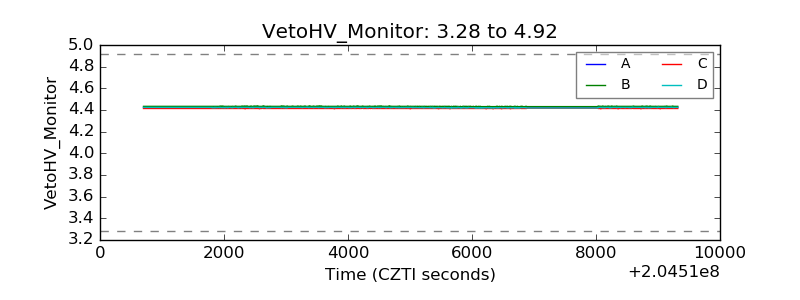 |
| Veto LLD | 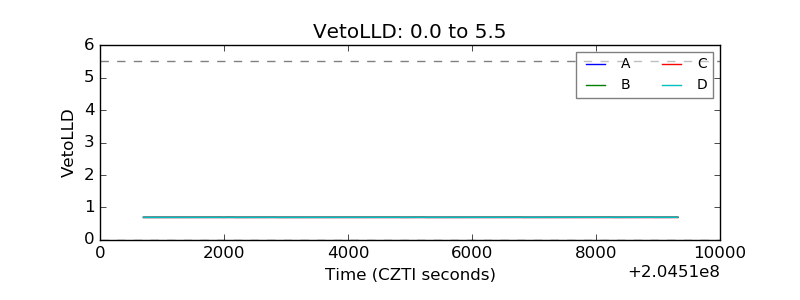 |
| Alpha Counter | 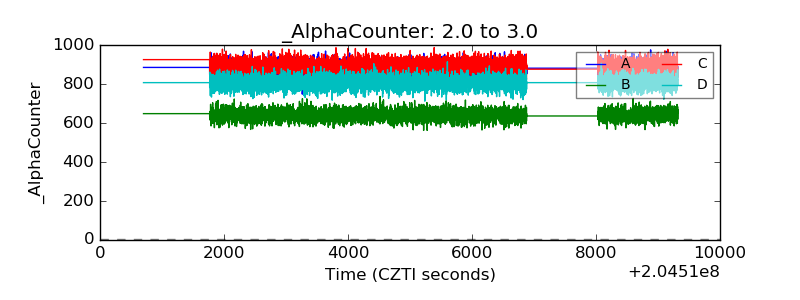 |
| _CPM_Rate | 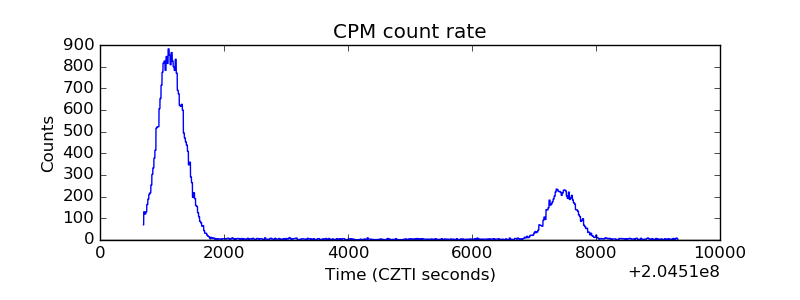 |
| CZT Counter | 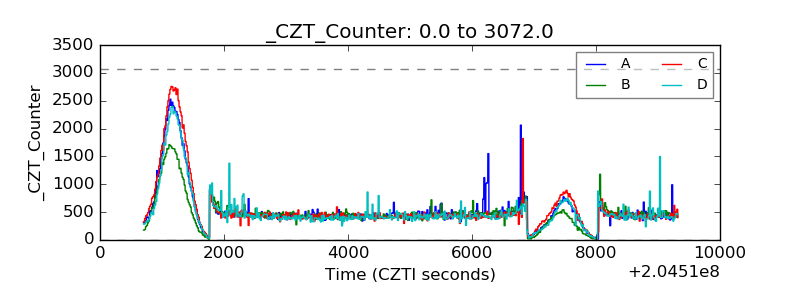 |
| +2.5 Volts monitor |  |
| +5 Volts monitor |  |
| _ROLL_ROT |  |
| _Roll_DEC | 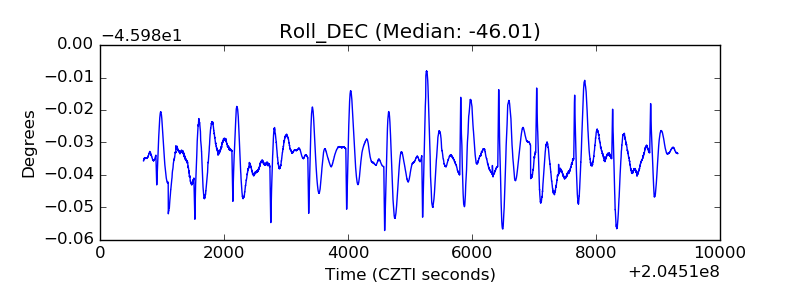 |
| _Roll_RA | 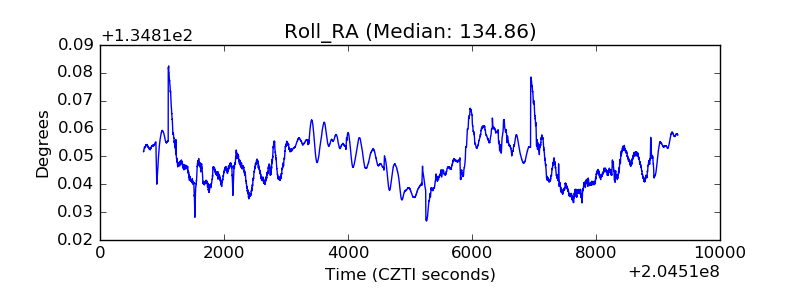 |
| Veto Counter | 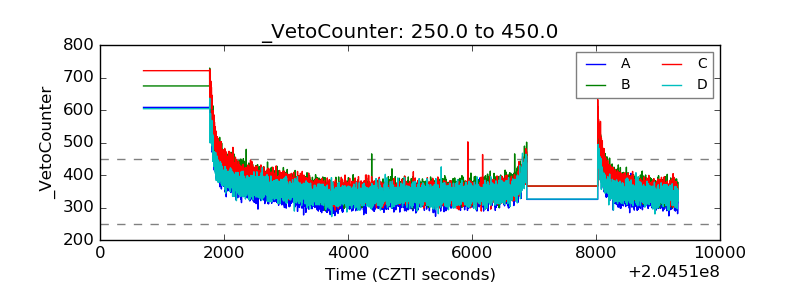 |