| Param | Original file | Final file |
|---|---|---|
| Filename | modeM0/AS1G05_173T01_9000000514_04012cztM0_level2.evt | modeM0/AS1G05_173T01_9000000514_04012cztM0_level2_quad_clean.evt |
| Size (bytes) | 464,595,840 | 75,314,880 |
| Size | 443.1 MB | 71.8 MB |
| Events in quadrant A | 3,461,925 | 447,817 |
| Events in quadrant B | 3,501,199 | 450,309 |
| Events in quadrant C | 3,283,854 | 444,898 |
| Events in quadrant D | 3,329,627 | 432,181 |
| Mode M9 | |||
|---|---|---|---|
| Quadrant | BADHDUFLAG | Total packets | Discarded packets |
| A | 0 | 18 | 0 |
| B | 0 | 18 | 0 |
| C | 0 | 18 | 0 |
| D | 0 | 18 | 0 |
| Mode M0 | |||
|---|---|---|---|
| Quadrant | BADHDUFLAG | Total packets | Discarded packets |
| A | 0 | 15358 | 3 |
| B | 0 | 15150 | 2 |
| C | 0 | 15073 | 2 |
| D | 0 | 15385 | 2 |
| Mode SS | |||
|---|---|---|---|
| Quadrant | BADHDUFLAG | Total packets | Discarded packets |
| A | 0 | 148 | 0 |
| B | 0 | 148 | 0 |
| C | 0 | 148 | 0 |
| D | 0 | 148 | 0 |
| Quadrant | Total seconds | Saturated seconds | Saturation percentage |
|---|---|---|---|
| A | 7261 | 209 | 2.878391% |
| B | 7261 | 193 | 2.658036% |
| C | 7261 | 186 | 2.561631% |
| D | 7261 | 166 | 2.286186% |
Noise dominated data is calculated using 1-second bins in cleaned event files. If a bin has >2000 counts, and if more than 50% of those come from <1% of pixels, then it is considered to be noise-dominated and hence unusable.
| Quadrant | # 1 sec bins | Bins with >0 counts | Bins with >2000 counts | High rate bins dominated by noise | Noise dominated (total time) | Noise dominated (detector-on time) | Marked lightcurve |
|---|---|---|---|---|---|---|---|
| A | 9021 | 7262 | 21 | 21 | 0.23% | 0.29% | 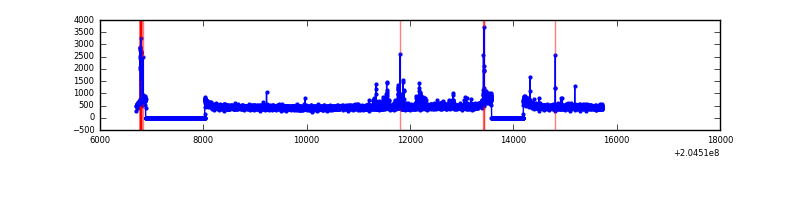 |
| B | 9021 | 7263 | 1 | 1 | 0.01% | 0.01% | 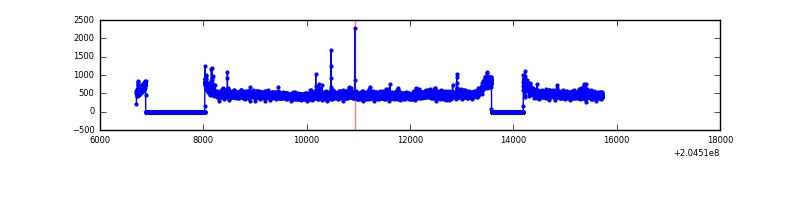 |
| C | 9021 | 7262 | 7 | 7 | 0.08% | 0.10% | 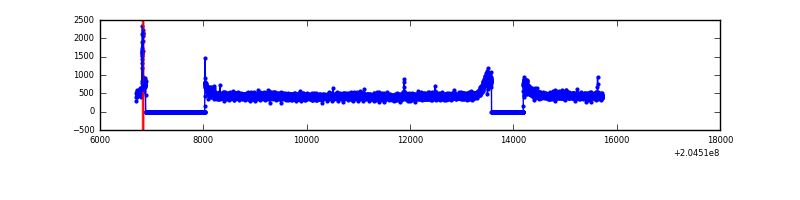 |
| D | 9021 | 7263 | 13 | 13 | 0.14% | 0.18% | 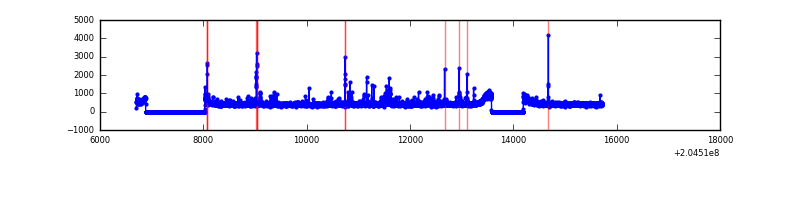 |
Top three noisy pixels from each quadrant. If the there are fewer than three noisy pixels in the level2.evt file, extra rows are filled as -1
| Pixel properties | Quadrant properties | ||||||
|---|---|---|---|---|---|---|---|
| Quadrant | DetID | PixID | Counts | Sigma | Mean | Median | Sigma |
| A | 0 | 118 | 81410 | 459.97 | 852 | 832 | 175.2 |
| A | 13 | 251 | 45833 | 256.88 | 852 | 832 | 175.2 |
| A | 0 | 50 | 29884 | 165.84 | 852 | 832 | 175.2 |
| B | 15 | 204 | 101577 | 609.37 | 862 | 841 | 165.3 |
| B | 4 | 81 | 36317 | 214.6 | 862 | 841 | 165.3 |
| B | 12 | 111 | 14529 | 82.8 | 862 | 841 | 165.3 |
| C | 9 | 144 | 40796 | 207.08 | 829 | 830 | 193.0 |
| C | 13 | 61 | 6991 | 31.92 | 829 | 830 | 193.0 |
| C | 12 | 4 | 2141 | 6.79 | 829 | 830 | 193.0 |
| D | 12 | 233 | 40289 | 197.13 | 824 | 798 | 200.3 |
| D | 2 | 232 | 35469 | 173.07 | 824 | 798 | 200.3 |
| D | 13 | 239 | 28720 | 139.38 | 824 | 798 | 200.3 |
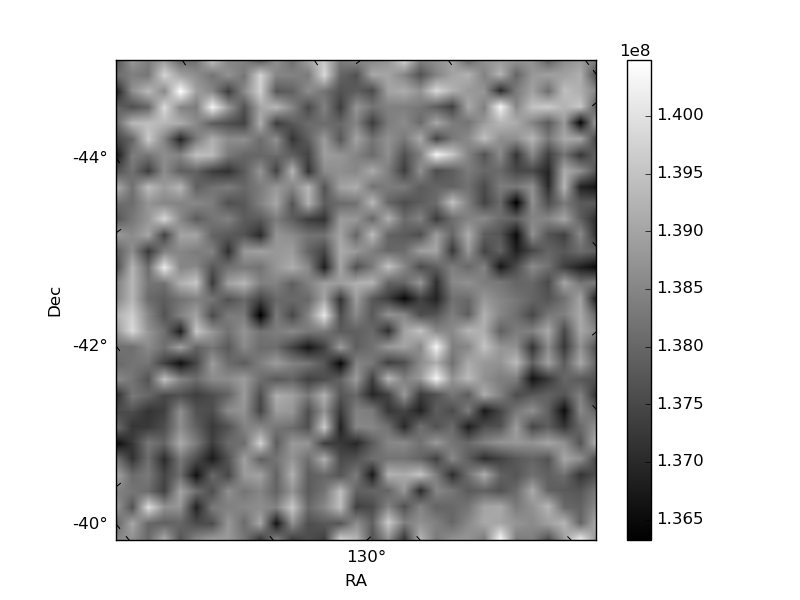
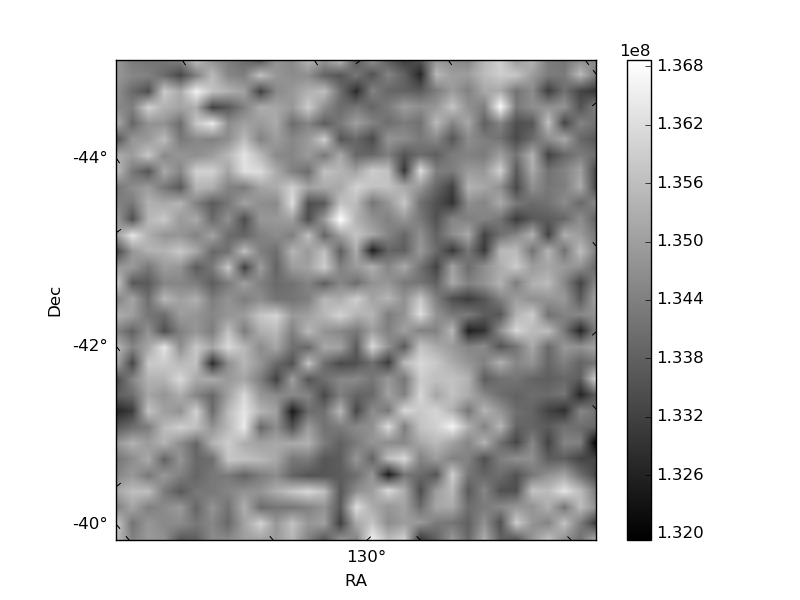
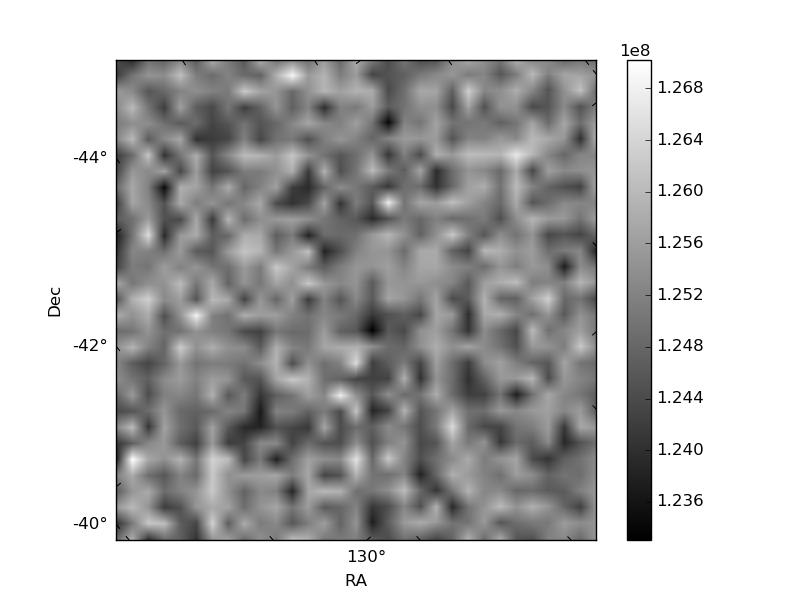
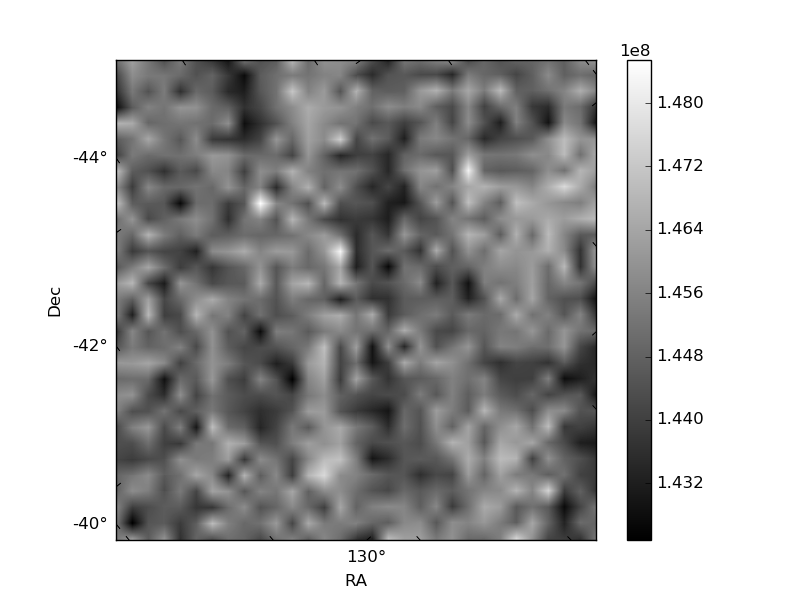
Histogram calculated using DETX and DETY for each event in the final _common_clean file
| Quadrant A | 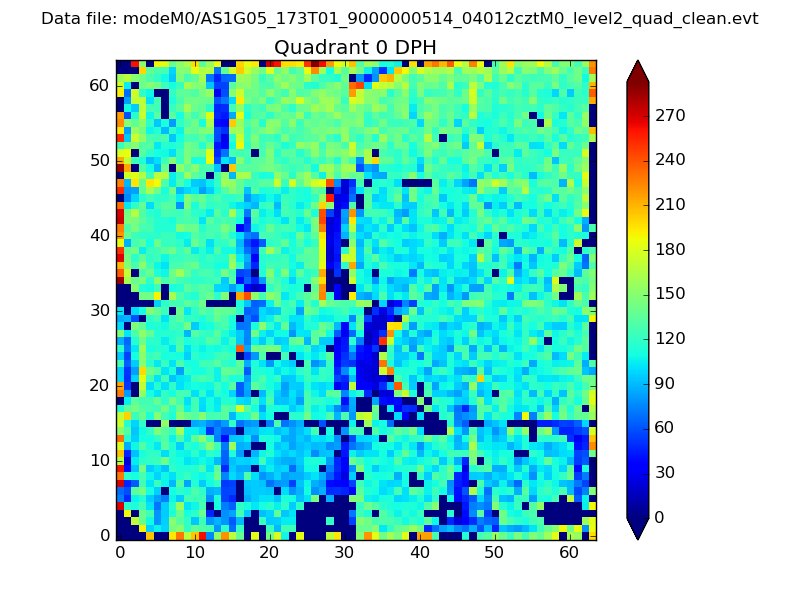 |
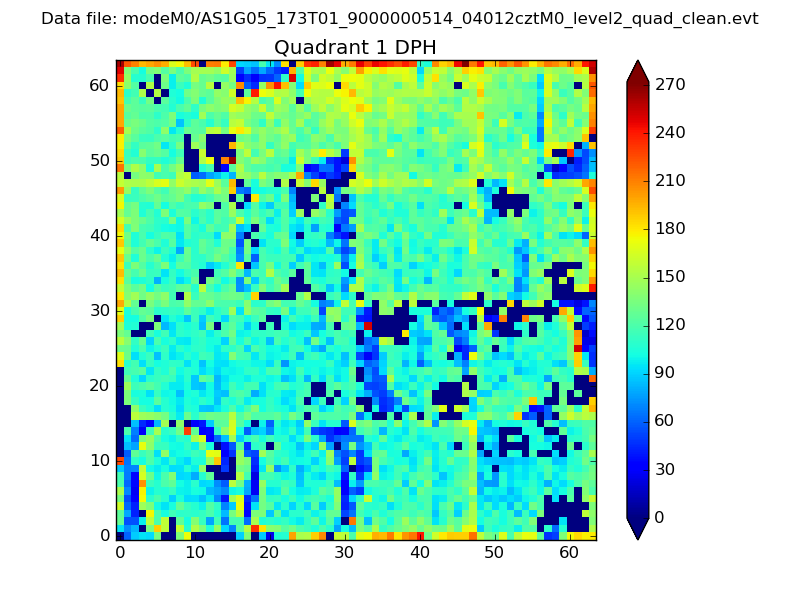 |
Quadrant B |
|---|---|---|---|
| Quadrant D | 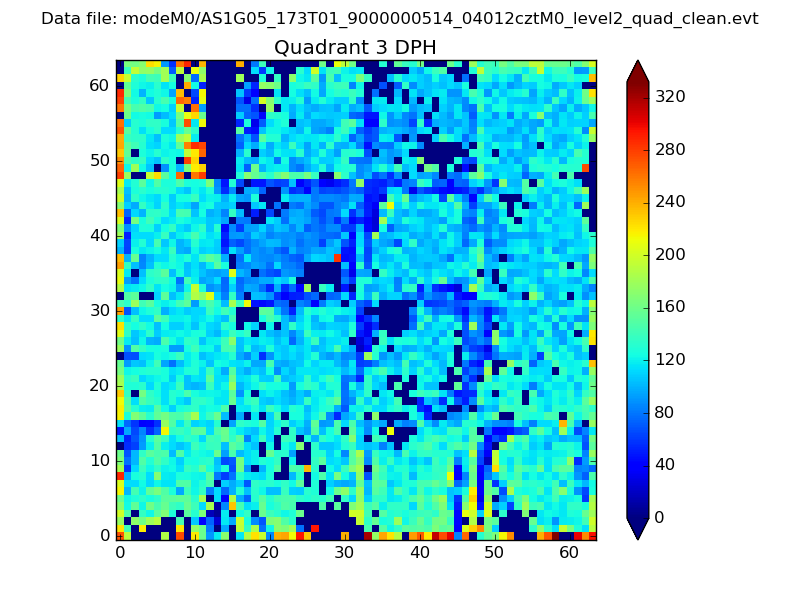 |
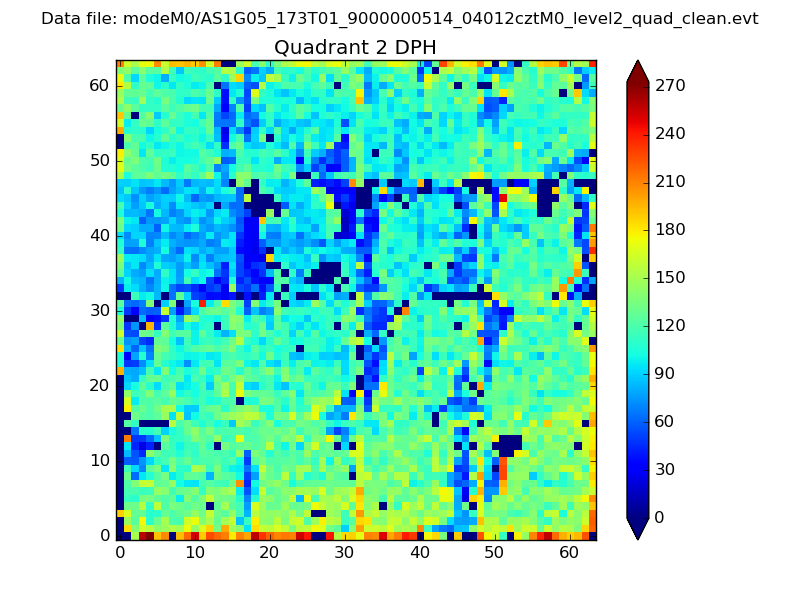 |
Quadrant C |
| Plot type | Count rate plots | Images |
|---|---|---|
| Comparison with Poisson distribution Blue bars denote a histogram of data divided into 1 sec bins. Red curve is a Poisson curve with rate = median count rate of data. |
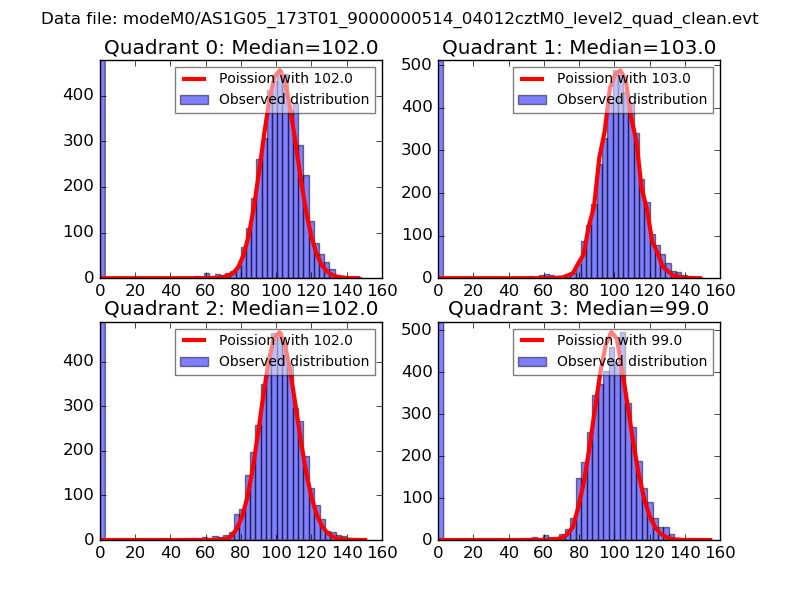 |
 |
| Quadrant-wise count rates Data is divided into 100 sec bins |
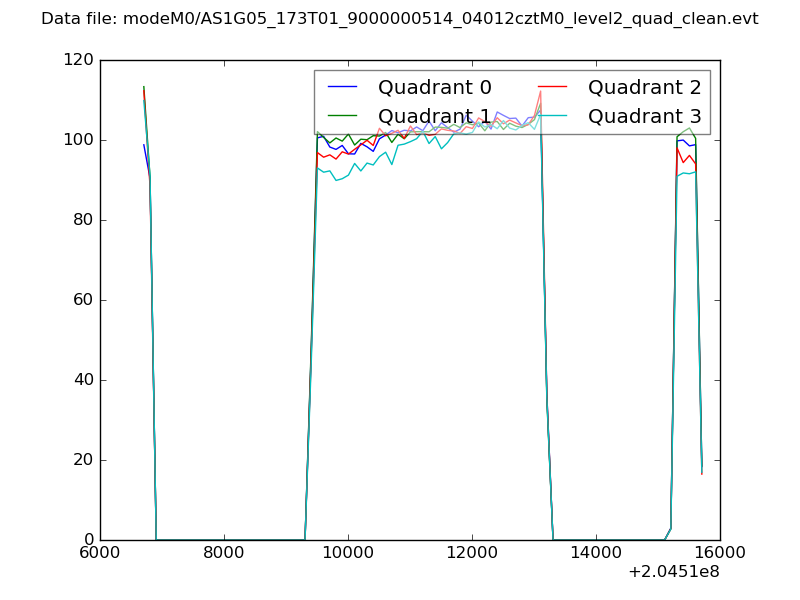 |
|
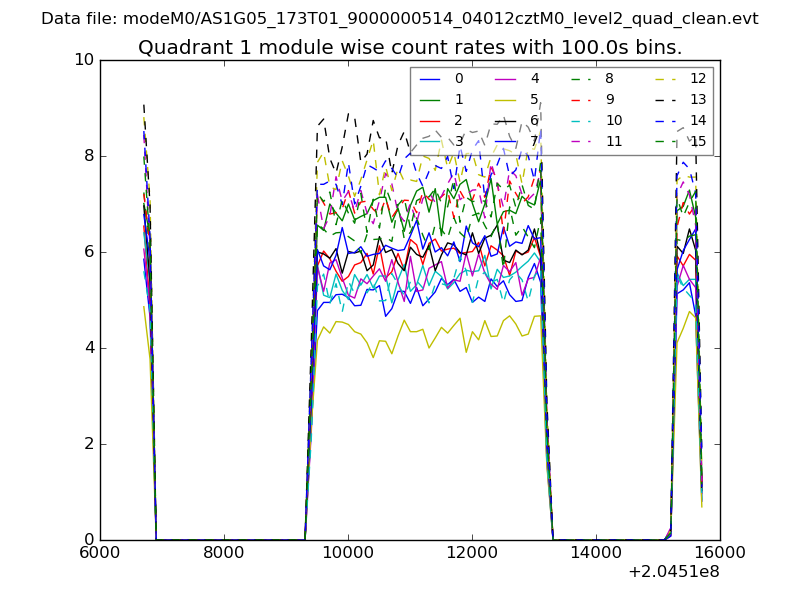
| Module-wise count rates for Quadrant A Data is divided into 100 sec bins |
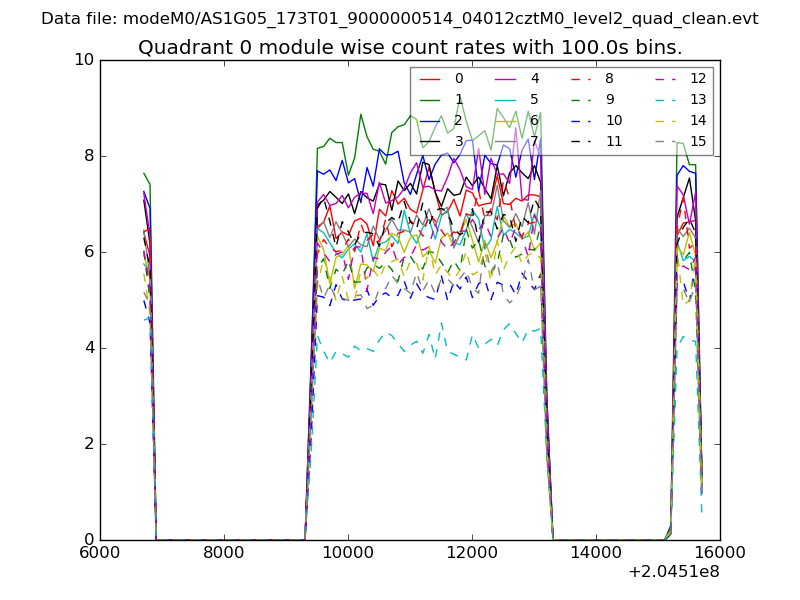 |
 |
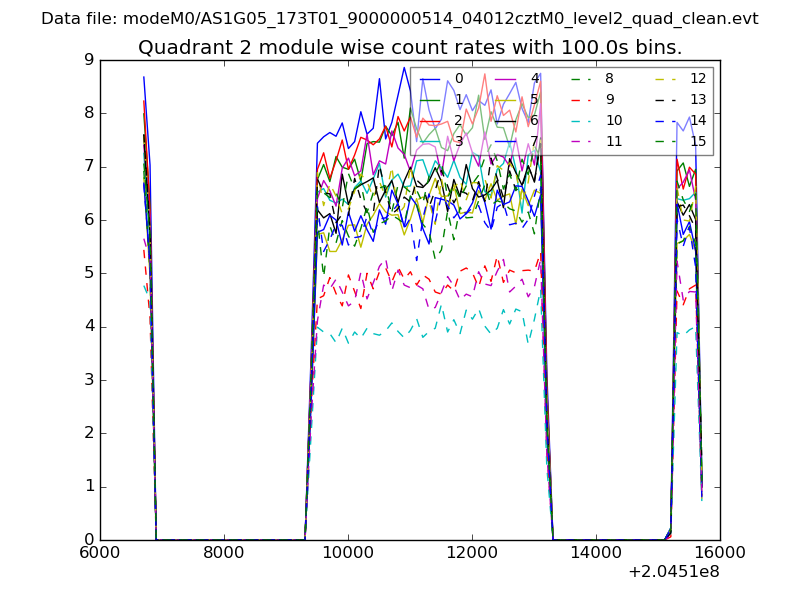
| Module-wise count rates for Quadrant B Data is divided into 100 sec bins |
 |
 |
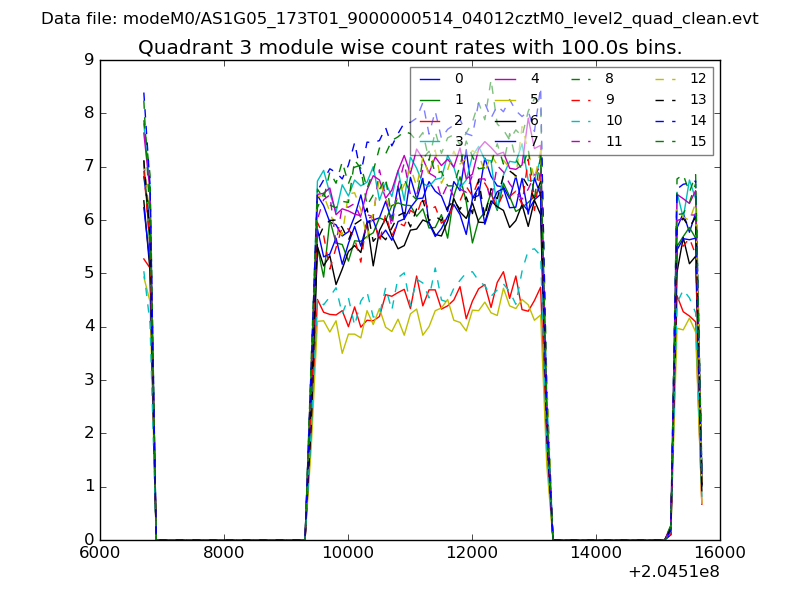
| Module-wise count rates for Quadrant C Data is divided into 100 sec bins |
 |
 |
| Module-wise count rates for Quadrant D Data is divided into 100 sec bins |
 |
 |
| Parameter | Plot |
|---|---|
| CZT HV Monitor | 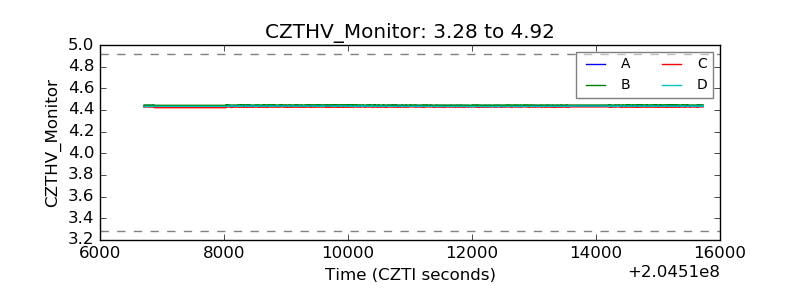 |
| D_VDD | 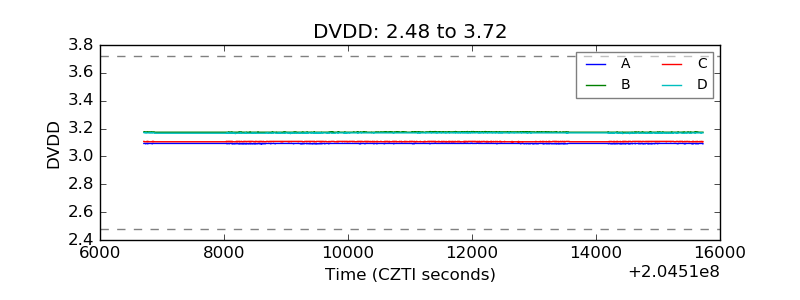 |
| Temperature 1 | 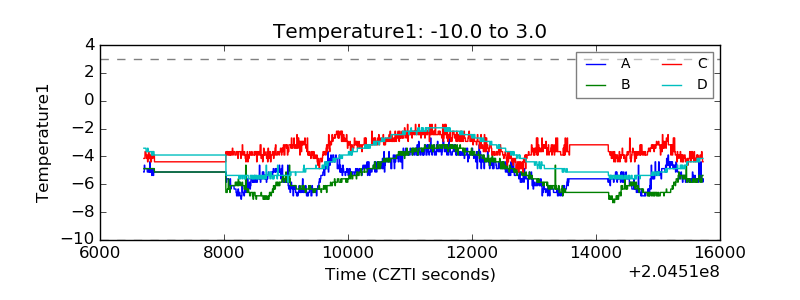 |
| Veto HV Monitor | 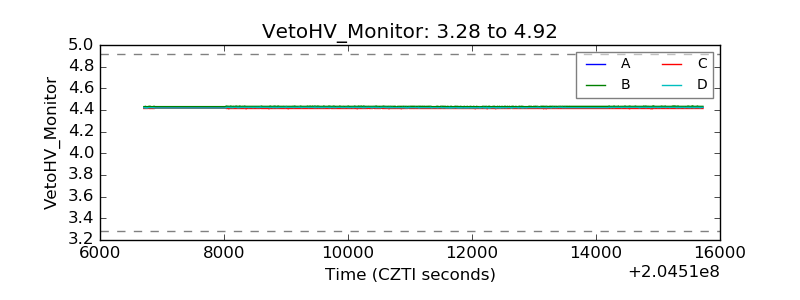 |
| Veto LLD | 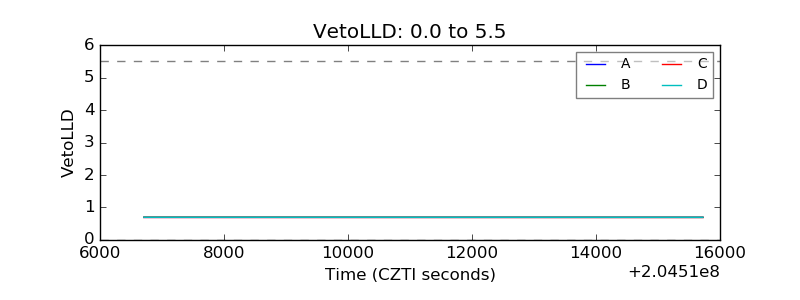 |
| Alpha Counter | 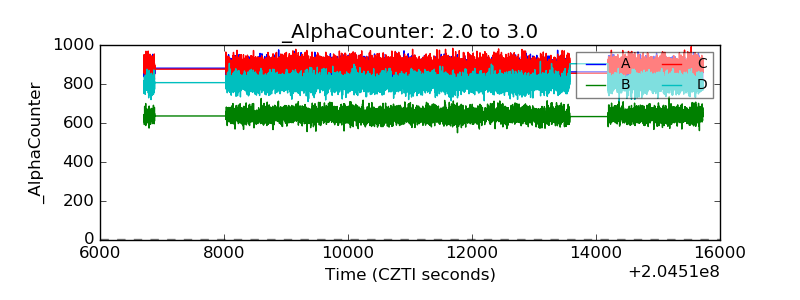 |
| _CPM_Rate | 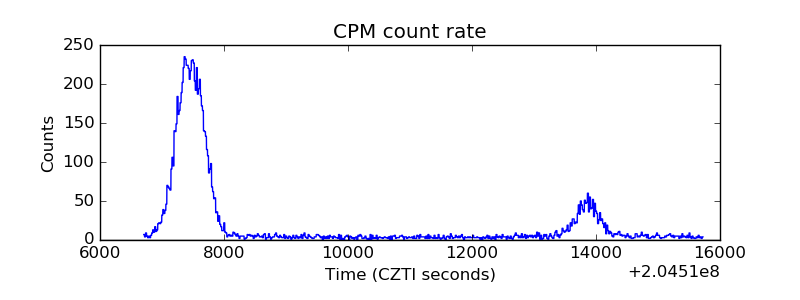 |
| CZT Counter | 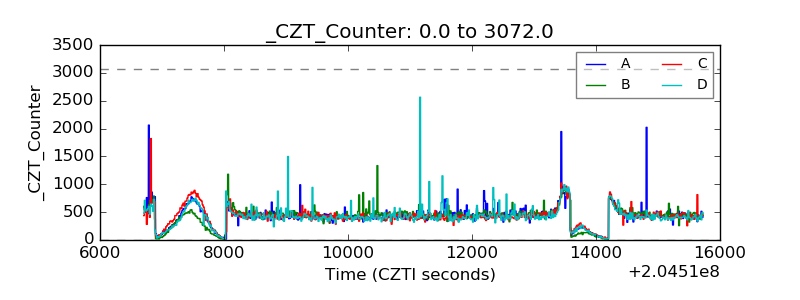 |
| +2.5 Volts monitor |  |
| +5 Volts monitor |  |
| _ROLL_ROT | 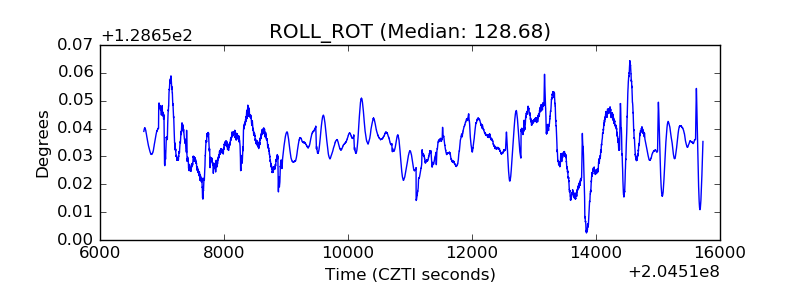 |
| _Roll_DEC | 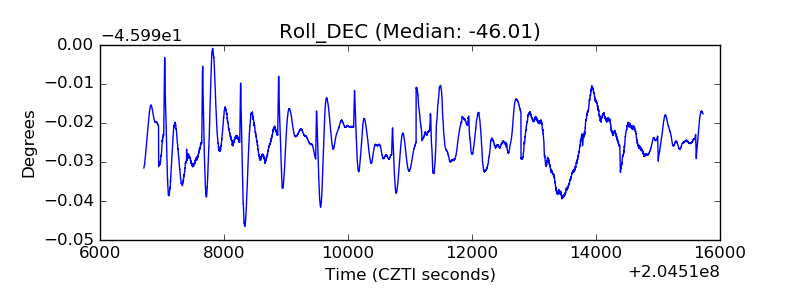 |
| _Roll_RA |  |
| Veto Counter | 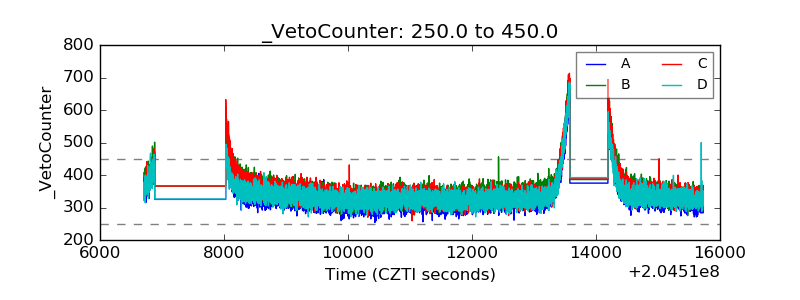 |