| Param | Original file | Final file |
|---|---|---|
| Filename | modeM0/AS1G05_173T01_9000000514_04013cztM0_level2.evt | modeM0/AS1G05_173T01_9000000514_04013cztM0_level2_quad_clean.evt |
| Size (bytes) | 516,839,040 | 77,952,960 |
| Size | 492.9 MB | 74.3 MB |
| Events in quadrant A | 3,755,679 | 458,362 |
| Events in quadrant B | 3,810,648 | 460,361 |
| Events in quadrant C | 3,615,500 | 453,423 |
| Events in quadrant D | 3,933,054 | 438,671 |
| Mode M9 | |||
|---|---|---|---|
| Quadrant | BADHDUFLAG | Total packets | Discarded packets |
| A | 0 | 7 | 0 |
| B | 0 | 7 | 0 |
| C | 0 | 7 | 0 |
| D | 0 | 7 | 0 |
| Mode M0 | |||
|---|---|---|---|
| Quadrant | BADHDUFLAG | Total packets | Discarded packets |
| A | 0 | 16760 | 3 |
| B | 0 | 16723 | 2 |
| C | 0 | 16583 | 2 |
| D | 0 | 17598 | 2 |
| Mode SS | |||
|---|---|---|---|
| Quadrant | BADHDUFLAG | Total packets | Discarded packets |
| A | 0 | 162 | 0 |
| B | 0 | 162 | 0 |
| C | 0 | 162 | 0 |
| D | 0 | 162 | 0 |
| Quadrant | Total seconds | Saturated seconds | Saturation percentage |
|---|---|---|---|
| A | 7905 | 431 | 5.452245% |
| B | 7905 | 440 | 5.566097% |
| C | 7905 | 399 | 5.047438% |
| D | 7905 | 397 | 5.022138% |
Noise dominated data is calculated using 1-second bins in cleaned event files. If a bin has >2000 counts, and if more than 50% of those come from <1% of pixels, then it is considered to be noise-dominated and hence unusable.
| Quadrant | # 1 sec bins | Bins with >0 counts | Bins with >2000 counts | High rate bins dominated by noise | Noise dominated (total time) | Noise dominated (detector-on time) | Marked lightcurve |
|---|---|---|---|---|---|---|---|
| A | 8660 | 7907 | 6 | 6 | 0.07% | 0.08% | 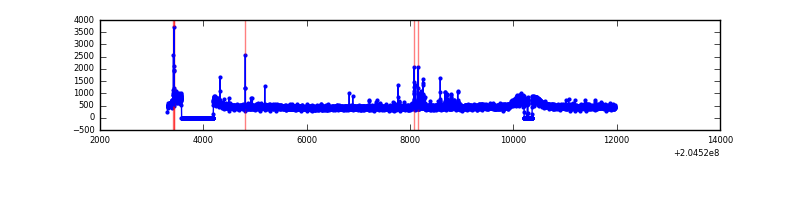 |
| B | 8660 | 7908 | 0 | 0 | 0.00% | 0.00% | 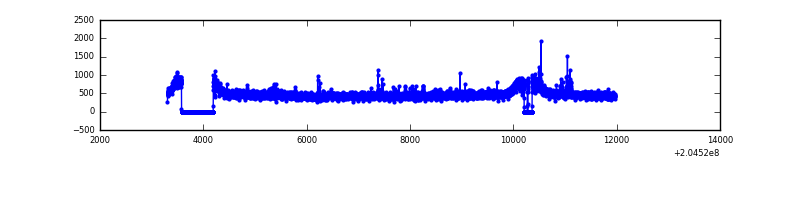 |
| C | 8660 | 7907 | 0 | 0 | 0.00% | 0.00% | 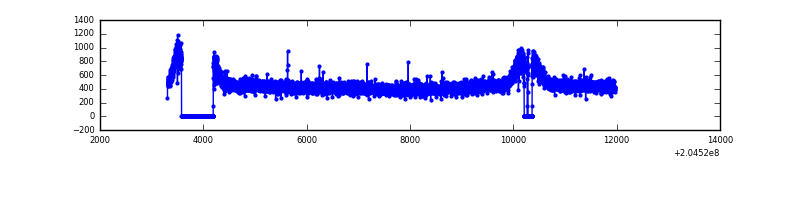 |
| D | 8660 | 7908 | 47 | 47 | 0.54% | 0.59% | 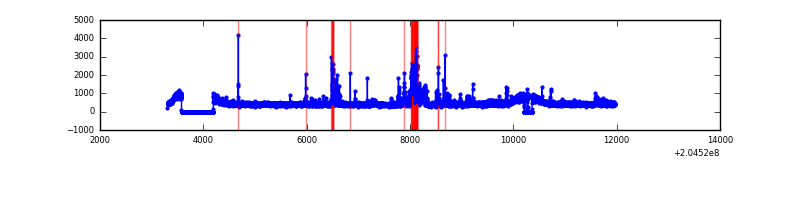 |
Top three noisy pixels from each quadrant. If the there are fewer than three noisy pixels in the level2.evt file, extra rows are filled as -1
| Pixel properties | Quadrant properties | ||||||
|---|---|---|---|---|---|---|---|
| Quadrant | DetID | PixID | Counts | Sigma | Mean | Median | Sigma |
| A | 0 | 118 | 53977 | 271.97 | 944 | 918 | 195.1 |
| A | 0 | 50 | 32991 | 164.4 | 944 | 918 | 195.1 |
| A | 0 | 226 | 14743 | 70.86 | 944 | 918 | 195.1 |
| B | 14 | 167 | 45450 | 239.46 | 953 | 927 | 185.9 |
| B | 15 | 204 | 33880 | 177.23 | 953 | 927 | 185.9 |
| B | 4 | 81 | 26647 | 138.33 | 953 | 927 | 185.9 |
| C | 13 | 61 | 7689 | 31.23 | 924 | 924 | 216.6 |
| C | 9 | 144 | 5953 | 23.22 | 924 | 924 | 216.6 |
| C | 3 | 202 | 2271 | 6.22 | 924 | 924 | 216.6 |
| D | 2 | 232 | 294935 | 1318.86 | 920 | 889 | 223.0 |
| D | 13 | 239 | 47260 | 207.98 | 920 | 889 | 223.0 |
| D | 13 | 223 | 35351 | 154.57 | 920 | 889 | 223.0 |
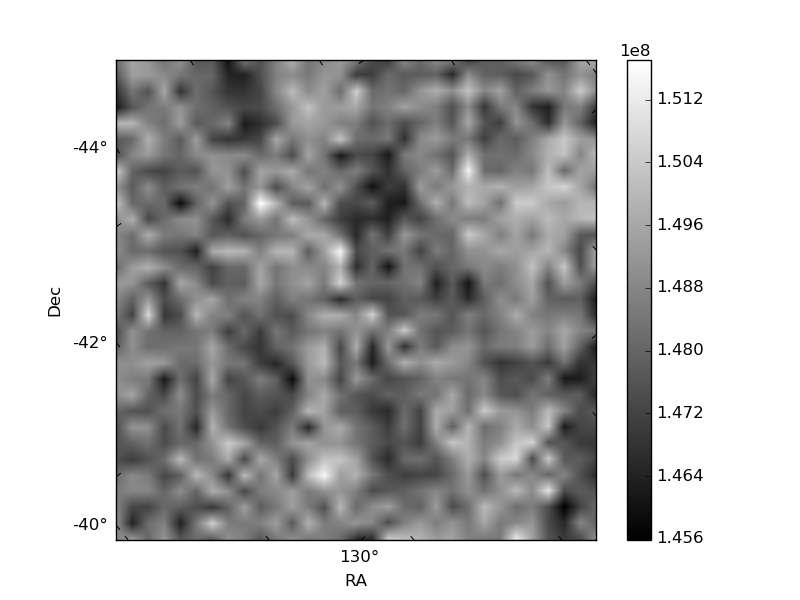
Histogram calculated using DETX and DETY for each event in the final _common_clean file
| Quadrant A | 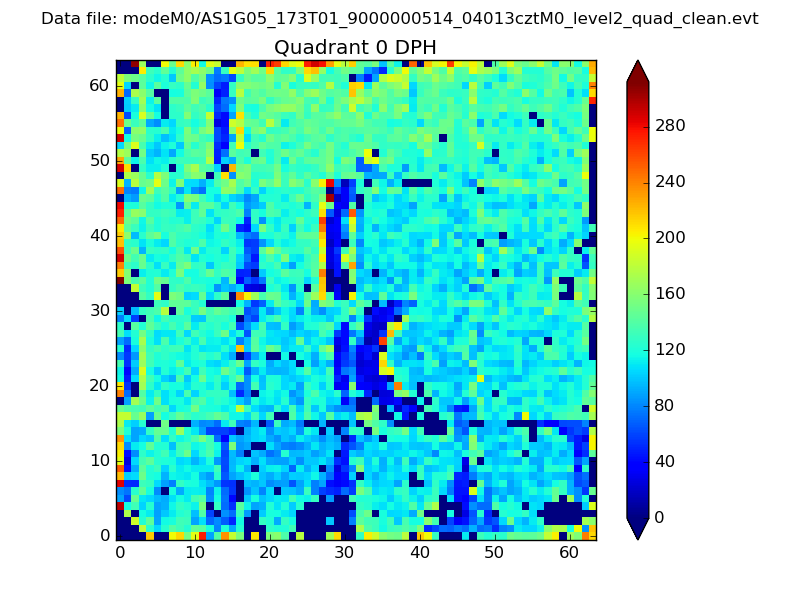 |
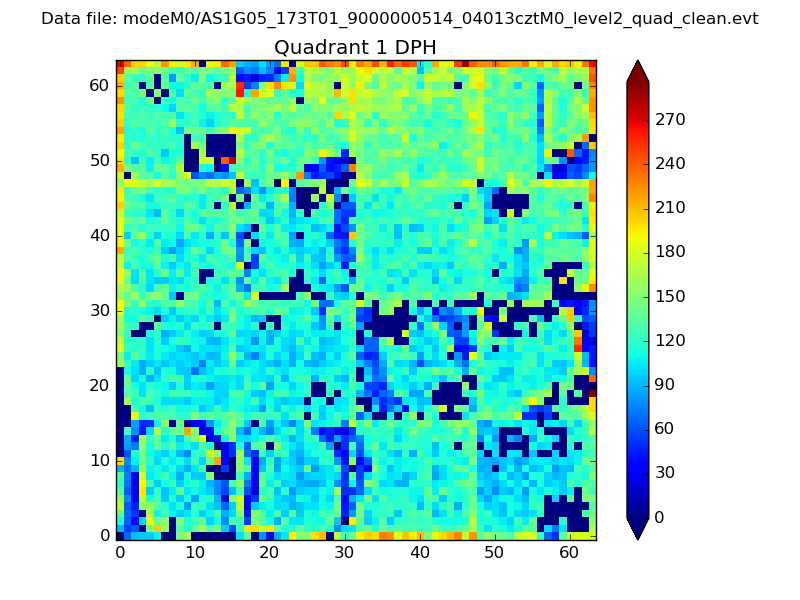 |
Quadrant B |
|---|---|---|---|
| Quadrant D |  |
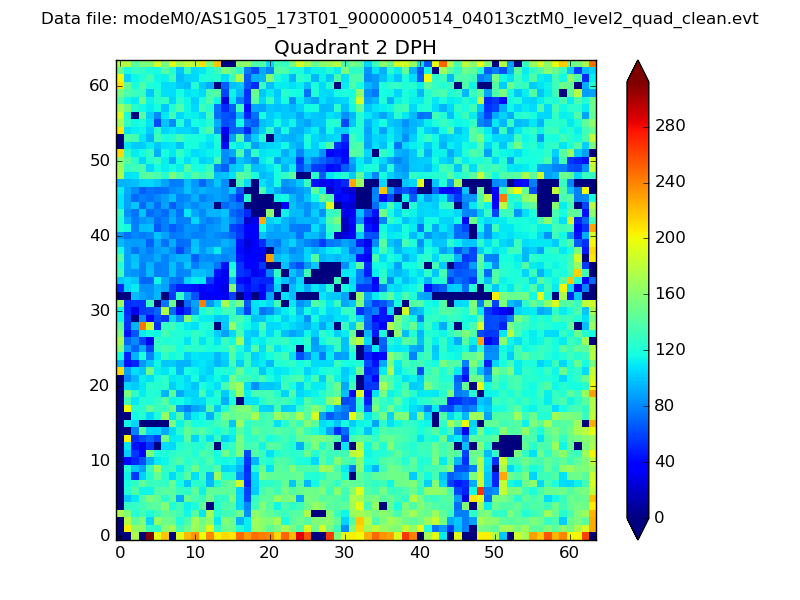 |
Quadrant C |
| Plot type | Count rate plots | Images |
|---|---|---|
| Comparison with Poisson distribution Blue bars denote a histogram of data divided into 1 sec bins. Red curve is a Poisson curve with rate = median count rate of data. |
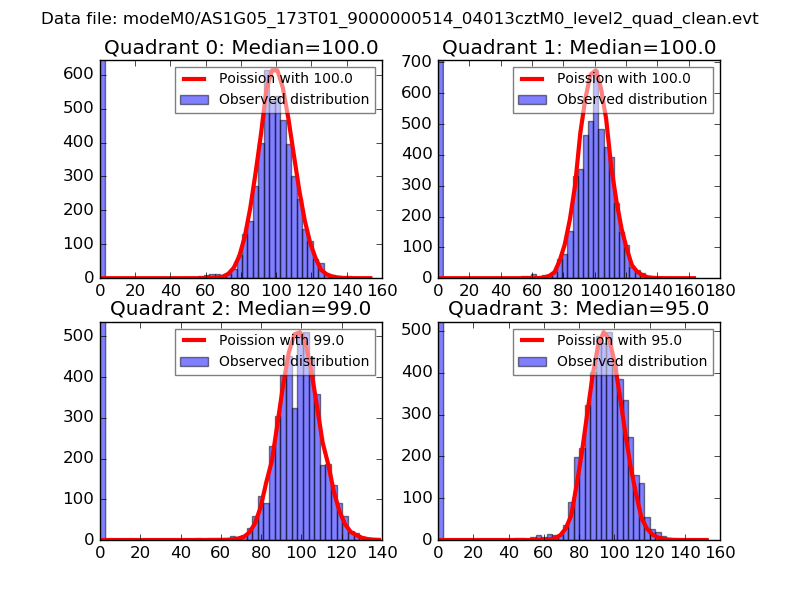 |
 |
| Quadrant-wise count rates Data is divided into 100 sec bins |
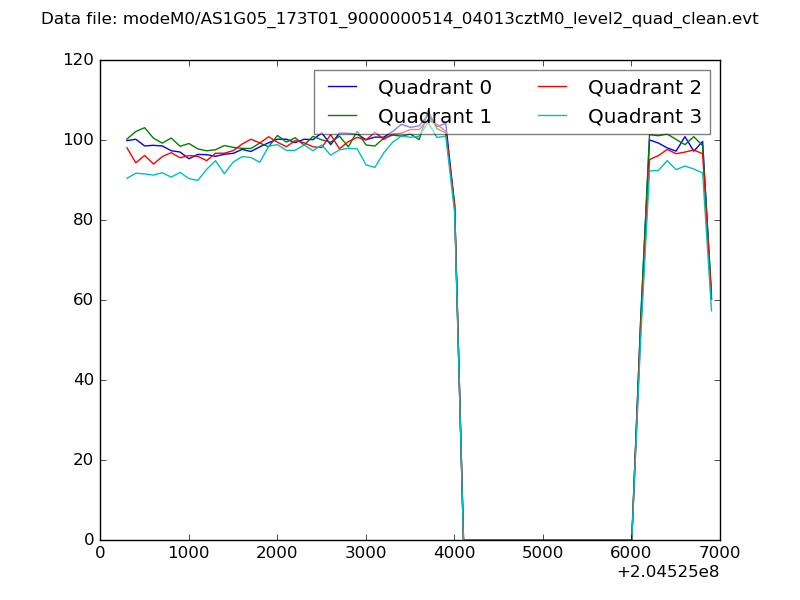 |
|
| Module-wise count rates for Quadrant A Data is divided into 100 sec bins |
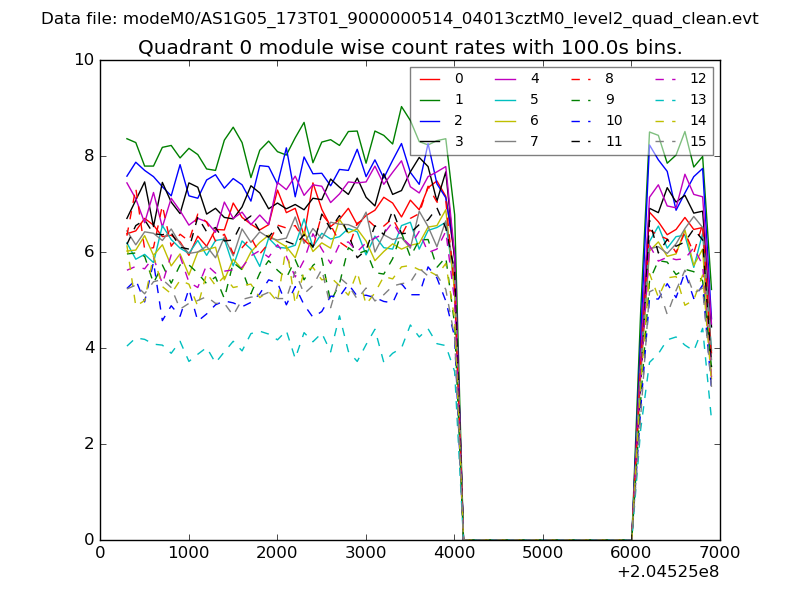 |
 |
| Module-wise count rates for Quadrant B Data is divided into 100 sec bins |
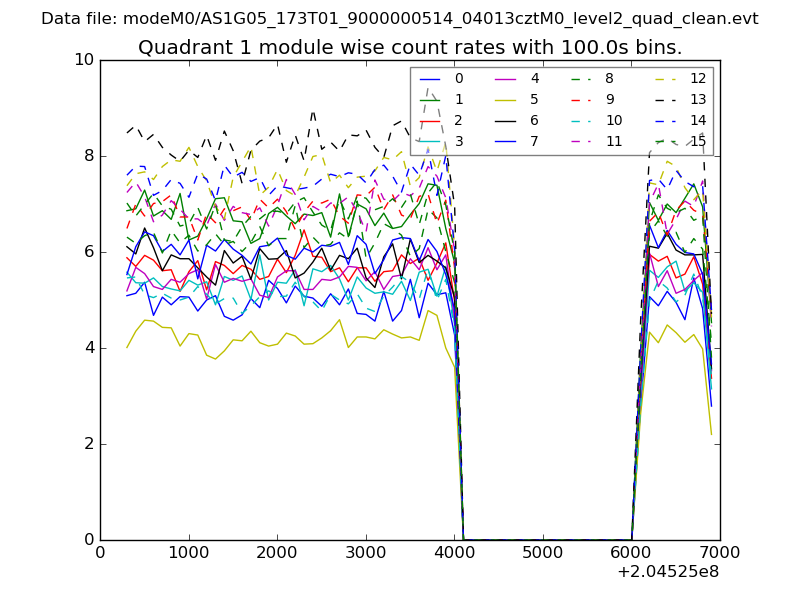 |
 |
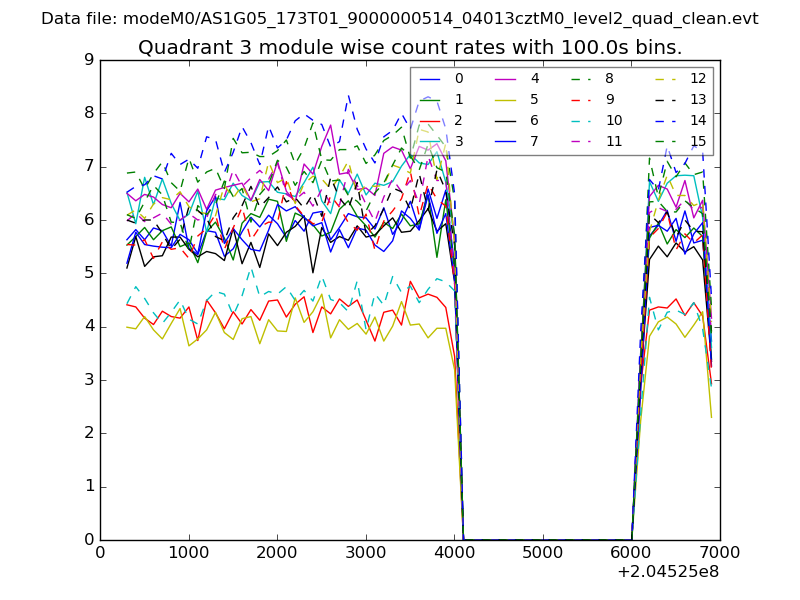
| Module-wise count rates for Quadrant C Data is divided into 100 sec bins |
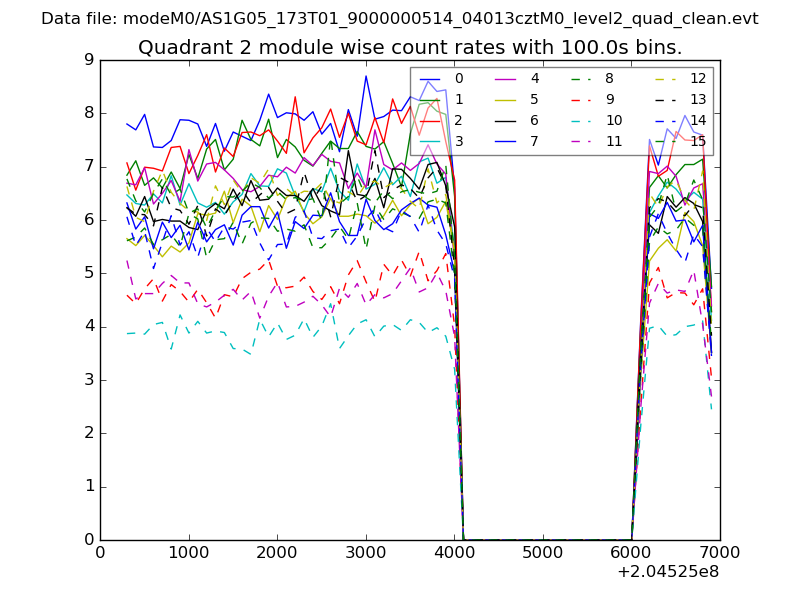 |
 |
| Module-wise count rates for Quadrant D Data is divided into 100 sec bins |
 |
 |
| Parameter | Plot |
|---|---|
| CZT HV Monitor | 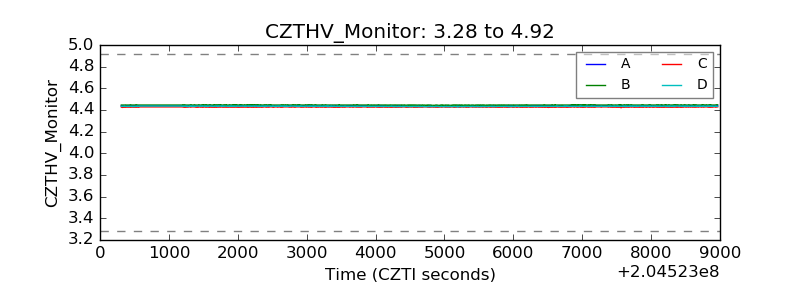 |
| D_VDD | 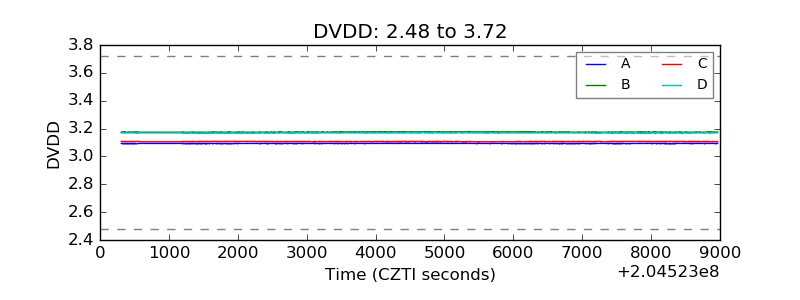 |
| Temperature 1 | 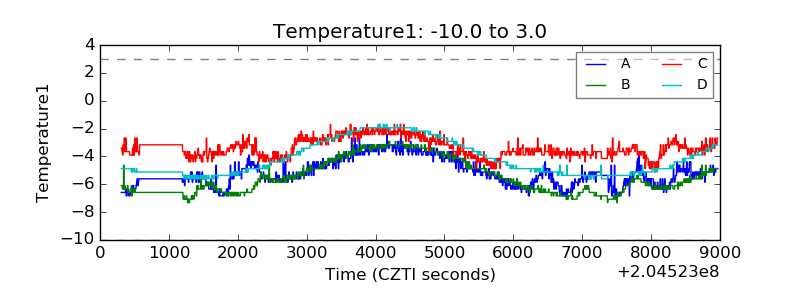 |
| Veto HV Monitor | 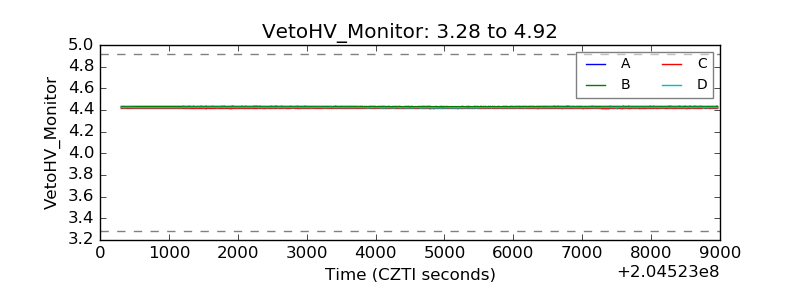 |
| Veto LLD | 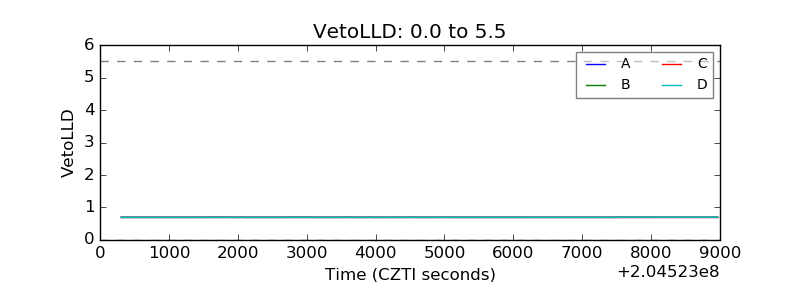 |
| Alpha Counter | 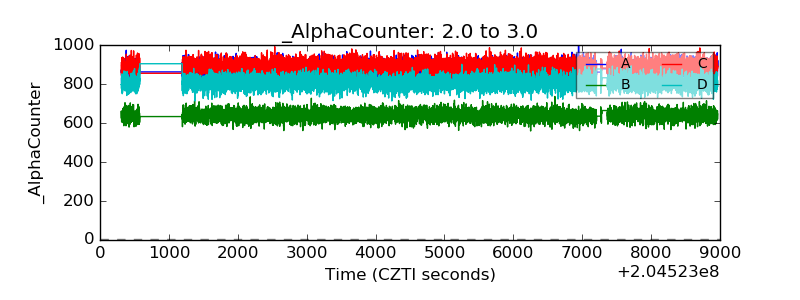 |
| _CPM_Rate | 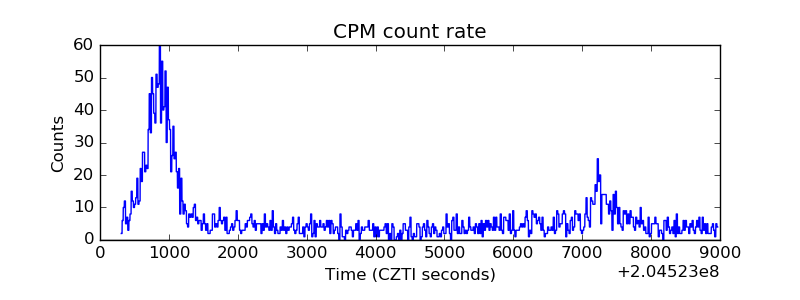 |
| CZT Counter | 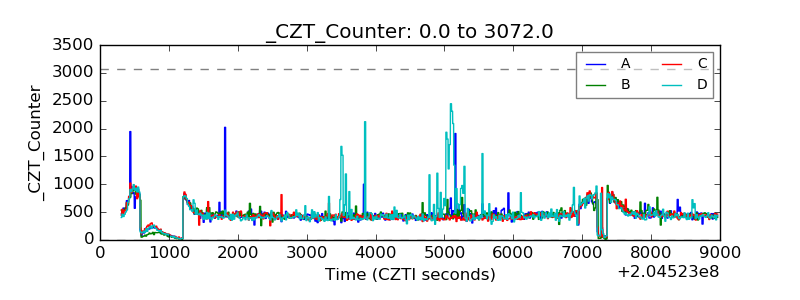 |
| +2.5 Volts monitor |  |
| +5 Volts monitor | 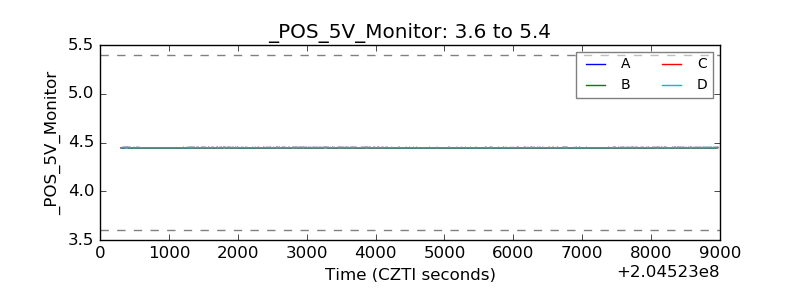 |
| _ROLL_ROT | 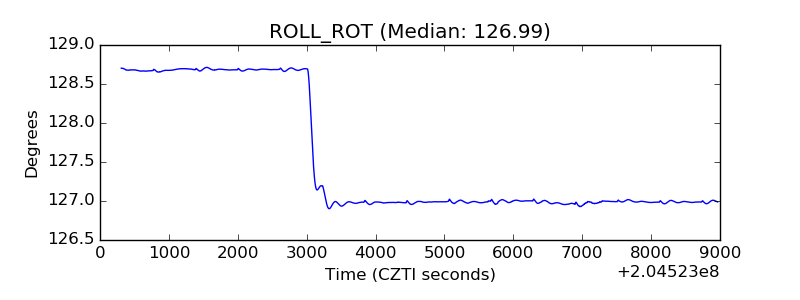 |
| _Roll_DEC | 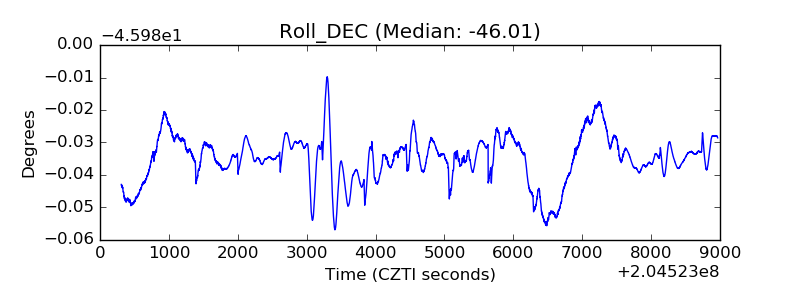 |
| _Roll_RA |  |
| Veto Counter | 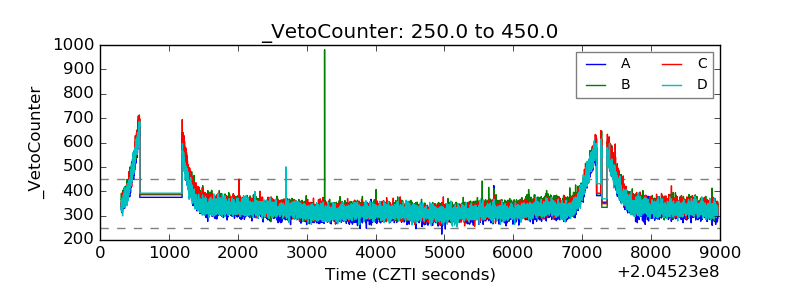 |