| Param | Original file | Final file |
|---|---|---|
| Filename | modeM0/AS1G05_173T01_9000000514_04017cztM0_level2.evt | modeM0/AS1G05_173T01_9000000514_04017cztM0_level2_quad_clean.evt |
| Size (bytes) | 764,334,720 | 121,538,880 |
| Size | 728.9 MB | 115.9 MB |
| Events in quadrant A | 6,023,329 | 721,888 |
| Events in quadrant B | 5,548,482 | 727,047 |
| Events in quadrant C | 5,057,768 | 727,955 |
| Events in quadrant D | 5,735,900 | 704,819 |
| Mode M9 | |||
|---|---|---|---|
| Quadrant | BADHDUFLAG | Total packets | Discarded packets |
| A | 0 | 11 | 0 |
| B | 0 | 11 | 0 |
| C | 0 | 11 | 0 |
| D | 0 | 11 | 0 |
| Mode M0 | |||
|---|---|---|---|
| Quadrant | BADHDUFLAG | Total packets | Discarded packets |
| A | 0 | 25980 | 45 |
| B | 0 | 24460 | 38 |
| C | 0 | 23624 | 39 |
| D | 0 | 25464 | 38 |
| Mode SS | |||
|---|---|---|---|
| Quadrant | BADHDUFLAG | Total packets | Discarded packets |
| A | 0 | 236 | 0 |
| B | 0 | 236 | 2 |
| C | 0 | 236 | 0 |
| D | 0 | 236 | 0 |
| Quadrant | Total seconds | Saturated seconds | Saturation percentage |
|---|---|---|---|
| A | 11542 | 315 | 2.729163% |
| B | 11538 | 184 | 1.594730% |
| C | 11537 | 76 | 0.658750% |
| D | 11542 | 153 | 1.325593% |
Noise dominated data is calculated using 1-second bins in cleaned event files. If a bin has >2000 counts, and if more than 50% of those come from <1% of pixels, then it is considered to be noise-dominated and hence unusable.
| Quadrant | # 1 sec bins | Bins with >0 counts | Bins with >2000 counts | High rate bins dominated by noise | Noise dominated (total time) | Noise dominated (detector-on time) | Marked lightcurve |
|---|---|---|---|---|---|---|---|
| A | 12710 | 11557 | 128 | 128 | 1.01% | 1.11% | 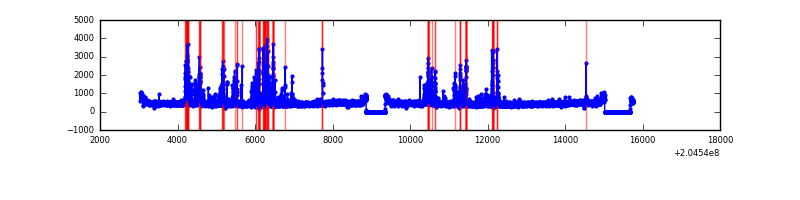 |
| B | 12710 | 11556 | 41 | 41 | 0.32% | 0.35% | 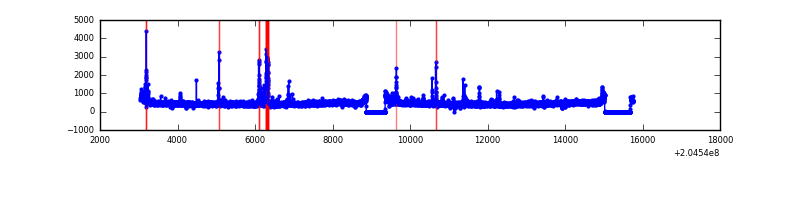 |
| C | 12710 | 11557 | 2 | 2 | 0.02% | 0.02% | 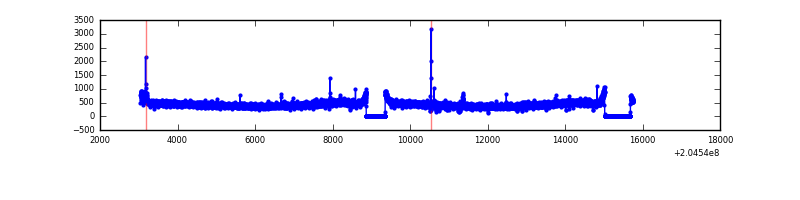 |
| D | 12711 | 11558 | 44 | 44 | 0.35% | 0.38% | 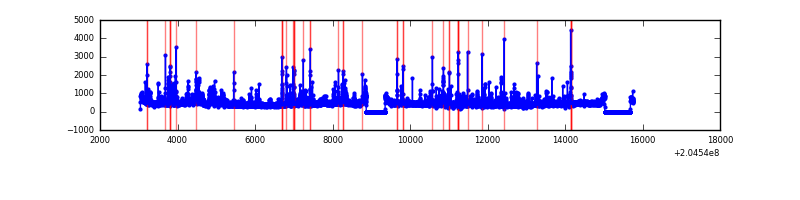 |
Top three noisy pixels from each quadrant. If the there are fewer than three noisy pixels in the level2.evt file, extra rows are filled as -1
| Pixel properties | Quadrant properties | ||||||
|---|---|---|---|---|---|---|---|
| Quadrant | DetID | PixID | Counts | Sigma | Mean | Median | Sigma |
| A | 0 | 50 | 609718 | 2253.05 | 1313 | 1280 | 270.1 |
| A | 0 | 118 | 281745 | 1038.56 | 1313 | 1280 | 270.1 |
| A | 0 | 226 | 40076 | 143.66 | 1313 | 1280 | 270.1 |
| B | 14 | 167 | 219939 | 849.33 | 1323 | 1292 | 257.4 |
| B | 4 | 81 | 99466 | 381.36 | 1323 | 1292 | 257.4 |
| B | 15 | 204 | 51176 | 193.77 | 1323 | 1292 | 257.4 |
| C | 8 | 128 | 18341 | 57.7 | 1275 | 1279 | 295.7 |
| C | 9 | 144 | 15868 | 49.33 | 1275 | 1279 | 295.7 |
| C | 10 | 65 | 12464 | 37.82 | 1275 | 1279 | 295.7 |
| D | 2 | 232 | 252242 | 811.09 | 1275 | 1238 | 309.5 |
| D | 9 | 82 | 203711 | 654.27 | 1275 | 1238 | 309.5 |
| D | 10 | 246 | 140583 | 450.28 | 1275 | 1238 | 309.5 |
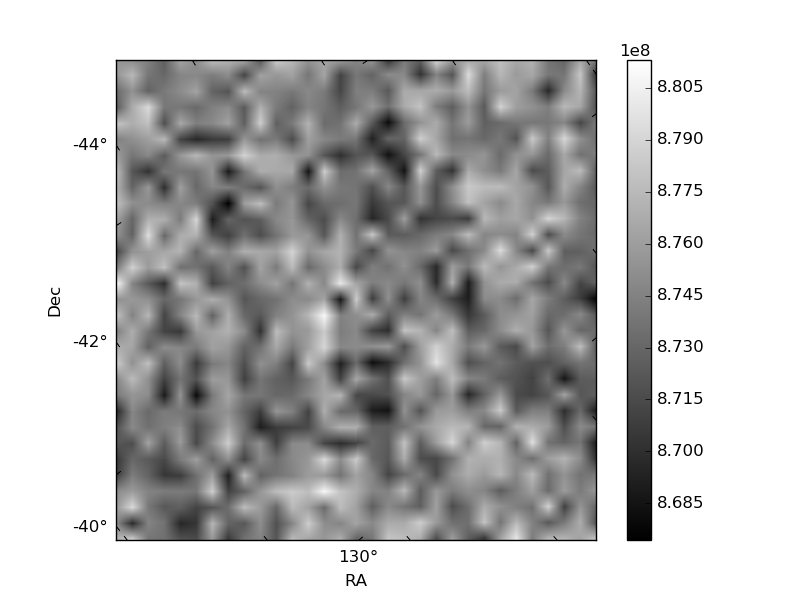
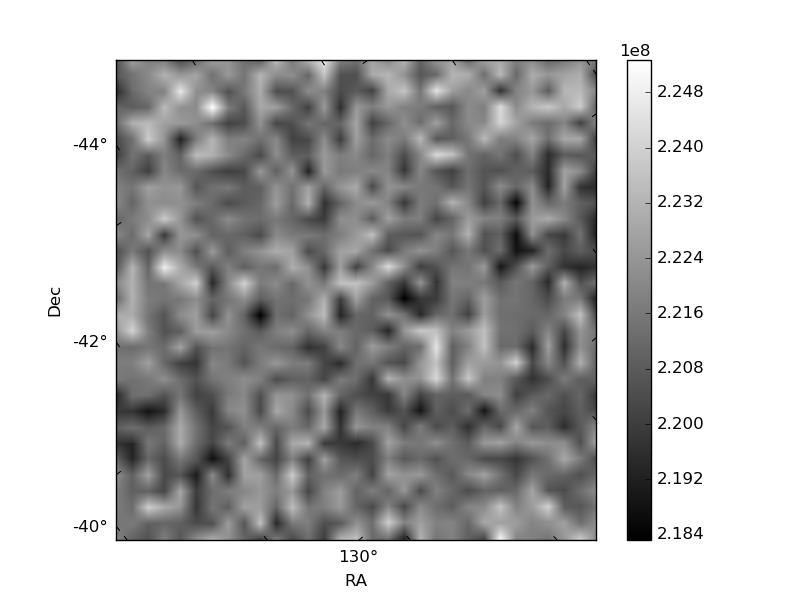
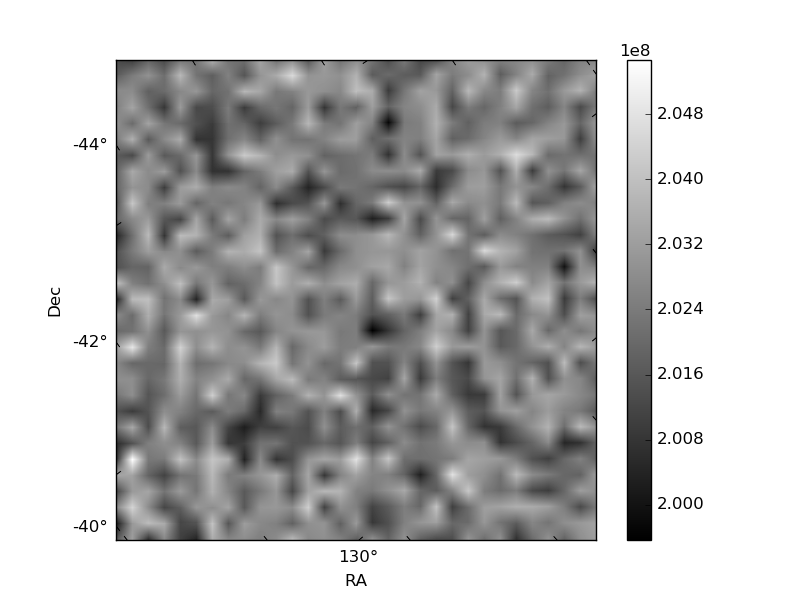
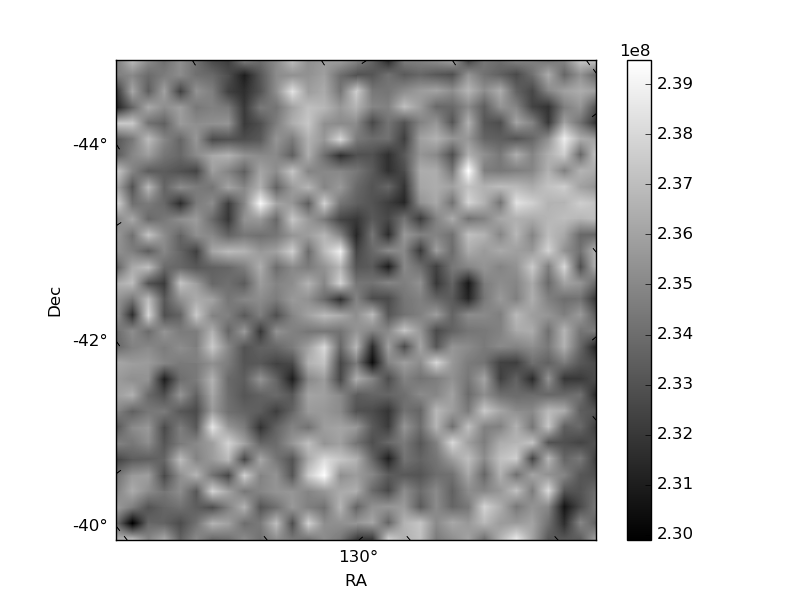
Histogram calculated using DETX and DETY for each event in the final _common_clean file
| Quadrant A | 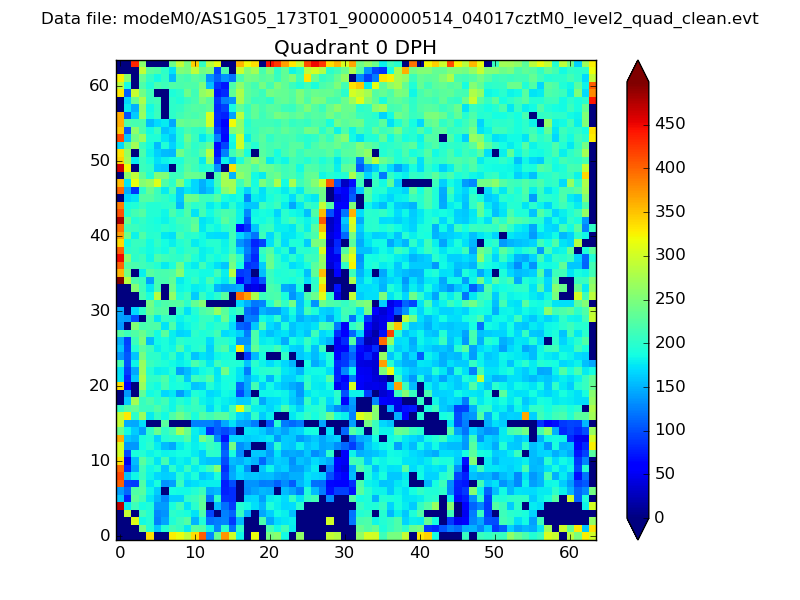 |
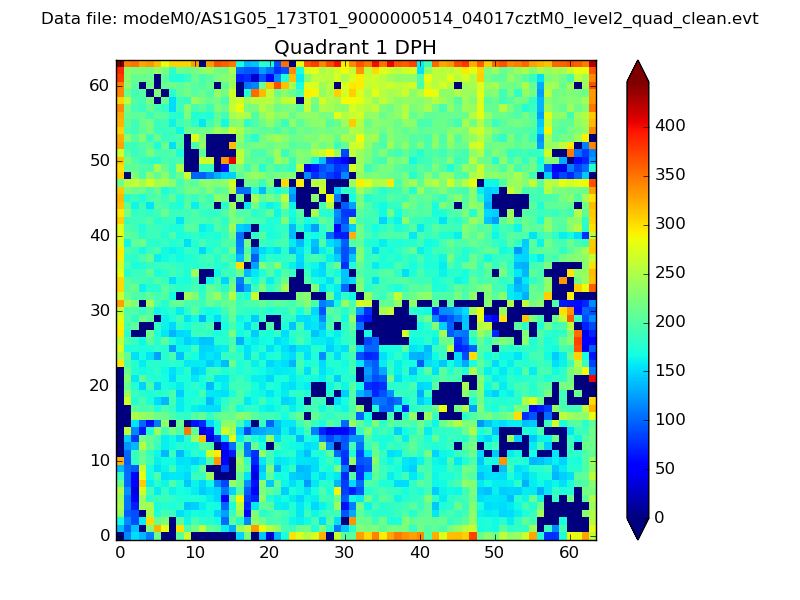 |
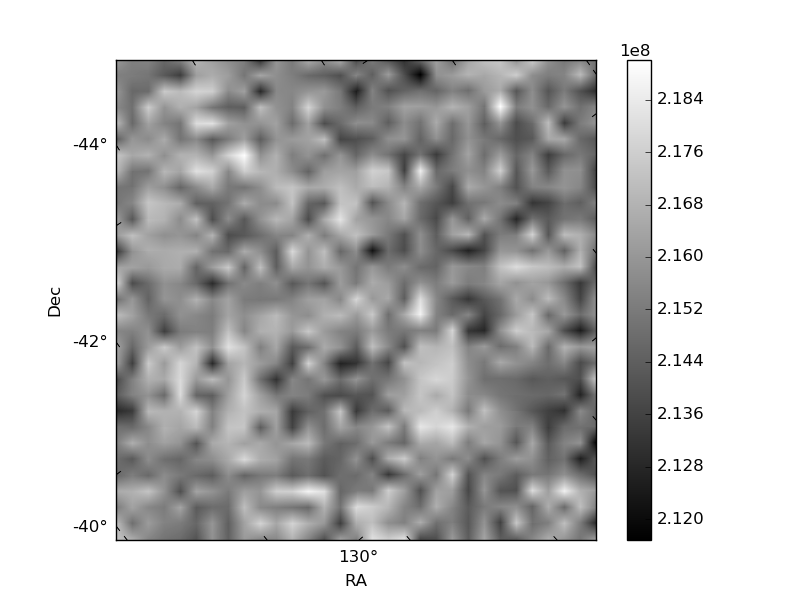
Quadrant B |
|---|---|---|---|
| Quadrant D | 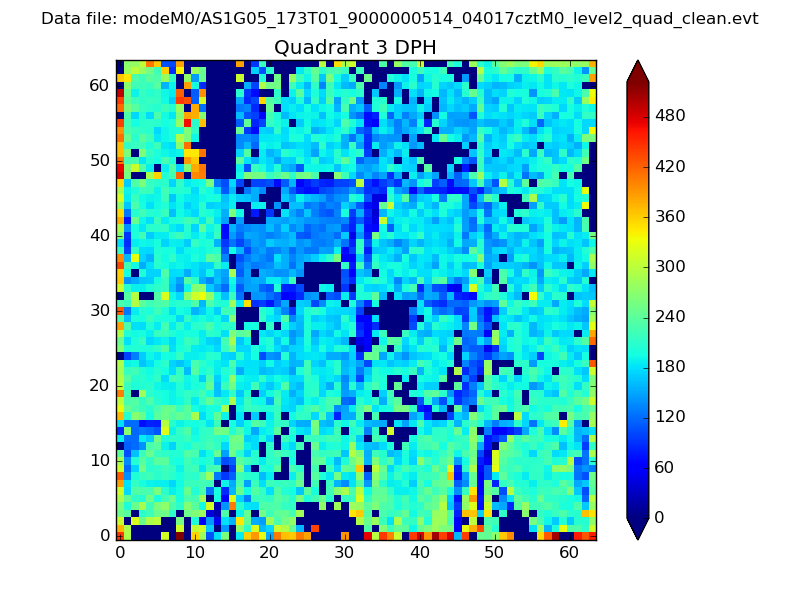 |
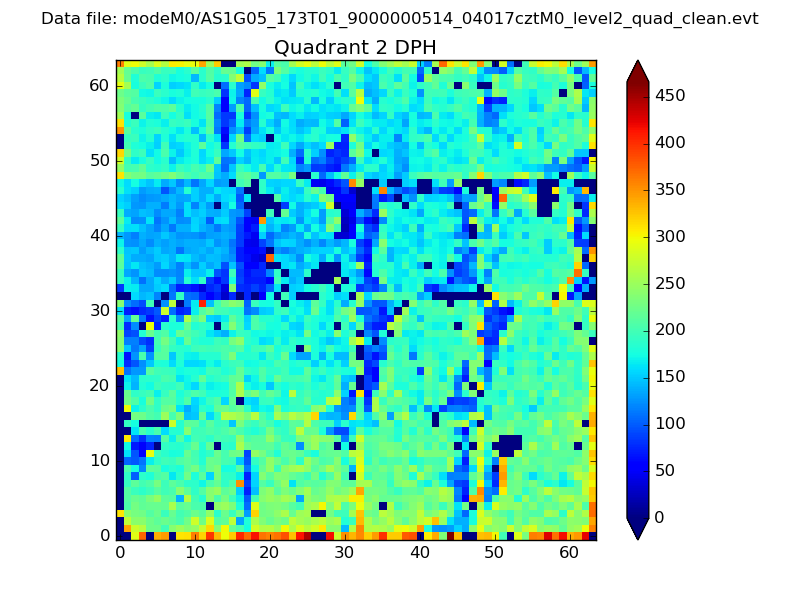 |
Quadrant C |
| Plot type | Count rate plots | Images |
|---|---|---|
| Comparison with Poisson distribution Blue bars denote a histogram of data divided into 1 sec bins. Red curve is a Poisson curve with rate = median count rate of data. |
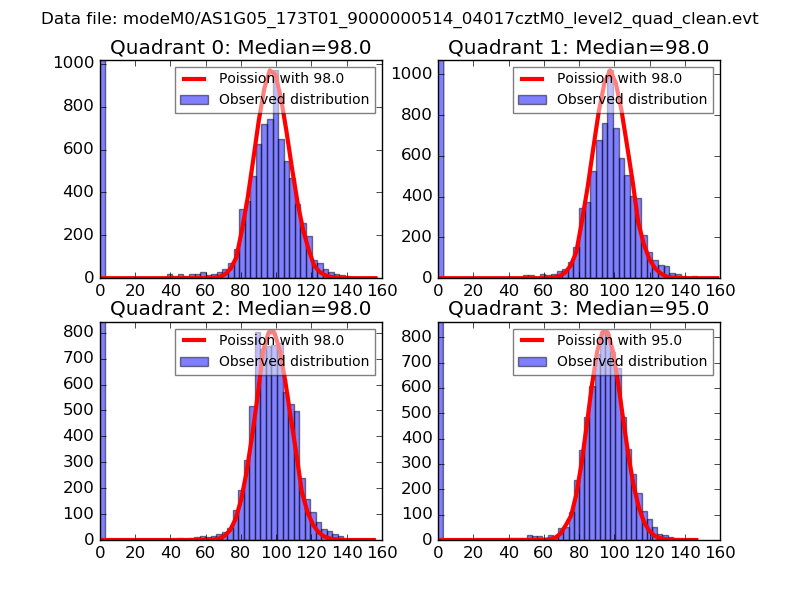 |
 |
| Quadrant-wise count rates Data is divided into 100 sec bins |
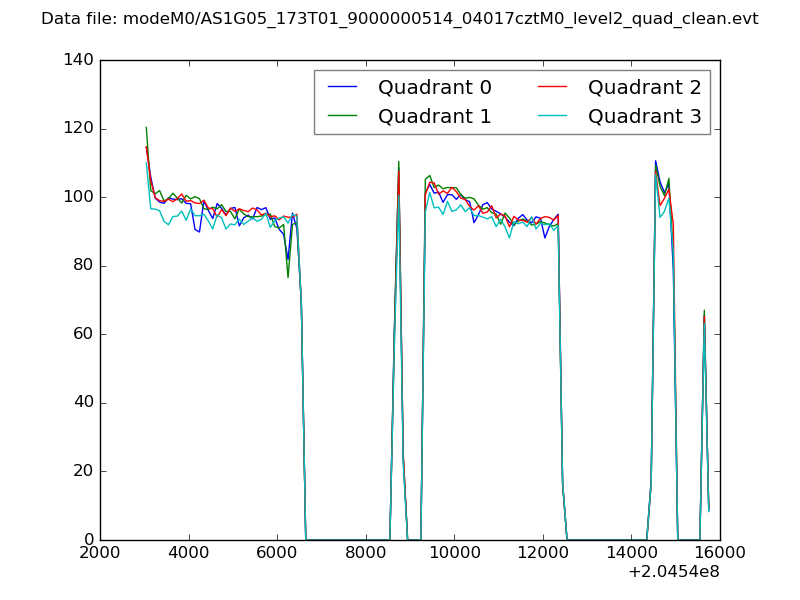 |
|
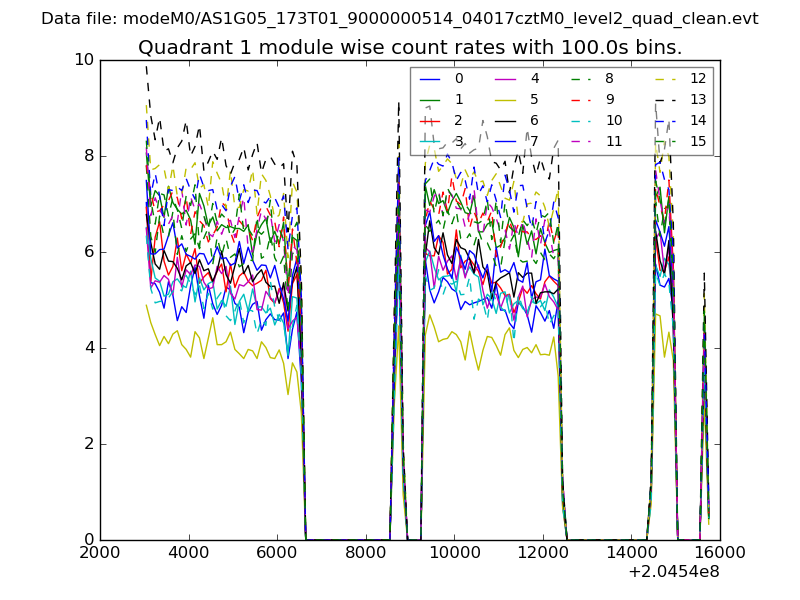
| Module-wise count rates for Quadrant A Data is divided into 100 sec bins |
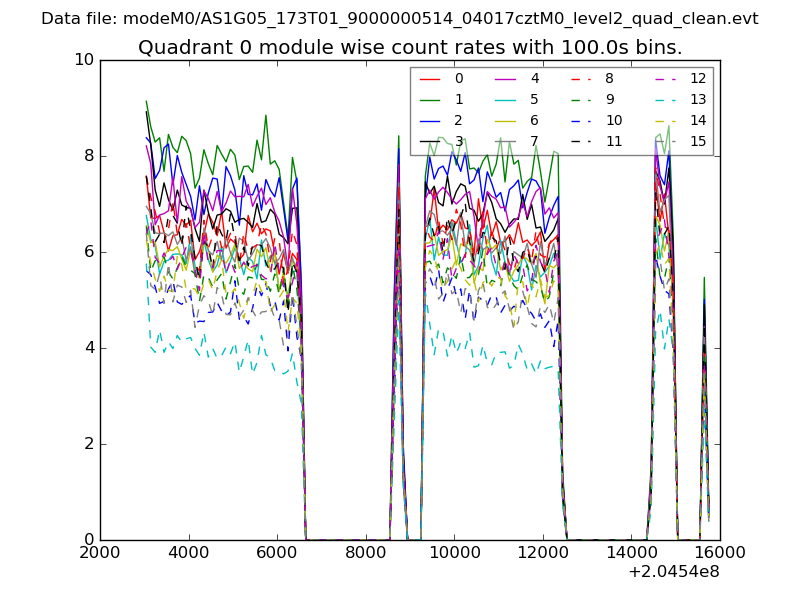 |
 |
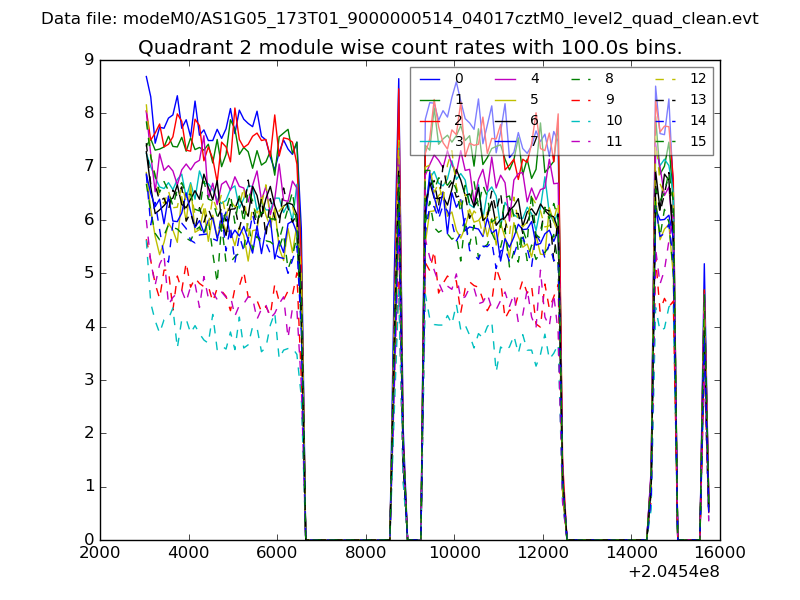
| Module-wise count rates for Quadrant B Data is divided into 100 sec bins |
 |
 |
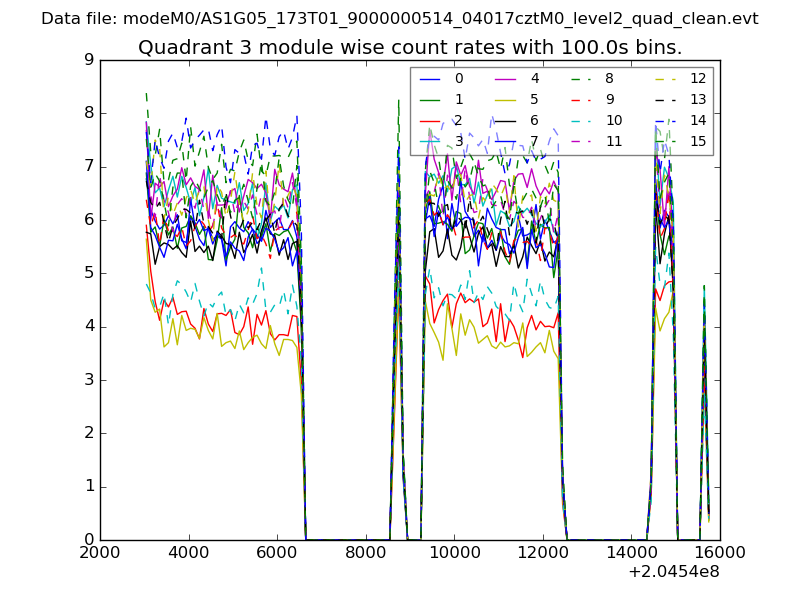
| Module-wise count rates for Quadrant C Data is divided into 100 sec bins |
 |
 |
| Module-wise count rates for Quadrant D Data is divided into 100 sec bins |
 |
 |
| Parameter | Plot |
|---|---|
| CZT HV Monitor | 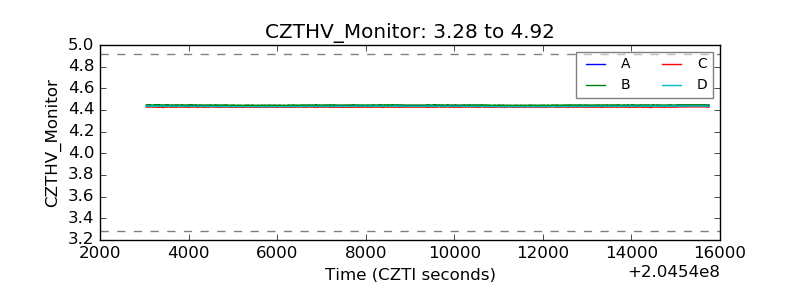 |
| D_VDD | 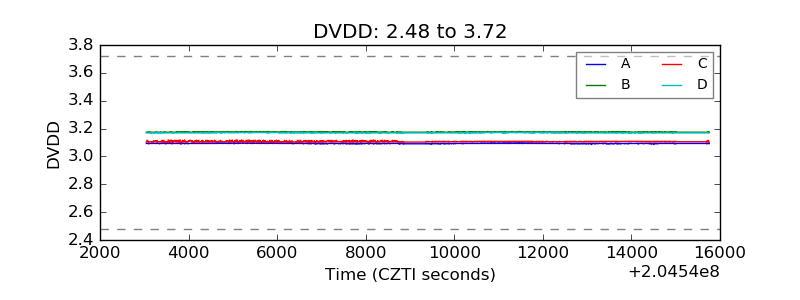 |
| Temperature 1 | 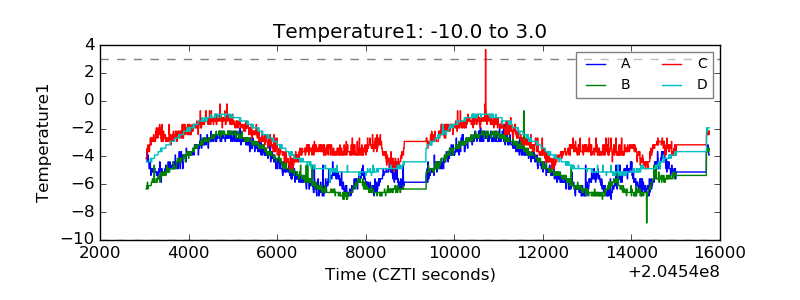 |
| Veto HV Monitor | 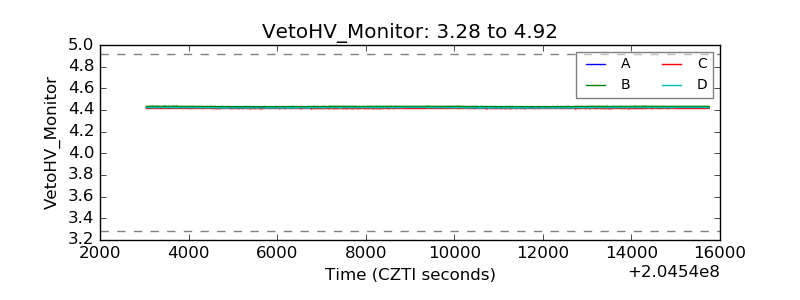 |
| Veto LLD | 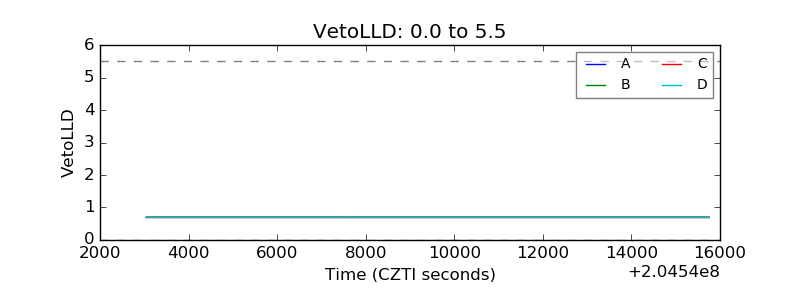 |
| Alpha Counter | 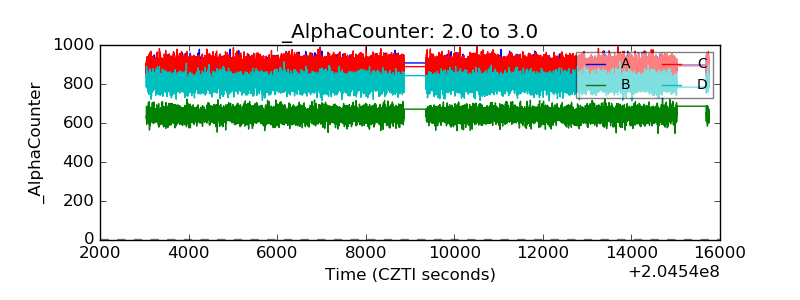 |
| _CPM_Rate | 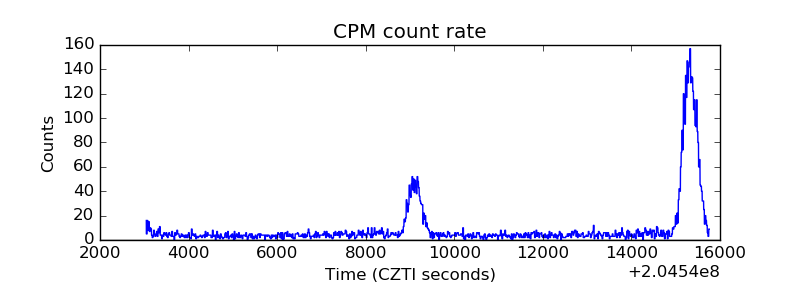 |
| CZT Counter | 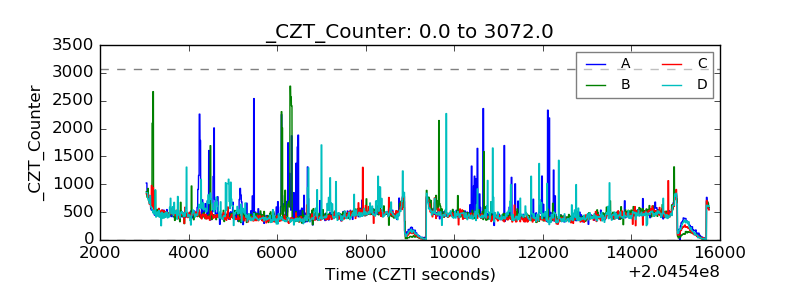 |
| +2.5 Volts monitor |  |
| +5 Volts monitor |  |
| _ROLL_ROT | 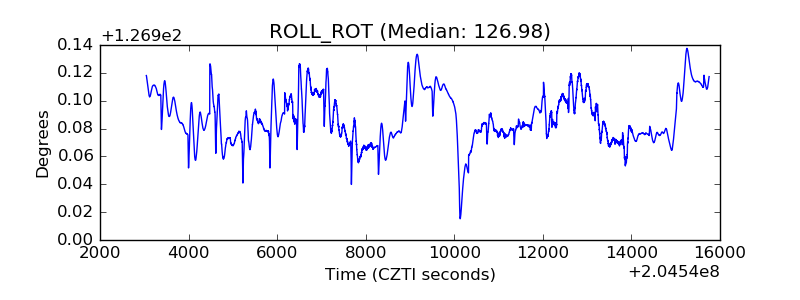 |
| _Roll_DEC | 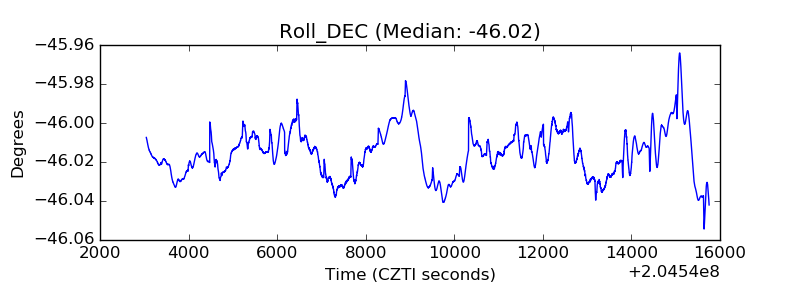 |
| _Roll_RA | 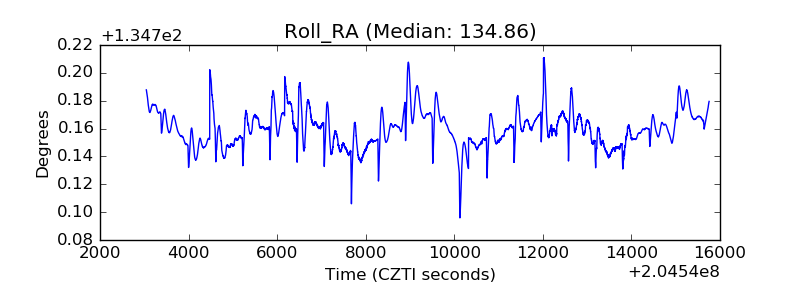 |
| Veto Counter | 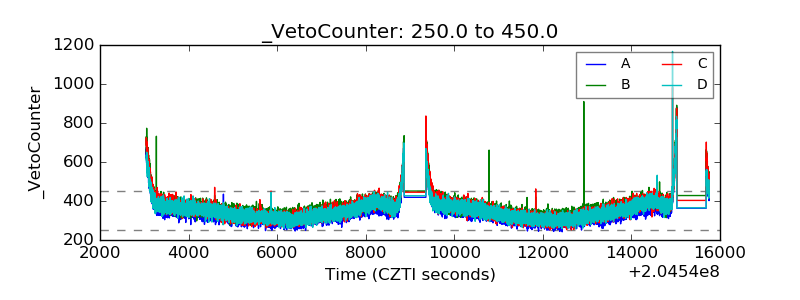 |