| Param | Original file | Final file |
|---|---|---|
| Filename | modeM0/AS1G05_173T01_9000000514_04018cztM0_level2.evt | modeM0/AS1G05_173T01_9000000514_04018cztM0_level2_quad_clean.evt |
| Size (bytes) | 462,729,600 | 79,200,000 |
| Size | 441.3 MB | 75.5 MB |
| Events in quadrant A | 3,476,787 | 485,886 |
| Events in quadrant B | 3,321,608 | 487,010 |
| Events in quadrant C | 2,996,371 | 484,454 |
| Events in quadrant D | 3,753,142 | 463,191 |
| Mode M9 | |||
|---|---|---|---|
| Quadrant | BADHDUFLAG | Total packets | Discarded packets |
| A | 0 | 12 | 0 |
| B | 0 | 12 | 0 |
| C | 0 | 12 | 0 |
| D | 0 | 13 | 0 |
| Mode M0 | |||
|---|---|---|---|
| Quadrant | BADHDUFLAG | Total packets | Discarded packets |
| A | 0 | 15048 | 3 |
| B | 0 | 14385 | 2 |
| C | 0 | 13920 | 2 |
| D | 0 | 16295 | 2 |
| Mode SS | |||
|---|---|---|---|
| Quadrant | BADHDUFLAG | Total packets | Discarded packets |
| A | 0 | 140 | 0 |
| B | 0 | 140 | 0 |
| C | 0 | 140 | 0 |
| D | 0 | 140 | 0 |
| Quadrant | Total seconds | Saturated seconds | Saturation percentage |
|---|---|---|---|
| A | 6849 | 110 | 1.606074% |
| B | 6849 | 46 | 0.671631% |
| C | 6849 | 15 | 0.219010% |
| D | 6849 | 225 | 3.285151% |
Noise dominated data is calculated using 1-second bins in cleaned event files. If a bin has >2000 counts, and if more than 50% of those come from <1% of pixels, then it is considered to be noise-dominated and hence unusable.
| Quadrant | # 1 sec bins | Bins with >0 counts | Bins with >2000 counts | High rate bins dominated by noise | Noise dominated (total time) | Noise dominated (detector-on time) | Marked lightcurve |
|---|---|---|---|---|---|---|---|
| A | 7684 | 6850 | 42 | 42 | 0.55% | 0.61% | 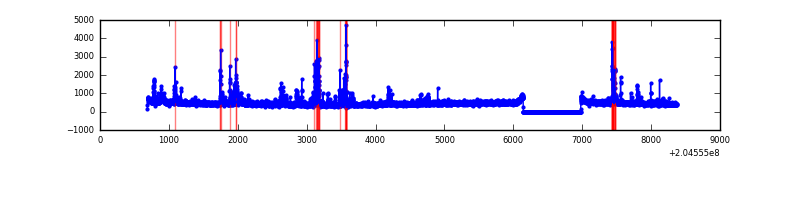 |
| B | 7684 | 6850 | 4 | 4 | 0.05% | 0.06% | 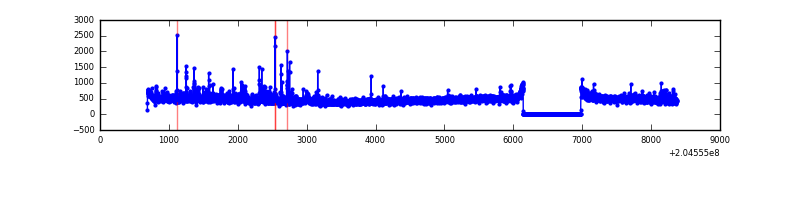 |
| C | 7684 | 6850 | 1 | 1 | 0.01% | 0.01% | 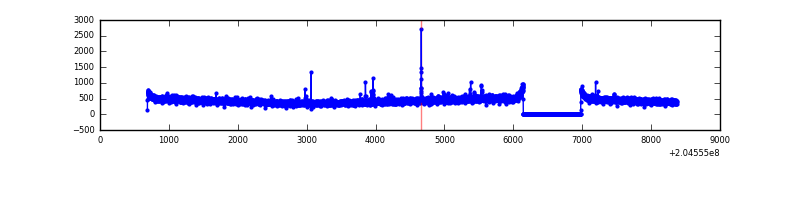 |
| D | 7684 | 6850 | 151 | 151 | 1.97% | 2.20% |  |
Top three noisy pixels from each quadrant. If the there are fewer than three noisy pixels in the level2.evt file, extra rows are filled as -1
| Pixel properties | Quadrant properties | ||||||
|---|---|---|---|---|---|---|---|
| Quadrant | DetID | PixID | Counts | Sigma | Mean | Median | Sigma |
| A | 0 | 50 | 261242 | 1621.7 | 783 | 766 | 160.6 |
| A | 0 | 118 | 114608 | 708.77 | 783 | 766 | 160.6 |
| A | 12 | 247 | 59029 | 362.74 | 783 | 766 | 160.6 |
| B | 15 | 204 | 99893 | 647.76 | 788 | 768 | 153.0 |
| B | 4 | 81 | 67728 | 437.57 | 788 | 768 | 153.0 |
| B | 14 | 167 | 59440 | 383.41 | 788 | 768 | 153.0 |
| C | 8 | 128 | 17544 | 94.95 | 752 | 754 | 176.8 |
| C | 9 | 144 | 14377 | 77.04 | 752 | 754 | 176.8 |
| C | 8 | 112 | 8499 | 43.8 | 752 | 754 | 176.8 |
| D | 2 | 232 | 727391 | 3985.53 | 748 | 726 | 182.3 |
| D | 12 | 110 | 85997 | 467.68 | 748 | 726 | 182.3 |
| D | 13 | 137 | 33036 | 177.21 | 748 | 726 | 182.3 |
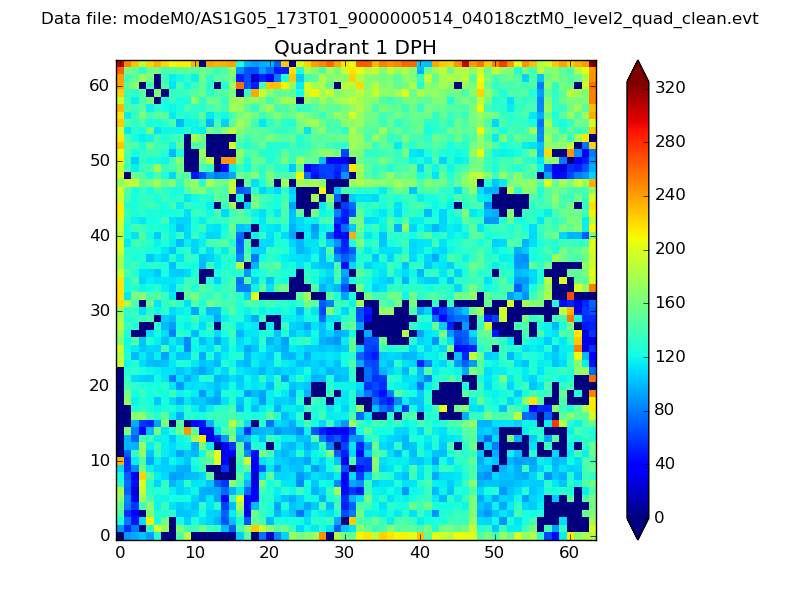
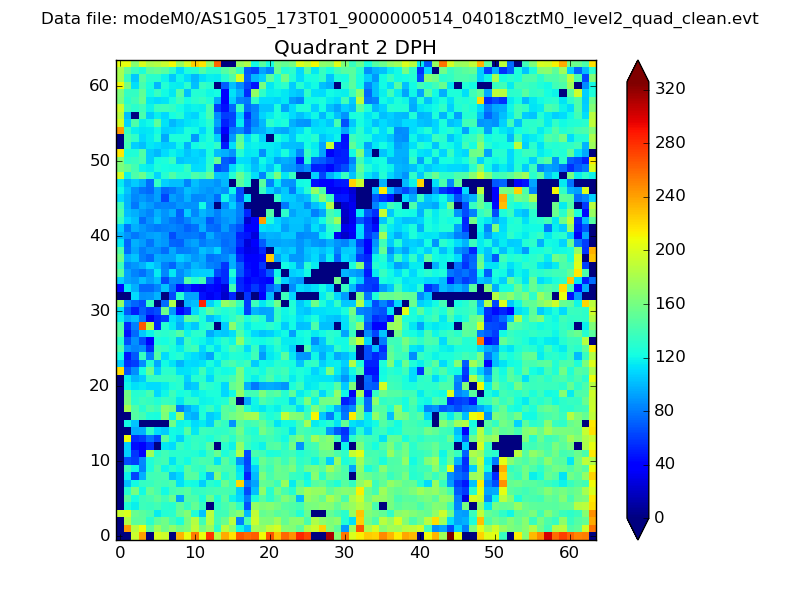
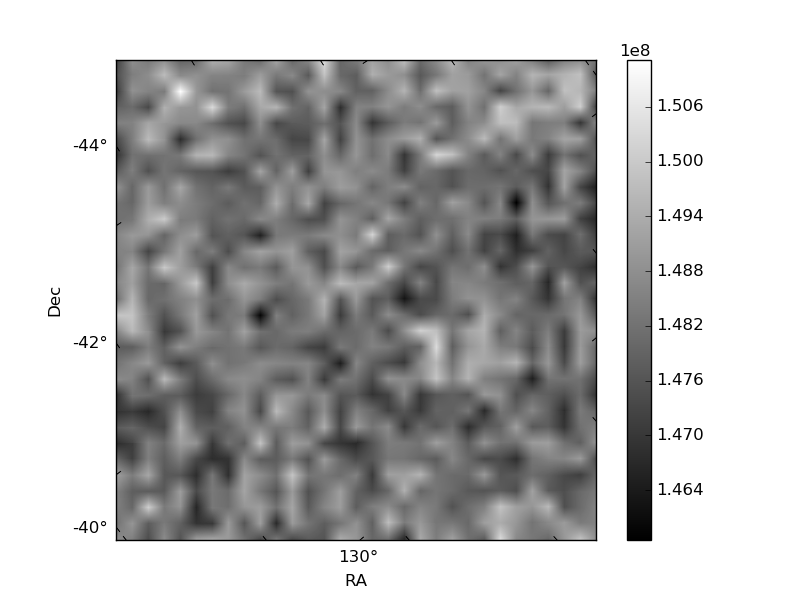
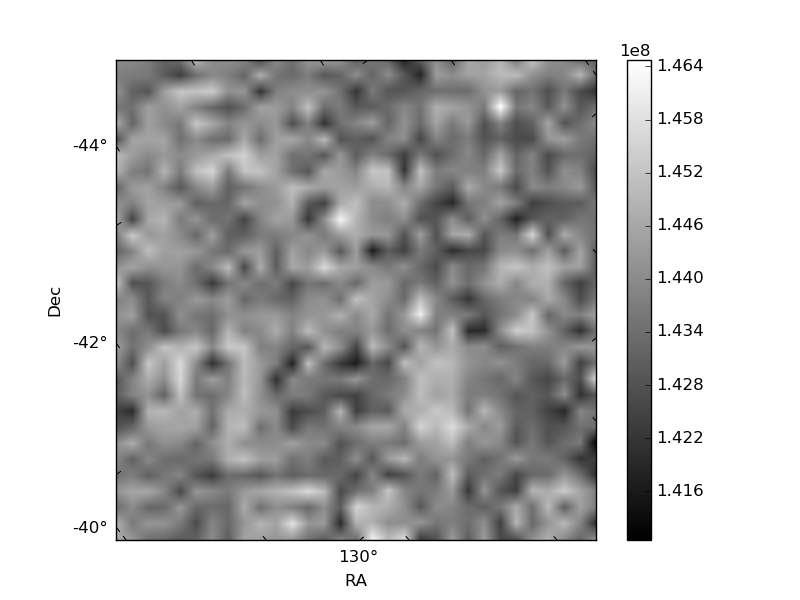
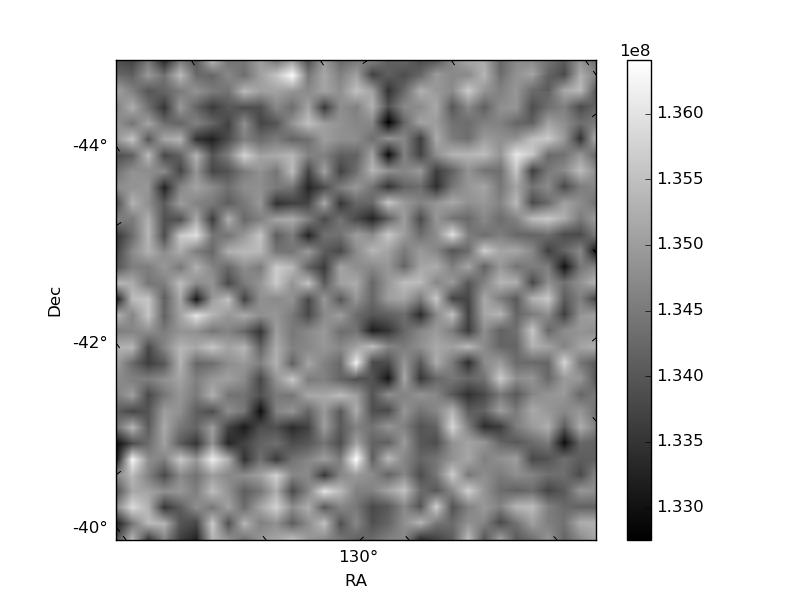
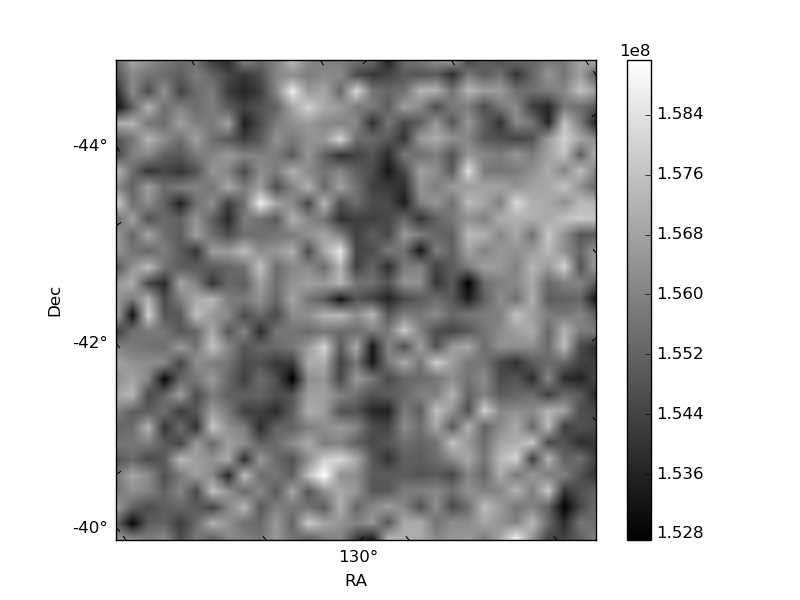
Histogram calculated using DETX and DETY for each event in the final _common_clean file
| Quadrant A | 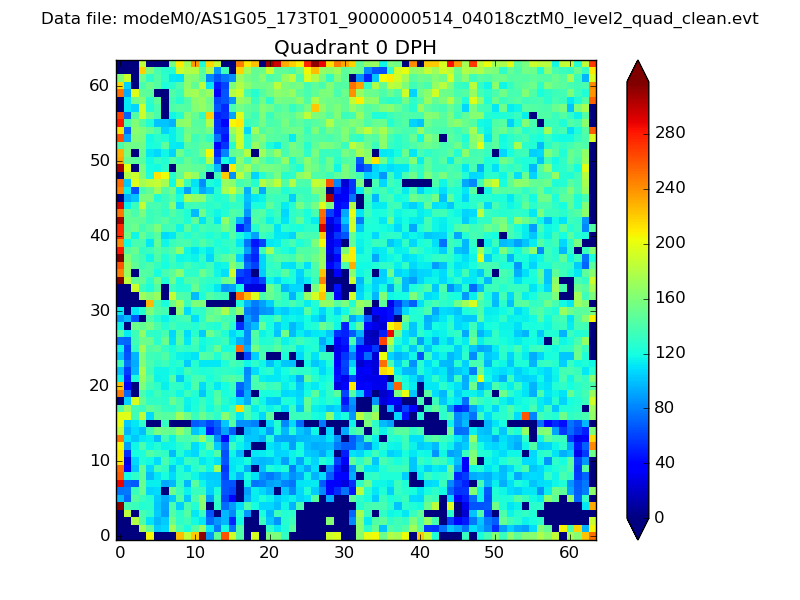 |
 |
Quadrant B |
|---|---|---|---|
| Quadrant D | 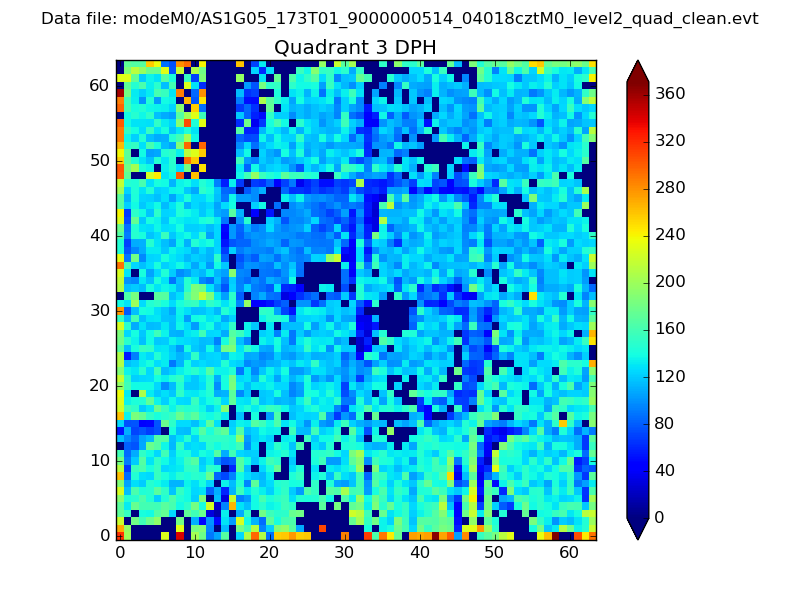 |
 |
Quadrant C |
| Plot type | Count rate plots | Images |
|---|---|---|
| Comparison with Poisson distribution Blue bars denote a histogram of data divided into 1 sec bins. Red curve is a Poisson curve with rate = median count rate of data. |
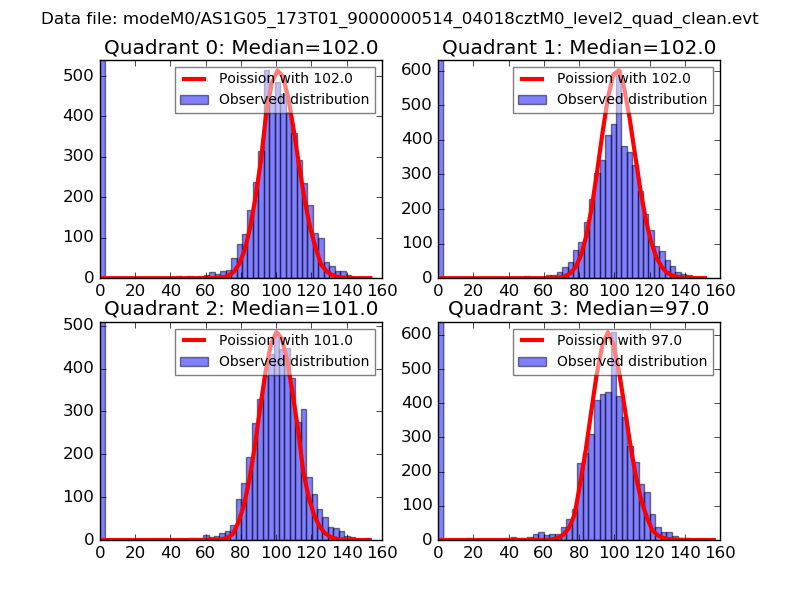 |
 |
| Quadrant-wise count rates Data is divided into 100 sec bins |
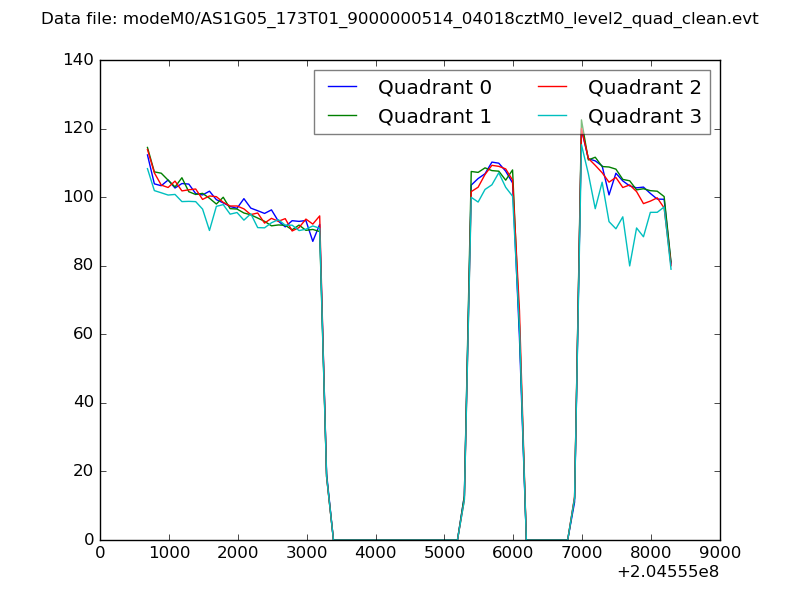 |
|
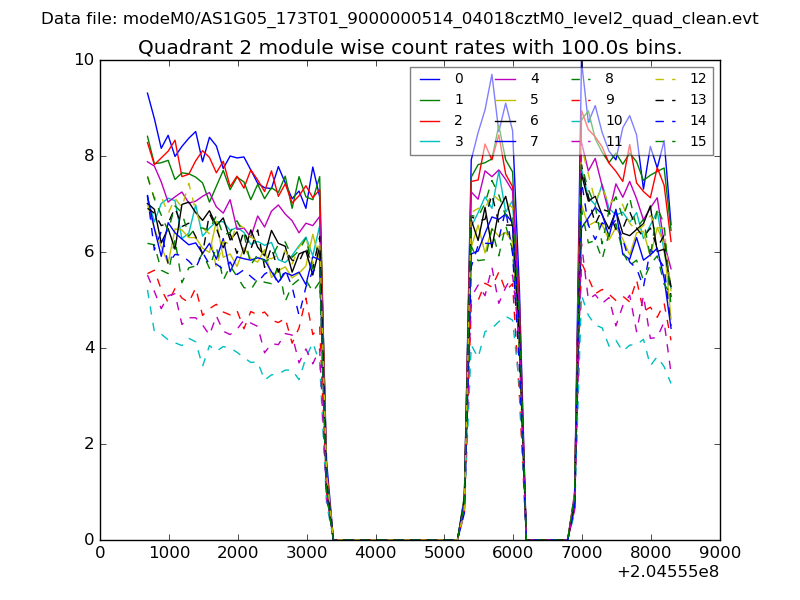
| Module-wise count rates for Quadrant A Data is divided into 100 sec bins |
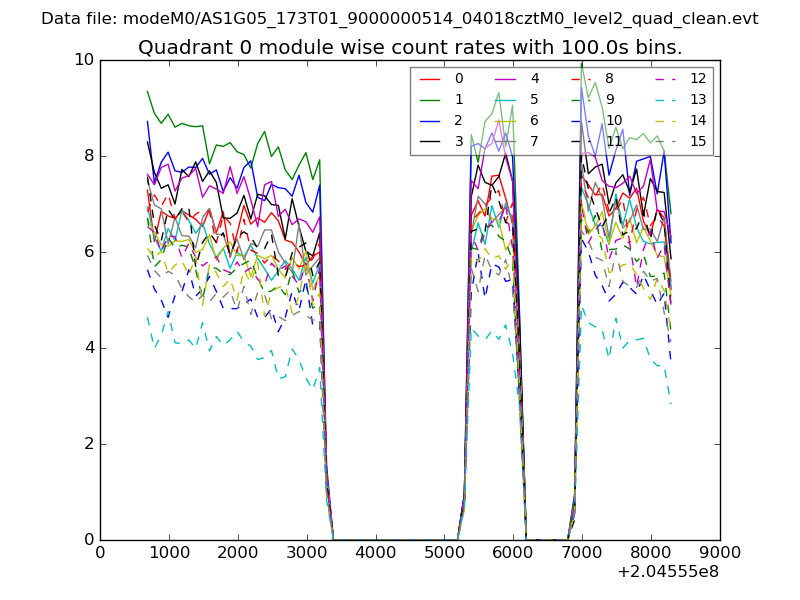 |
 |
| Module-wise count rates for Quadrant B Data is divided into 100 sec bins |
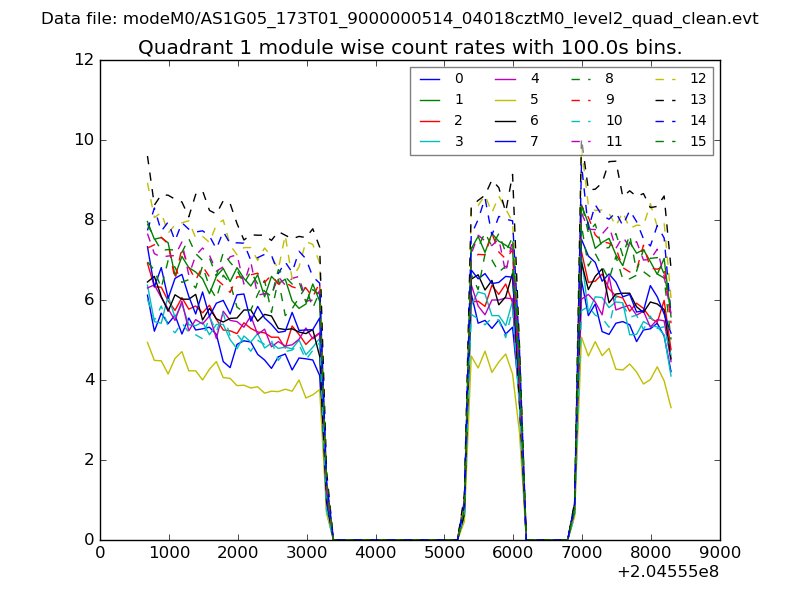 |
 |
| Module-wise count rates for Quadrant C Data is divided into 100 sec bins |
 |
 |
| Module-wise count rates for Quadrant D Data is divided into 100 sec bins |
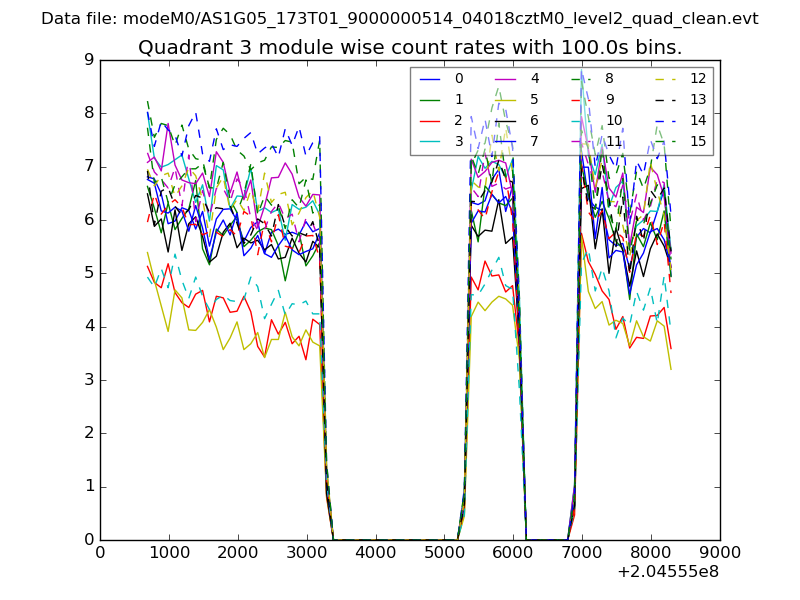 |
 |
| Parameter | Plot |
|---|---|
| CZT HV Monitor | 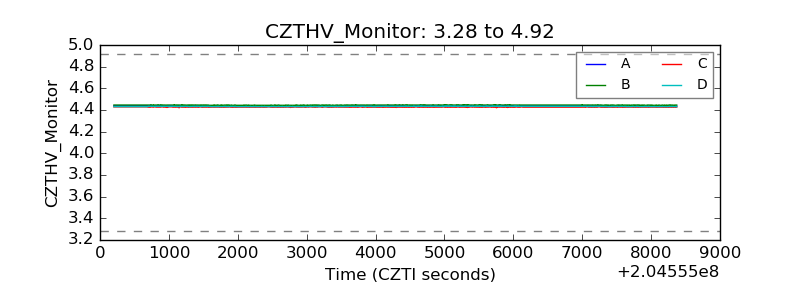 |
| D_VDD |  |
| Temperature 1 | 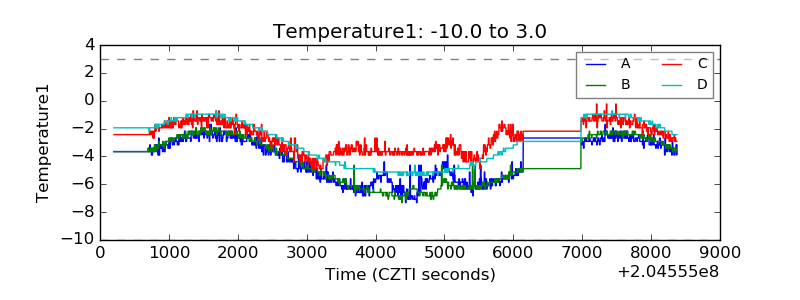 |
| Veto HV Monitor | 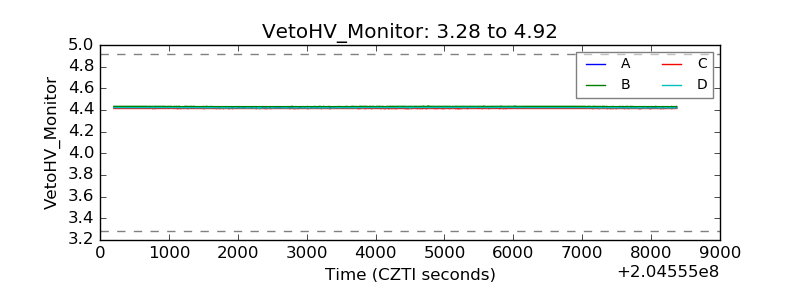 |
| Veto LLD | 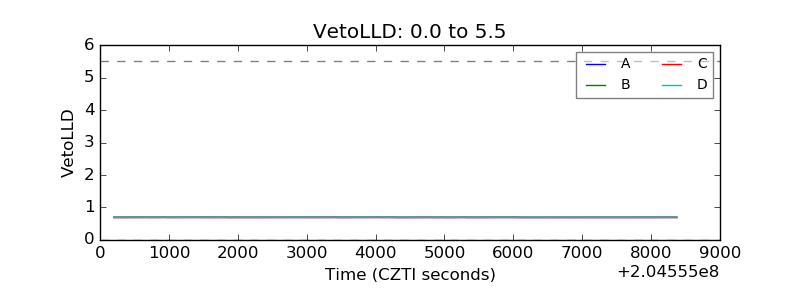 |
| Alpha Counter | 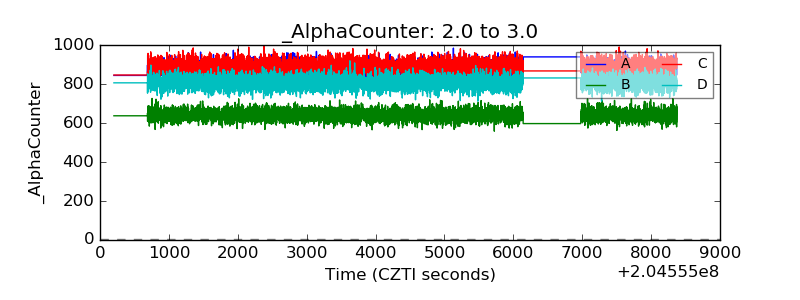 |
| _CPM_Rate | 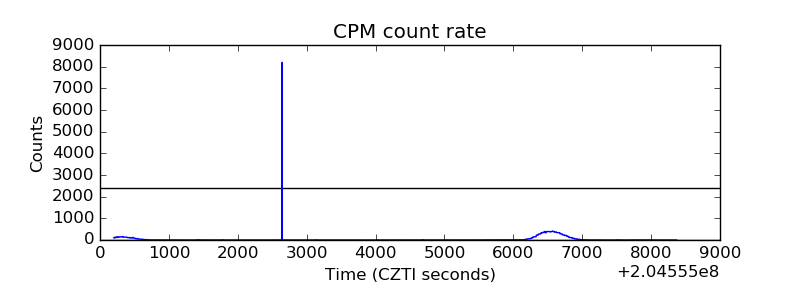 |
| CZT Counter | 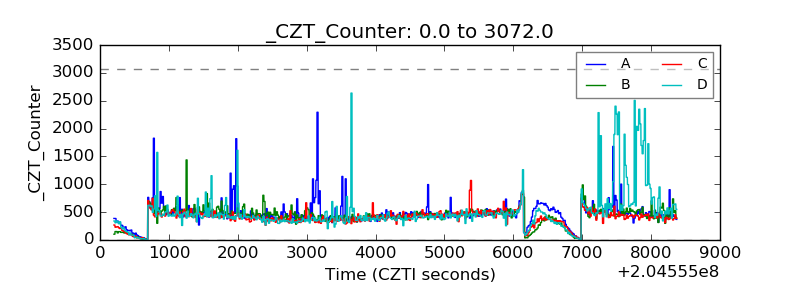 |
| +2.5 Volts monitor |  |
| +5 Volts monitor |  |
| _ROLL_ROT | 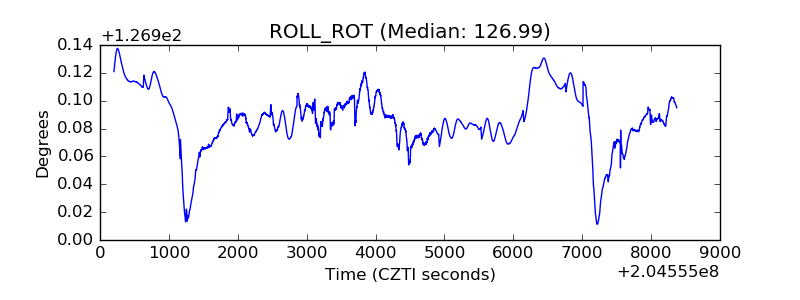 |
| _Roll_DEC | 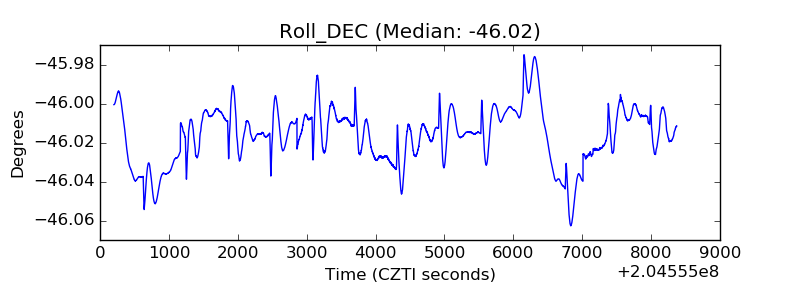 |
| _Roll_RA |  |
| Veto Counter | 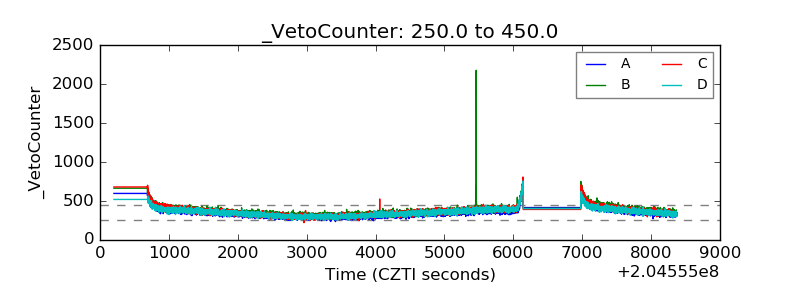 |