| Param | Original file | Final file |
|---|---|---|
| Filename | modeM0/AS1G05_173T01_9000000514_04021cztM0_level2.evt | modeM0/AS1G05_173T01_9000000514_04021cztM0_level2_quad_clean.evt |
| Size (bytes) | 406,339,200 | 74,128,320 |
| Size | 387.5 MB | 70.7 MB |
| Events in quadrant A | 3,078,763 | 455,885 |
| Events in quadrant B | 2,997,048 | 461,115 |
| Events in quadrant C | 2,760,939 | 451,696 |
| Events in quadrant D | 3,037,390 | 433,209 |
| Mode M9 | |||
|---|---|---|---|
| Quadrant | BADHDUFLAG | Total packets | Discarded packets |
| A | 0 | 11 | 0 |
| B | 0 | 11 | 0 |
| C | 0 | 11 | 0 |
| D | 0 | 11 | 0 |
| Mode M0 | |||
|---|---|---|---|
| Quadrant | BADHDUFLAG | Total packets | Discarded packets |
| A | 0 | 13604 | 2 |
| B | 0 | 13125 | 1 |
| C | 0 | 12835 | 1 |
| D | 0 | 13762 | 1 |
| Mode SS | |||
|---|---|---|---|
| Quadrant | BADHDUFLAG | Total packets | Discarded packets |
| A | 0 | 130 | 0 |
| B | 0 | 130 | 0 |
| C | 0 | 130 | 0 |
| D | 0 | 130 | 0 |
| Quadrant | Total seconds | Saturated seconds | Saturation percentage |
|---|---|---|---|
| A | 6340 | 41 | 0.646688% |
| B | 6340 | 9 | 0.141956% |
| C | 6340 | 5 | 0.078864% |
| D | 6340 | 77 | 1.214511% |
Noise dominated data is calculated using 1-second bins in cleaned event files. If a bin has >2000 counts, and if more than 50% of those come from <1% of pixels, then it is considered to be noise-dominated and hence unusable.
| Quadrant | # 1 sec bins | Bins with >0 counts | Bins with >2000 counts | High rate bins dominated by noise | Noise dominated (total time) | Noise dominated (detector-on time) | Marked lightcurve |
|---|---|---|---|---|---|---|---|
| A | 7495 | 6341 | 22 | 22 | 0.29% | 0.35% | 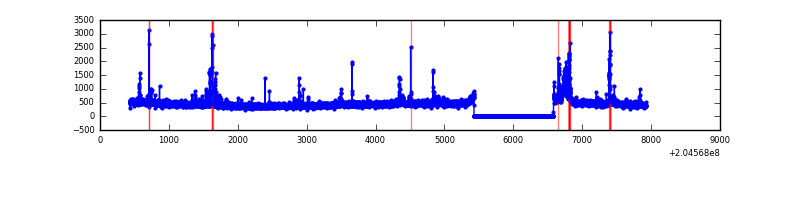 |
| B | 7495 | 6341 | 1 | 1 | 0.01% | 0.02% | 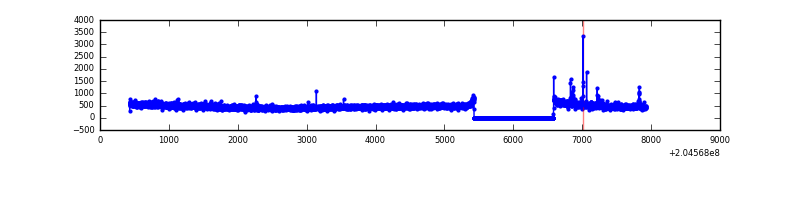 |
| C | 7495 | 6341 | 1 | 1 | 0.01% | 0.02% | 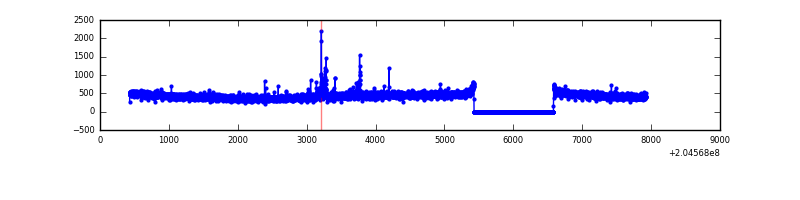 |
| D | 7495 | 6341 | 64 | 64 | 0.85% | 1.01% | 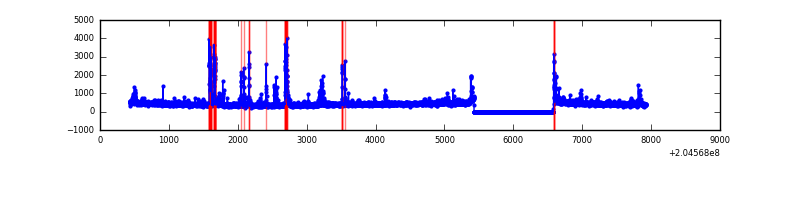 |
Top three noisy pixels from each quadrant. If the there are fewer than three noisy pixels in the level2.evt file, extra rows are filled as -1
| Pixel properties | Quadrant properties | ||||||
|---|---|---|---|---|---|---|---|
| Quadrant | DetID | PixID | Counts | Sigma | Mean | Median | Sigma |
| A | 0 | 50 | 229913 | 1542.47 | 726 | 712 | 148.6 |
| A | 0 | 5 | 26306 | 172.24 | 726 | 712 | 148.6 |
| A | 0 | 118 | 14913 | 95.57 | 726 | 712 | 148.6 |
| B | 15 | 204 | 89726 | 630.27 | 735 | 719 | 141.2 |
| B | 14 | 167 | 16688 | 113.08 | 735 | 719 | 141.2 |
| B | 0 | 183 | 14470 | 97.37 | 735 | 719 | 141.2 |
| C | 12 | 4 | 31532 | 189.3 | 695 | 698 | 162.9 |
| C | 10 | 65 | 11435 | 65.92 | 695 | 698 | 162.9 |
| C | 13 | 61 | 5980 | 32.43 | 695 | 698 | 162.9 |
| D | 2 | 232 | 217461 | 1284.49 | 690 | 669 | 168.8 |
| D | 13 | 223 | 62744 | 367.79 | 690 | 669 | 168.8 |
| D | 9 | 82 | 36183 | 210.42 | 690 | 669 | 168.8 |
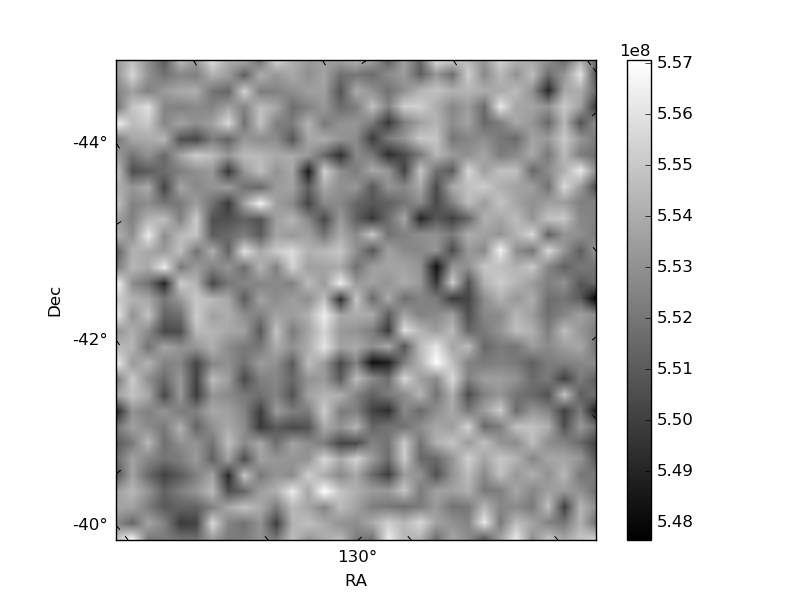
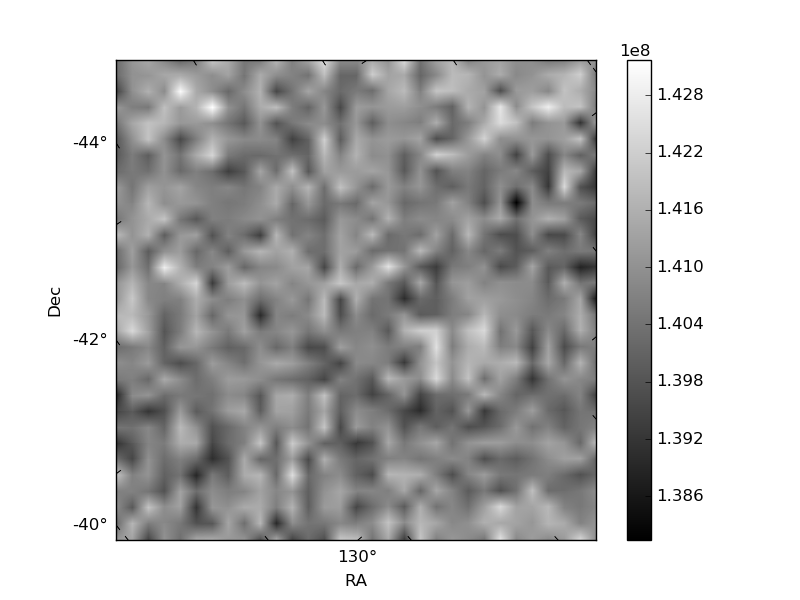
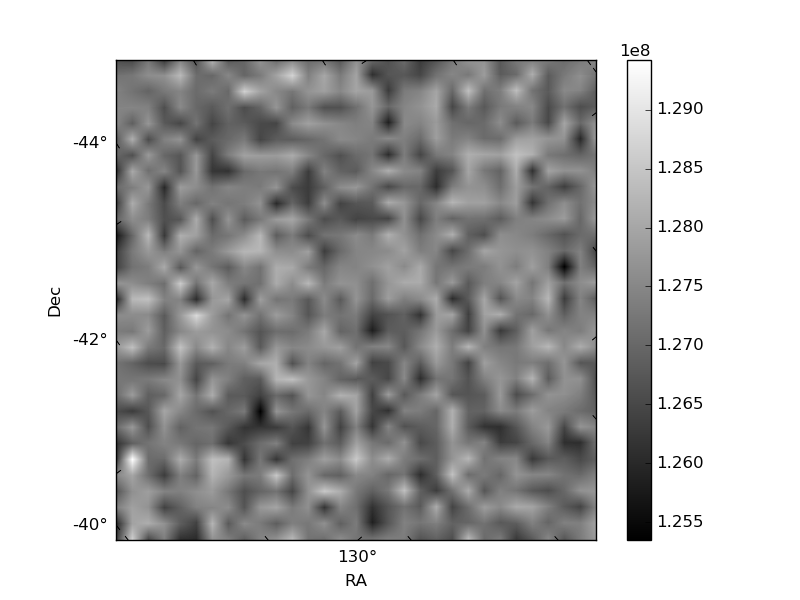
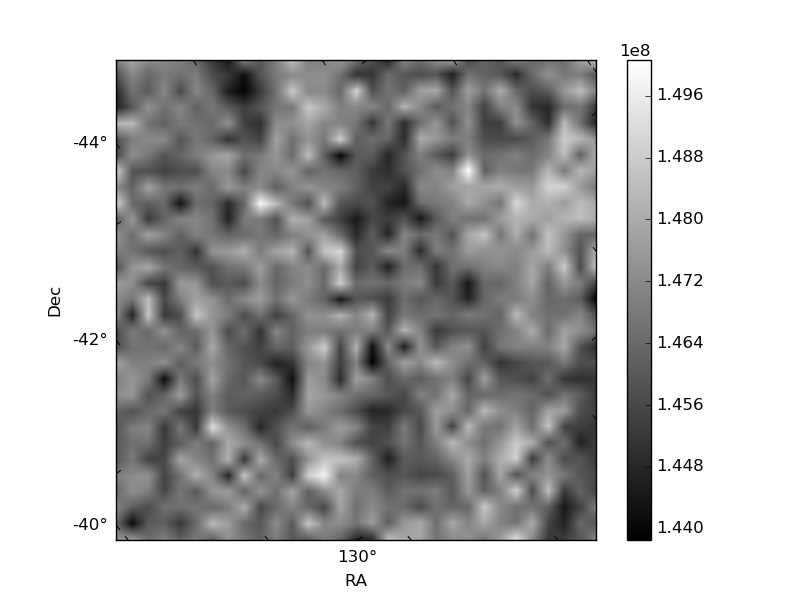
Histogram calculated using DETX and DETY for each event in the final _common_clean file
| Quadrant A | 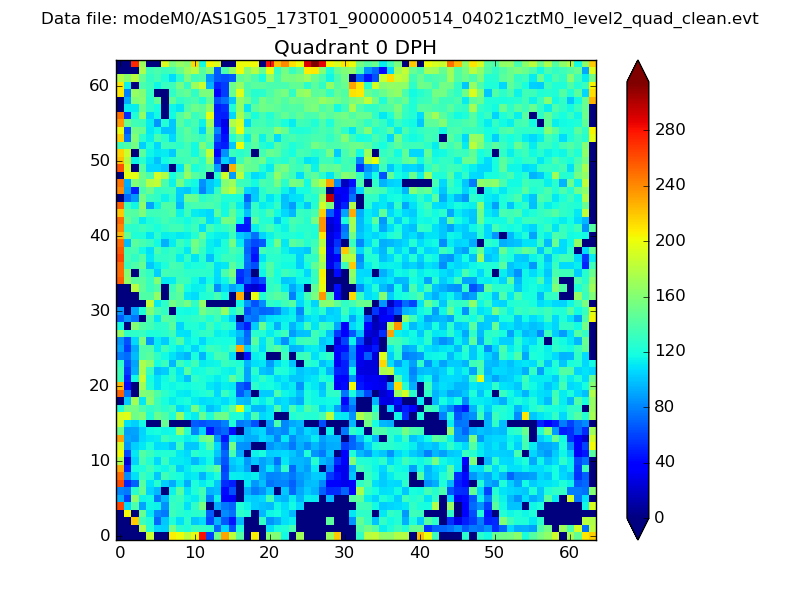 |
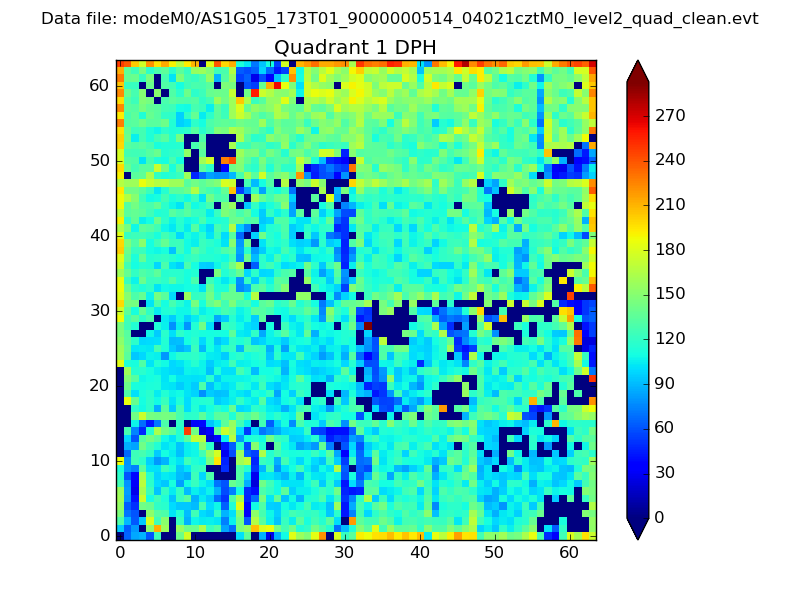 |
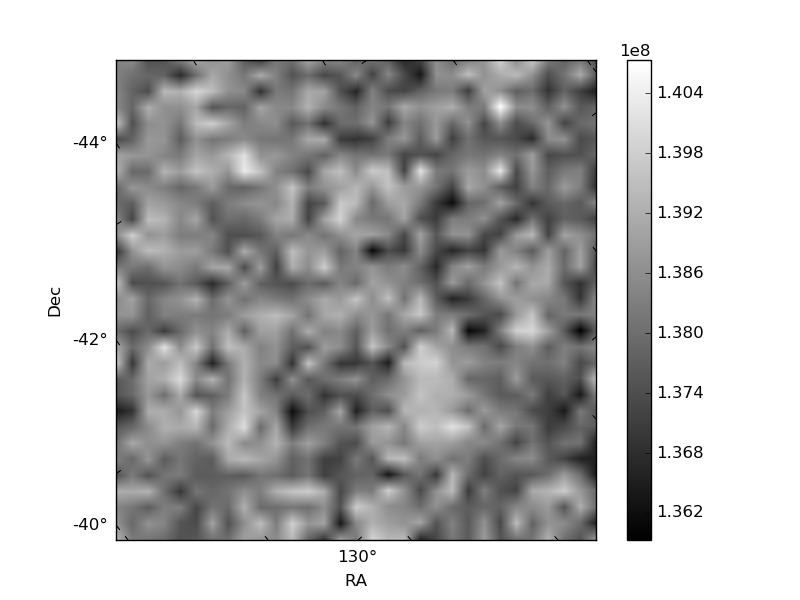
Quadrant B |
|---|---|---|---|
| Quadrant D | 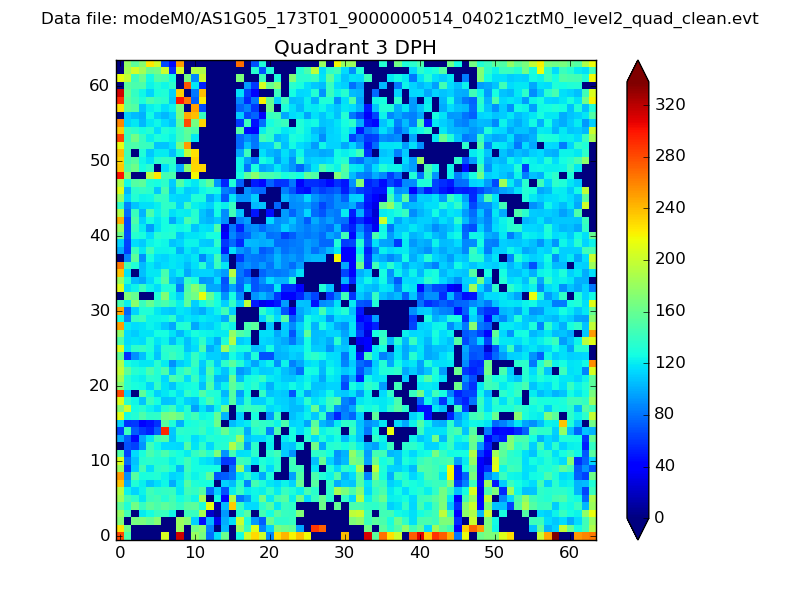 |
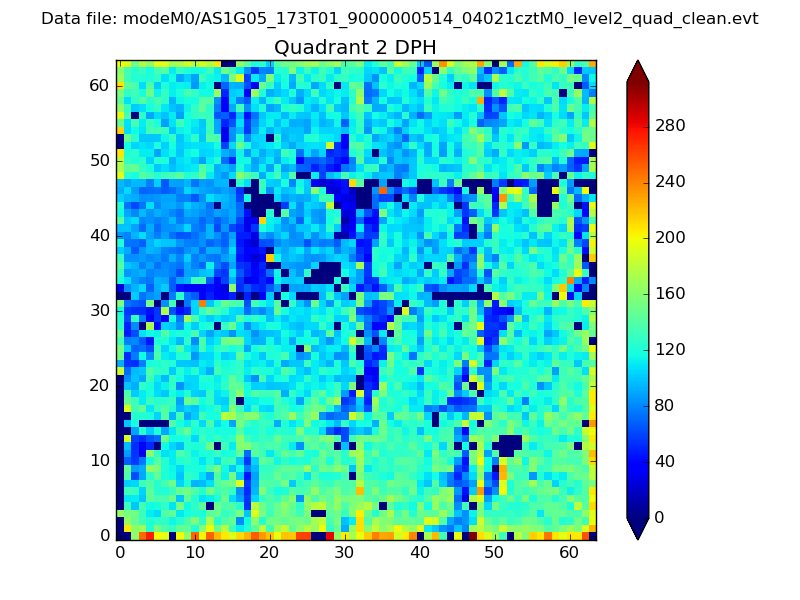 |
Quadrant C |
| Plot type | Count rate plots | Images |
|---|---|---|
| Comparison with Poisson distribution Blue bars denote a histogram of data divided into 1 sec bins. Red curve is a Poisson curve with rate = median count rate of data. |
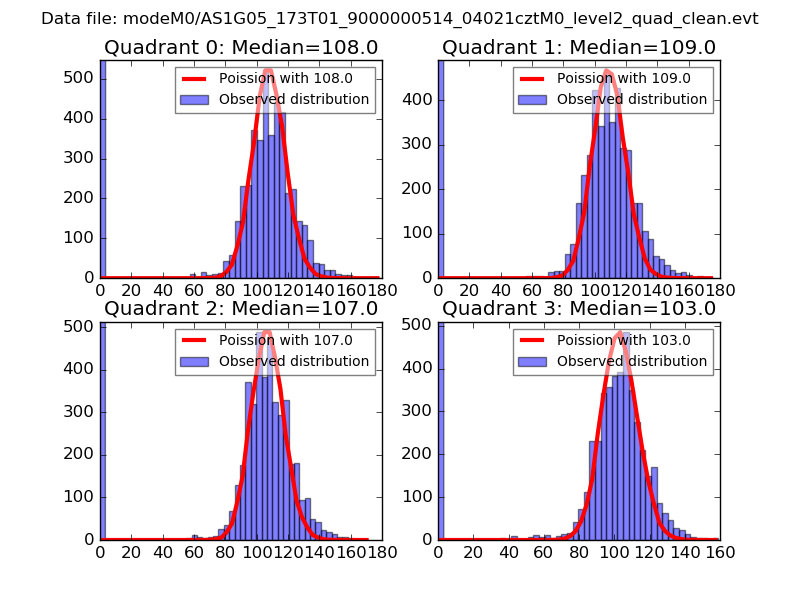 |
 |
| Quadrant-wise count rates Data is divided into 100 sec bins |
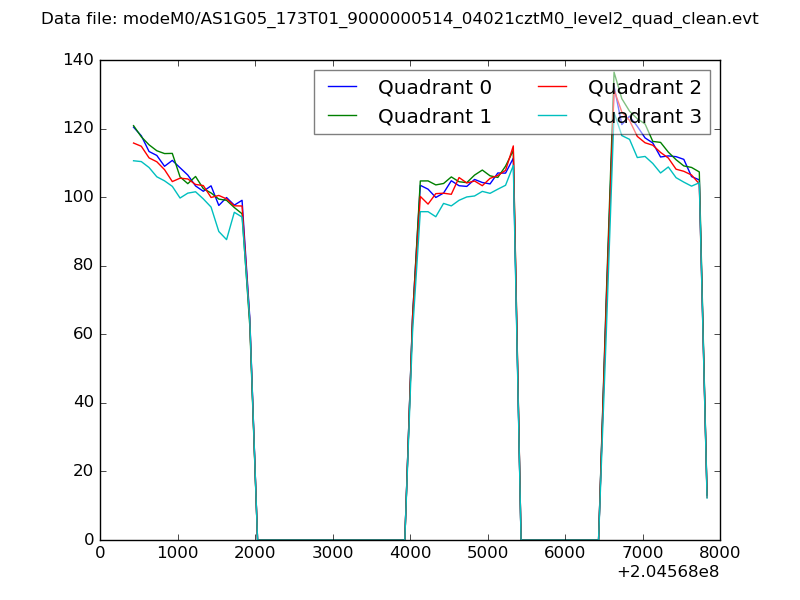 |
|
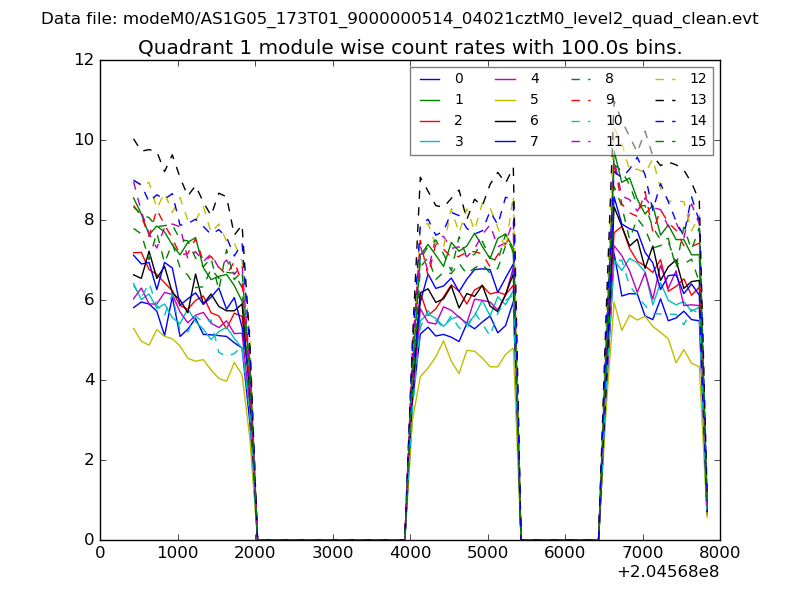
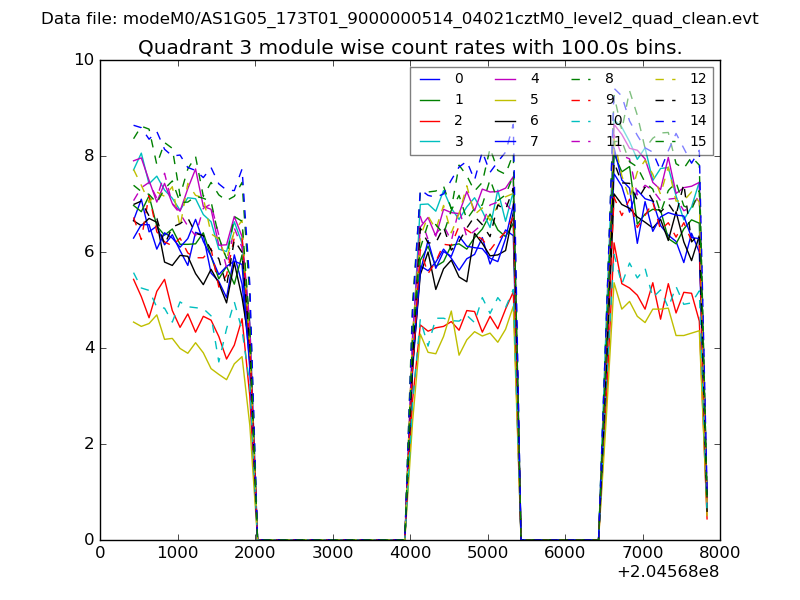
| Module-wise count rates for Quadrant A Data is divided into 100 sec bins |
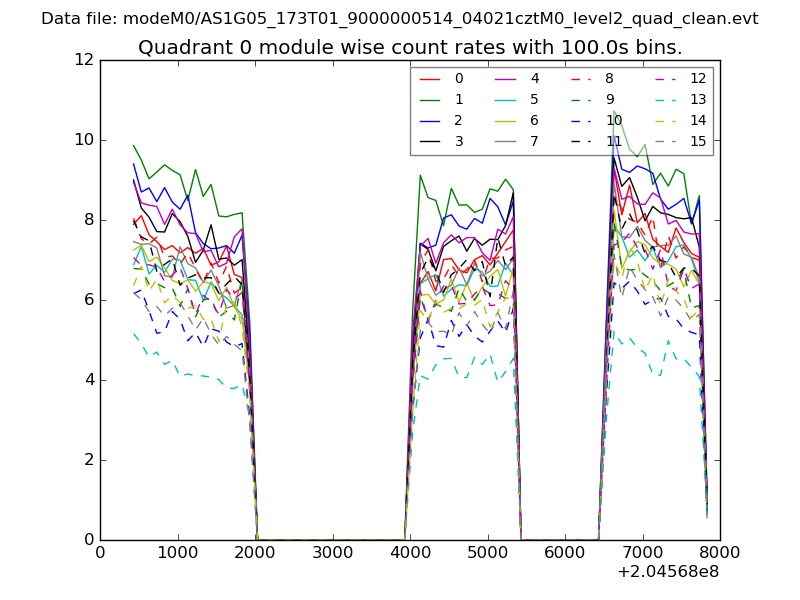 |
 |
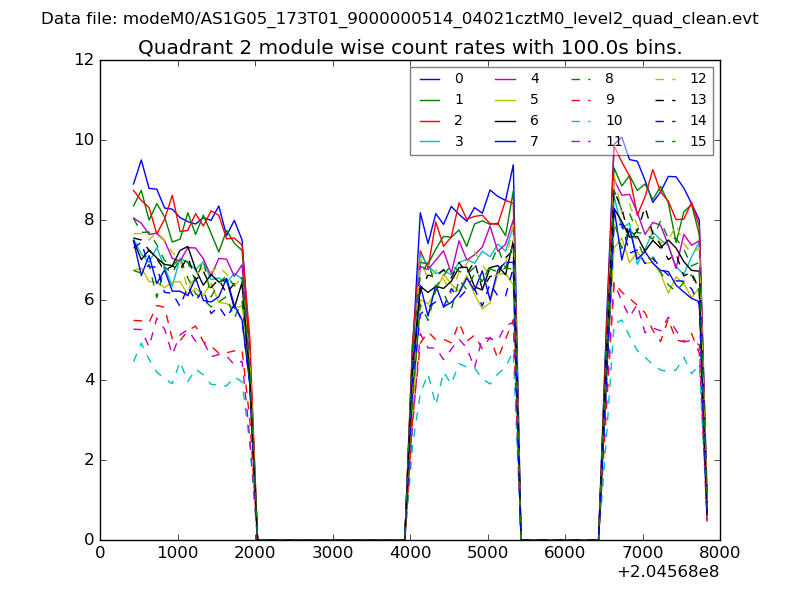
| Module-wise count rates for Quadrant B Data is divided into 100 sec bins |
 |
 |
| Module-wise count rates for Quadrant C Data is divided into 100 sec bins |
 |
 |
| Module-wise count rates for Quadrant D Data is divided into 100 sec bins |
 |
 |
| Parameter | Plot |
|---|---|
| CZT HV Monitor | 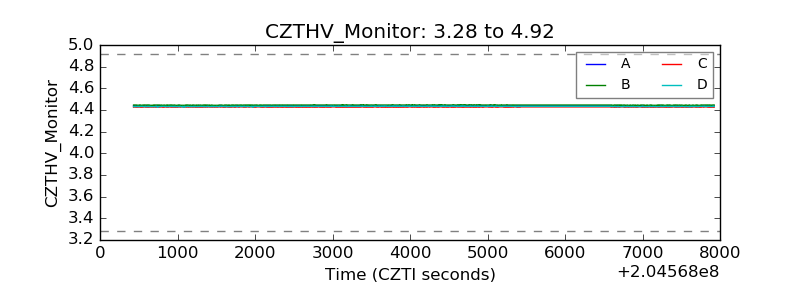 |
| D_VDD | 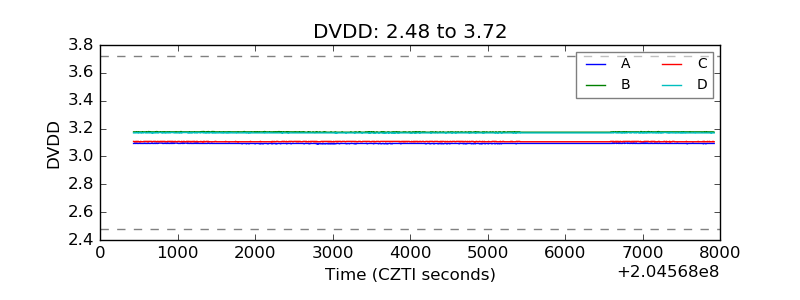 |
| Temperature 1 | 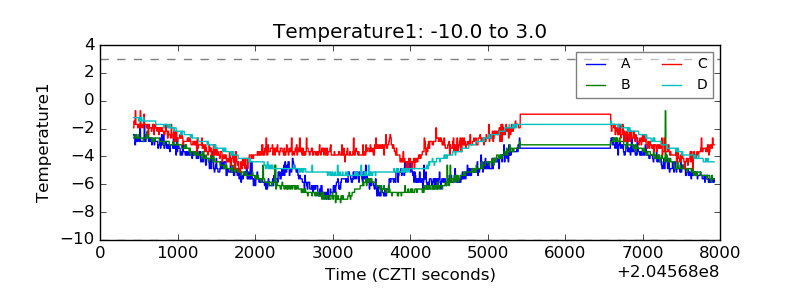 |
| Veto HV Monitor | 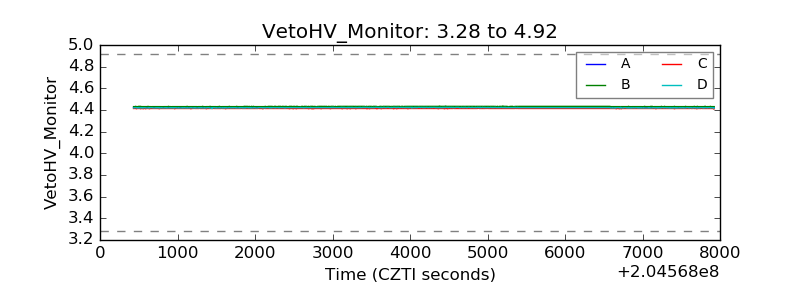 |
| Veto LLD | 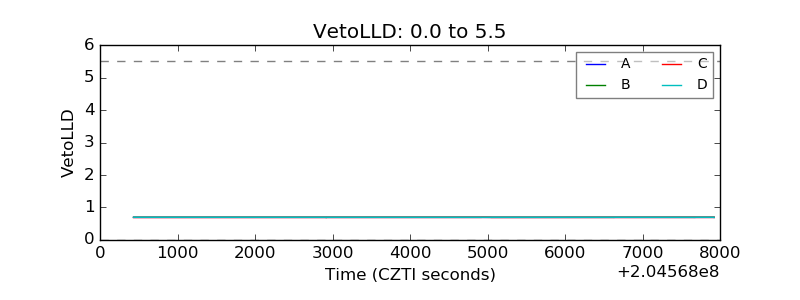 |
| Alpha Counter | 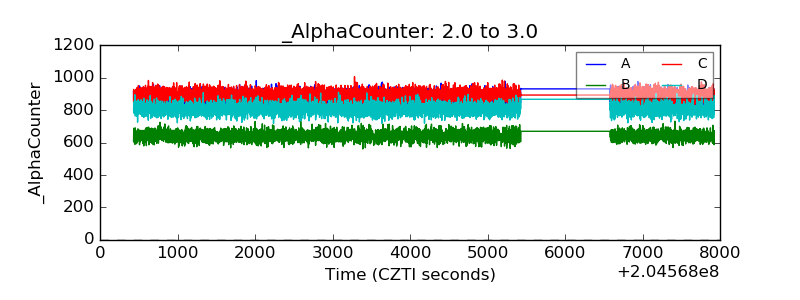 |
| _CPM_Rate | 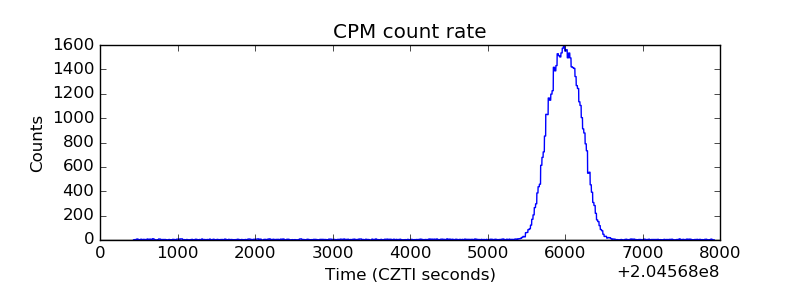 |
| CZT Counter | 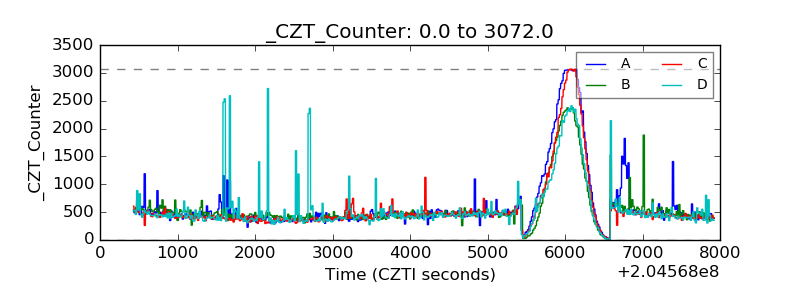 |
| +2.5 Volts monitor |  |
| +5 Volts monitor |  |
| _ROLL_ROT | 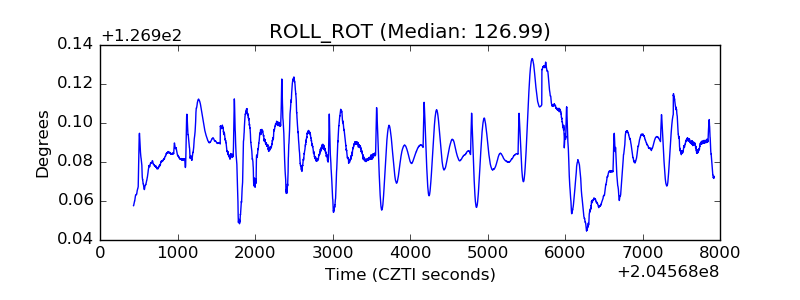 |
| _Roll_DEC | 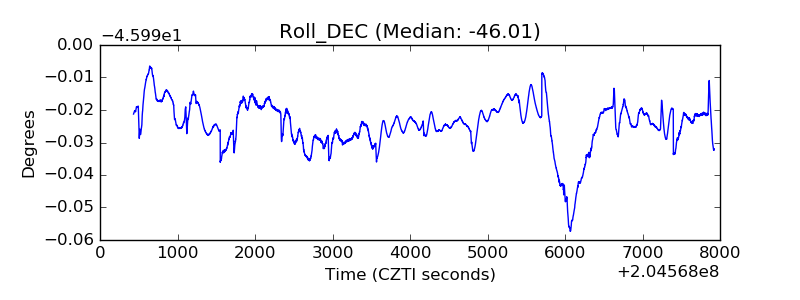 |
| _Roll_RA | 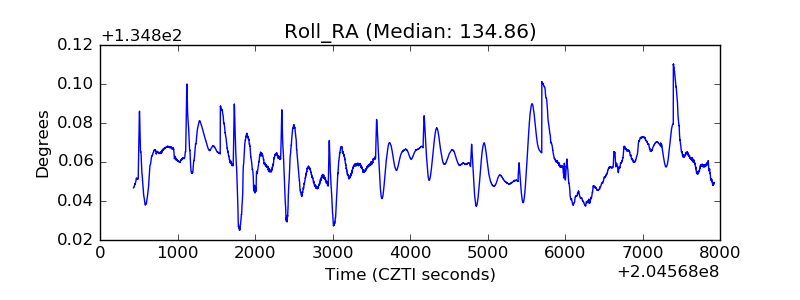 |
| Veto Counter | 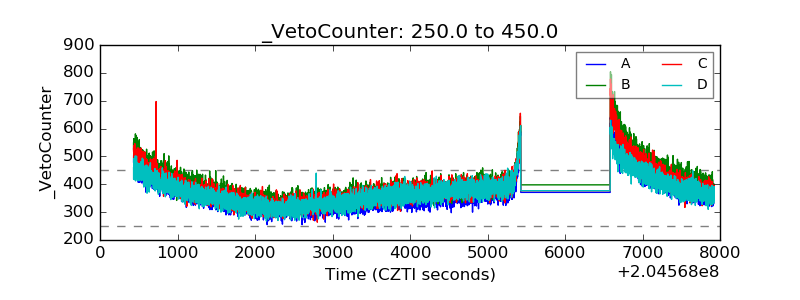 |