| Param | Original file | Final file |
|---|---|---|
| Filename | modeM0/AS1G05_173T01_9000000514_04022cztM0_level2.evt | modeM0/AS1G05_173T01_9000000514_04022cztM0_level2_quad_clean.evt |
| Size (bytes) | 401,281,920 | 69,851,520 |
| Size | 382.7 MB | 66.6 MB |
| Events in quadrant A | 3,043,330 | 424,187 |
| Events in quadrant B | 3,051,757 | 431,231 |
| Events in quadrant C | 2,768,545 | 420,103 |
| Events in quadrant D | 2,864,250 | 403,600 |
| Mode M9 | |||
|---|---|---|---|
| Quadrant | BADHDUFLAG | Total packets | Discarded packets |
| A | 0 | 13 | 0 |
| B | 0 | 13 | 0 |
| C | 0 | 13 | 0 |
| D | 0 | 13 | 0 |
| Mode M0 | |||
|---|---|---|---|
| Quadrant | BADHDUFLAG | Total packets | Discarded packets |
| A | 0 | 13307 | 2 |
| B | 0 | 13185 | 1 |
| C | 0 | 12641 | 1 |
| D | 0 | 13096 | 1 |
| Mode SS | |||
|---|---|---|---|
| Quadrant | BADHDUFLAG | Total packets | Discarded packets |
| A | 0 | 126 | 0 |
| B | 0 | 126 | 0 |
| C | 0 | 126 | 0 |
| D | 0 | 126 | 0 |
| Quadrant | Total seconds | Saturated seconds | Saturation percentage |
|---|---|---|---|
| A | 6248 | 33 | 0.528169% |
| B | 6248 | 23 | 0.368118% |
| C | 6248 | 4 | 0.064020% |
| D | 6248 | 11 | 0.176056% |
Noise dominated data is calculated using 1-second bins in cleaned event files. If a bin has >2000 counts, and if more than 50% of those come from <1% of pixels, then it is considered to be noise-dominated and hence unusable.
| Quadrant | # 1 sec bins | Bins with >0 counts | Bins with >2000 counts | High rate bins dominated by noise | Noise dominated (total time) | Noise dominated (detector-on time) | Marked lightcurve |
|---|---|---|---|---|---|---|---|
| A | 7488 | 6249 | 16 | 16 | 0.21% | 0.26% | 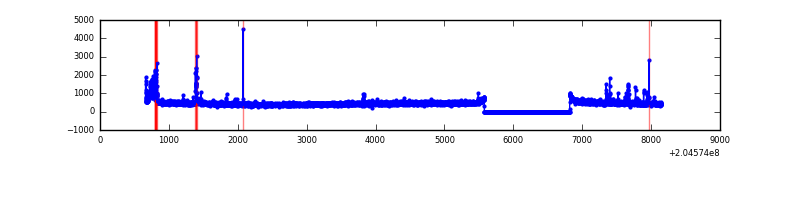 |
| B | 7488 | 6248 | 3 | 3 | 0.04% | 0.05% | 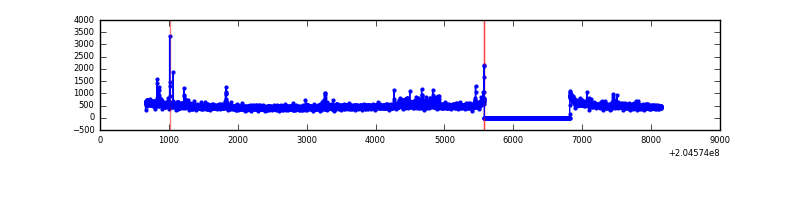 |
| C | 7488 | 6249 | 0 | 0 | 0.00% | 0.00% | 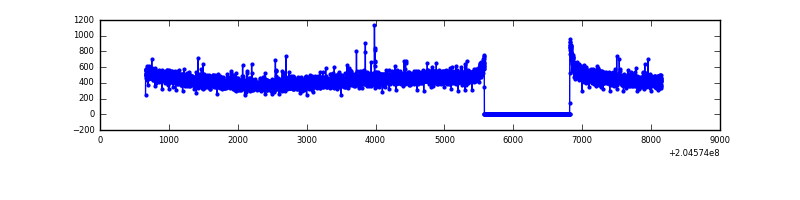 |
| D | 7488 | 6249 | 3 | 3 | 0.04% | 0.05% |  |
Top three noisy pixels from each quadrant. If the there are fewer than three noisy pixels in the level2.evt file, extra rows are filled as -1
| Pixel properties | Quadrant properties | ||||||
|---|---|---|---|---|---|---|---|
| Quadrant | DetID | PixID | Counts | Sigma | Mean | Median | Sigma |
| A | 0 | 50 | 172533 | 1150.07 | 734 | 719 | 149.4 |
| A | 0 | 118 | 25896 | 168.53 | 734 | 719 | 149.4 |
| A | 8 | 15 | 12060 | 75.91 | 734 | 719 | 149.4 |
| B | 4 | 81 | 89309 | 623.67 | 744 | 728 | 142.0 |
| B | 15 | 204 | 28008 | 192.07 | 744 | 728 | 142.0 |
| B | 0 | 183 | 18077 | 122.14 | 744 | 728 | 142.0 |
| C | 12 | 4 | 7996 | 44.58 | 704 | 706 | 163.5 |
| C | 9 | 144 | 7509 | 41.6 | 704 | 706 | 163.5 |
| C | 13 | 61 | 6071 | 32.81 | 704 | 706 | 163.5 |
| D | 2 | 232 | 62516 | 368.8 | 697 | 677 | 167.7 |
| D | 10 | 246 | 56207 | 331.17 | 697 | 677 | 167.7 |
| D | 2 | 14 | 25498 | 148.03 | 697 | 677 | 167.7 |
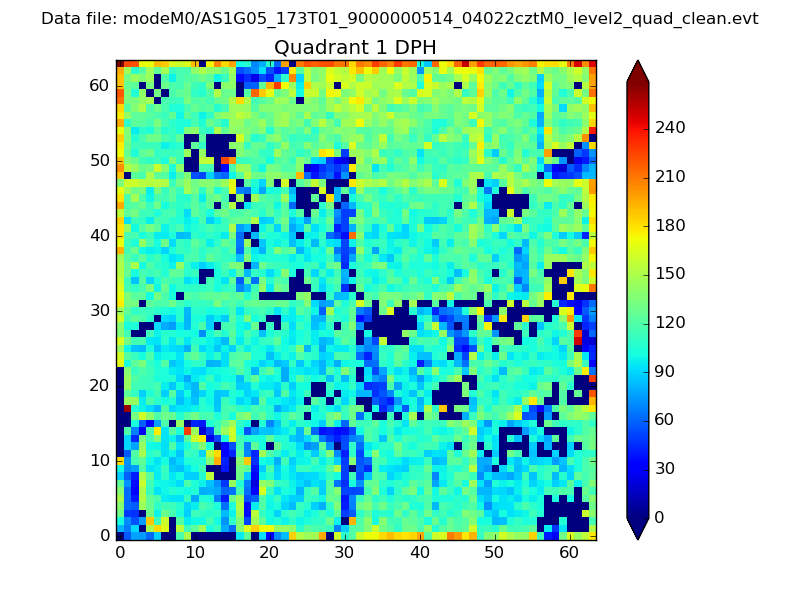
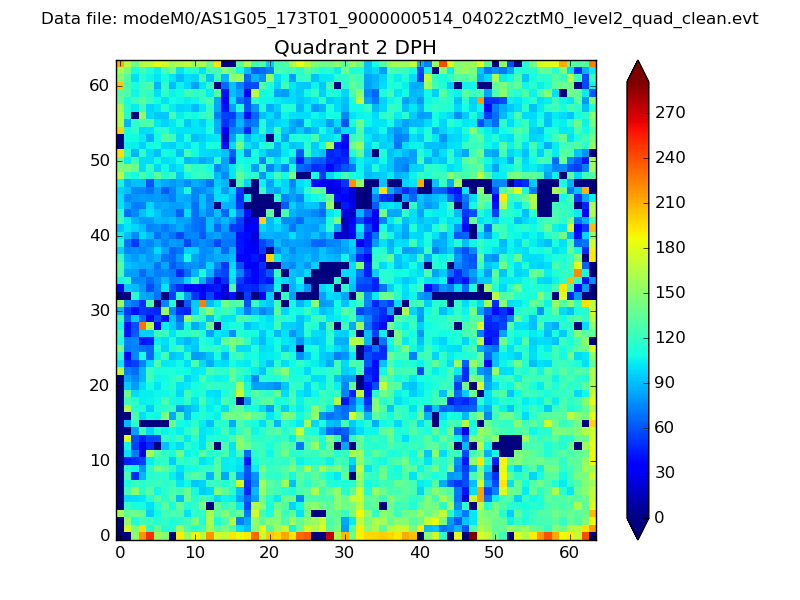
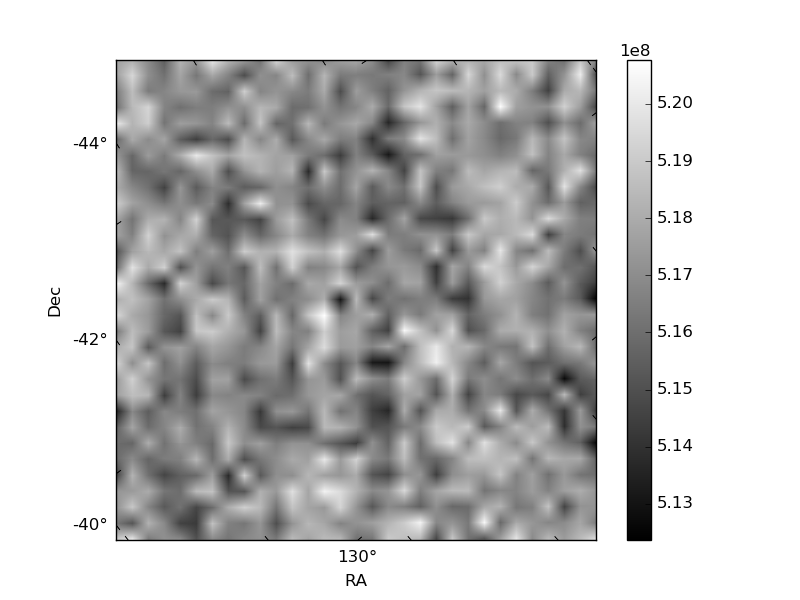
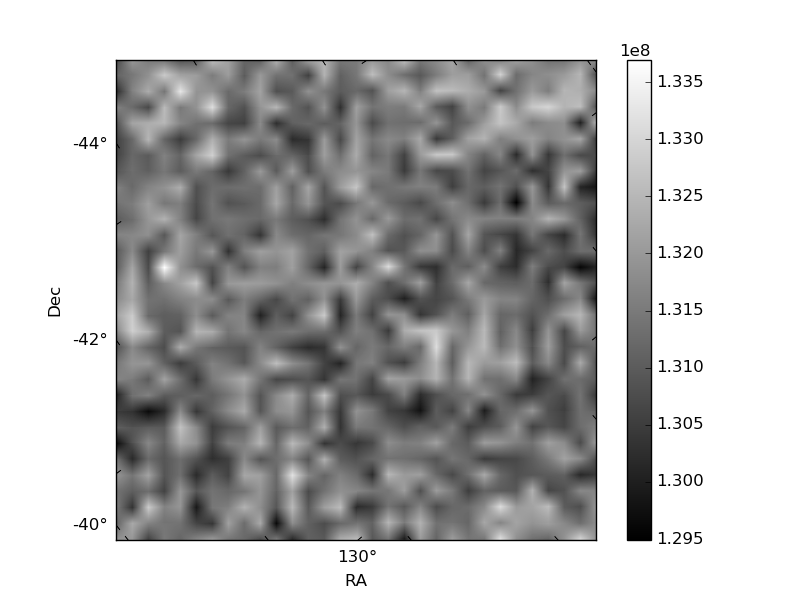
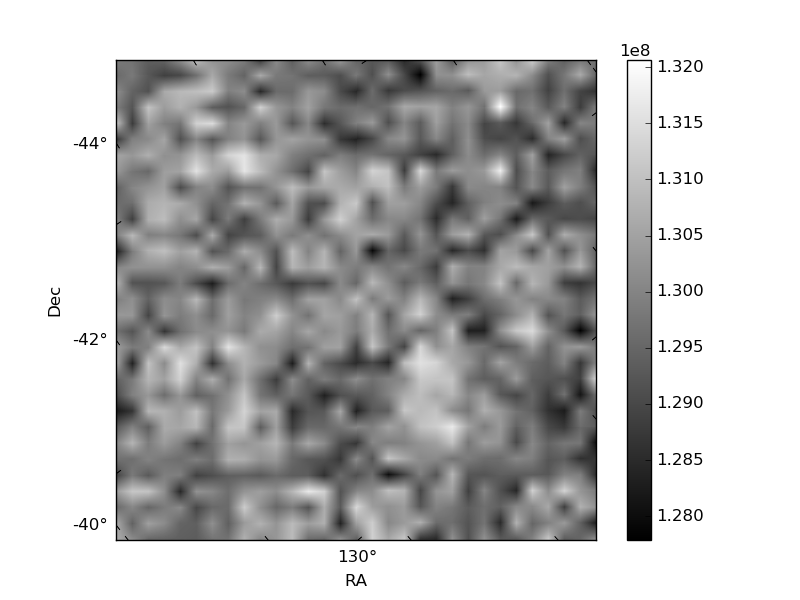
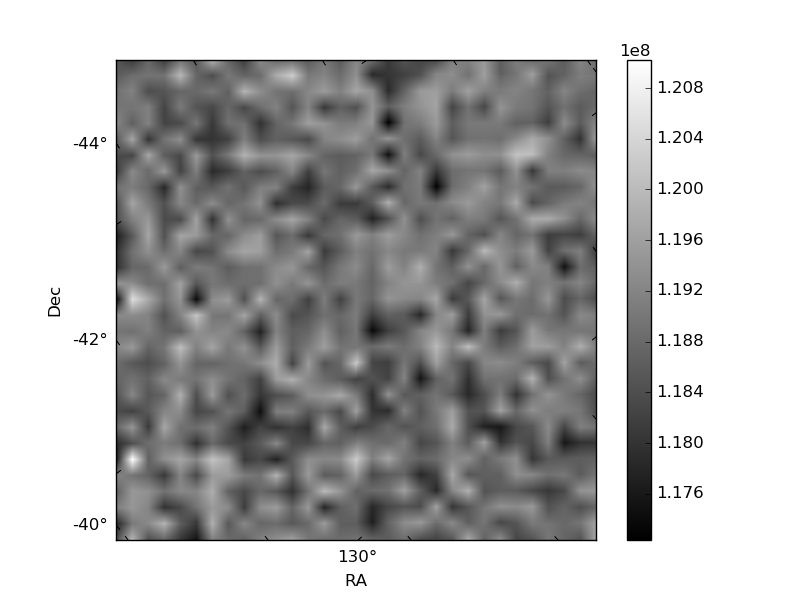
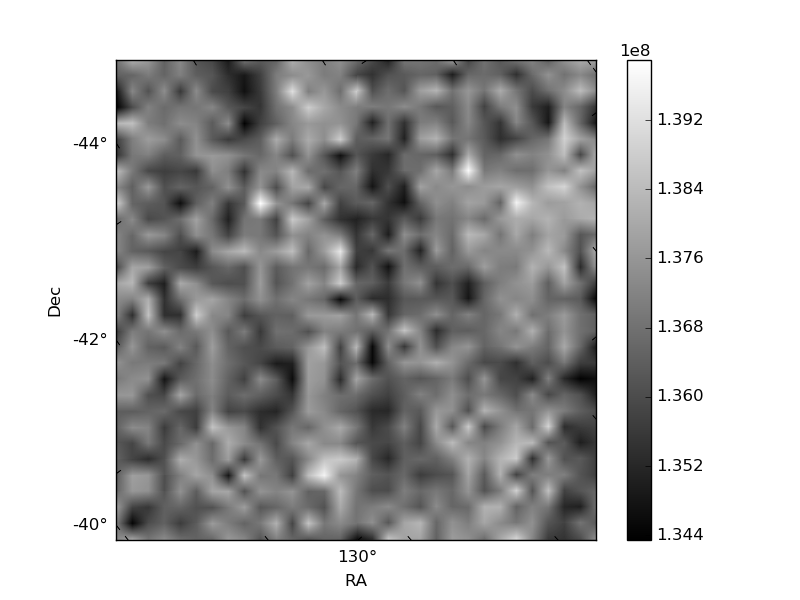
Histogram calculated using DETX and DETY for each event in the final _common_clean file
| Quadrant A | 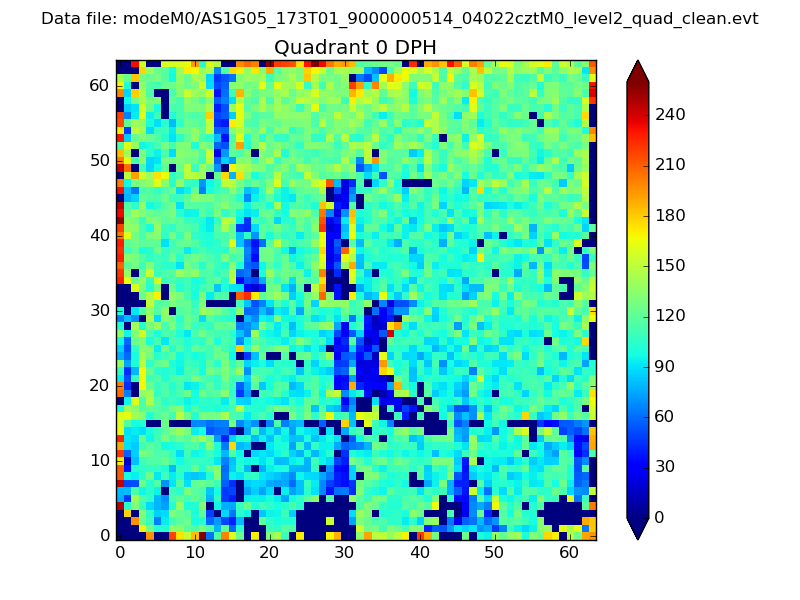 |
 |
Quadrant B |
|---|---|---|---|
| Quadrant D | 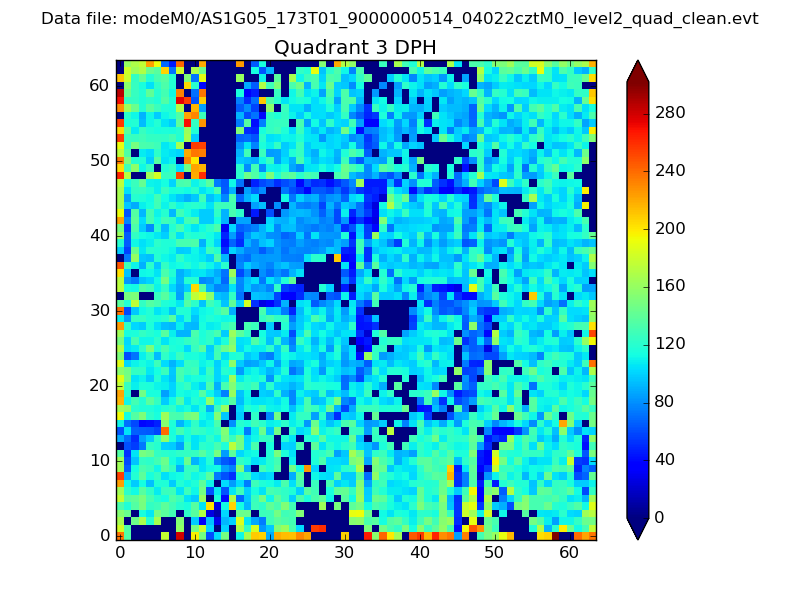 |
 |
Quadrant C |
| Plot type | Count rate plots | Images |
|---|---|---|
| Comparison with Poisson distribution Blue bars denote a histogram of data divided into 1 sec bins. Red curve is a Poisson curve with rate = median count rate of data. |
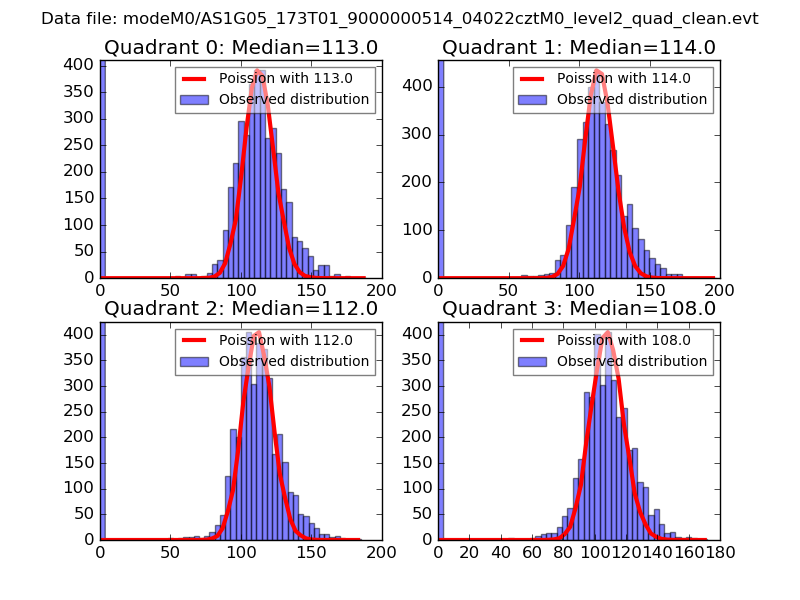 |
 |
| Quadrant-wise count rates Data is divided into 100 sec bins |
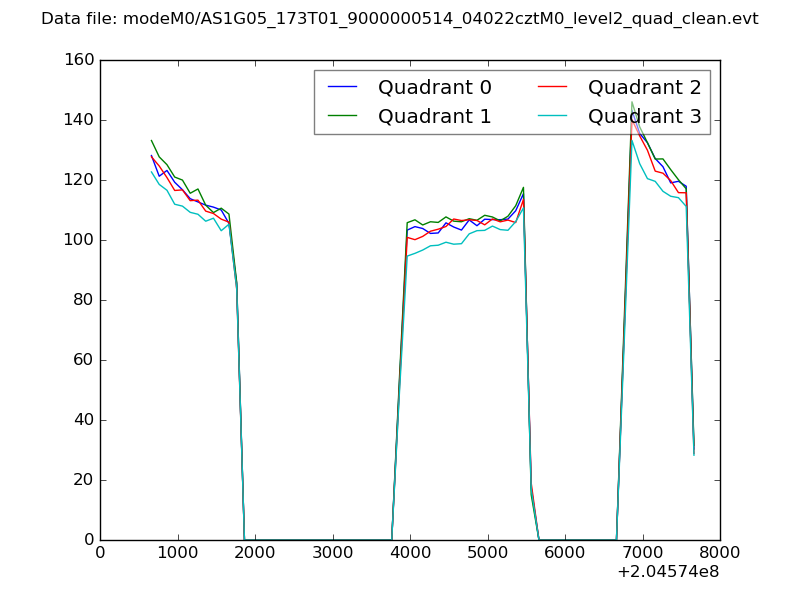 |
|
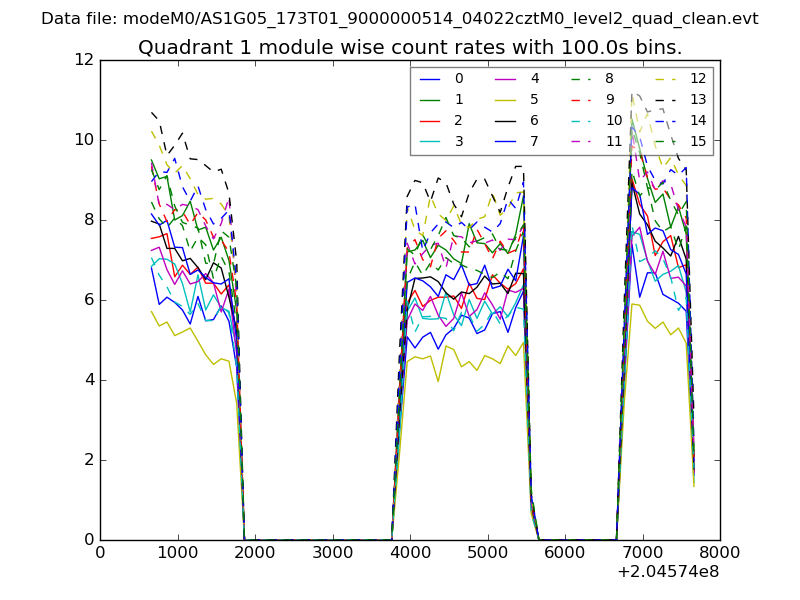
| Module-wise count rates for Quadrant A Data is divided into 100 sec bins |
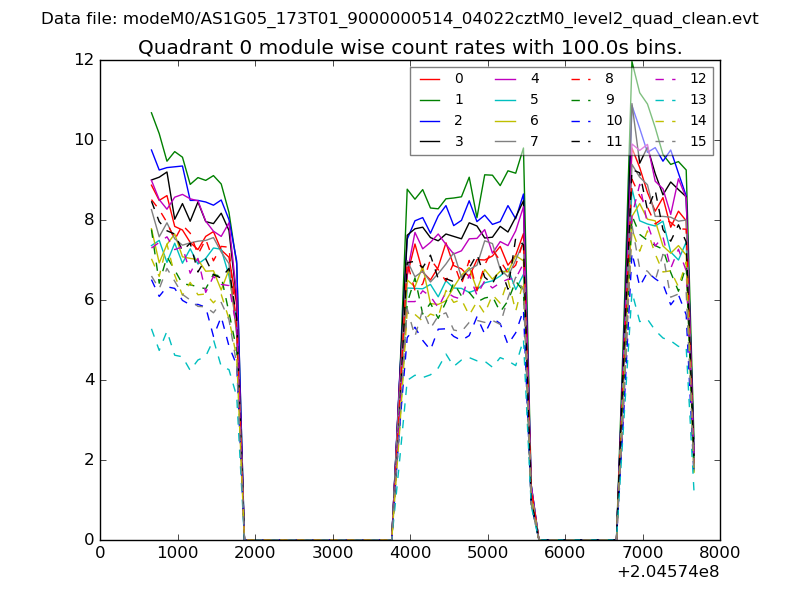 |
 |
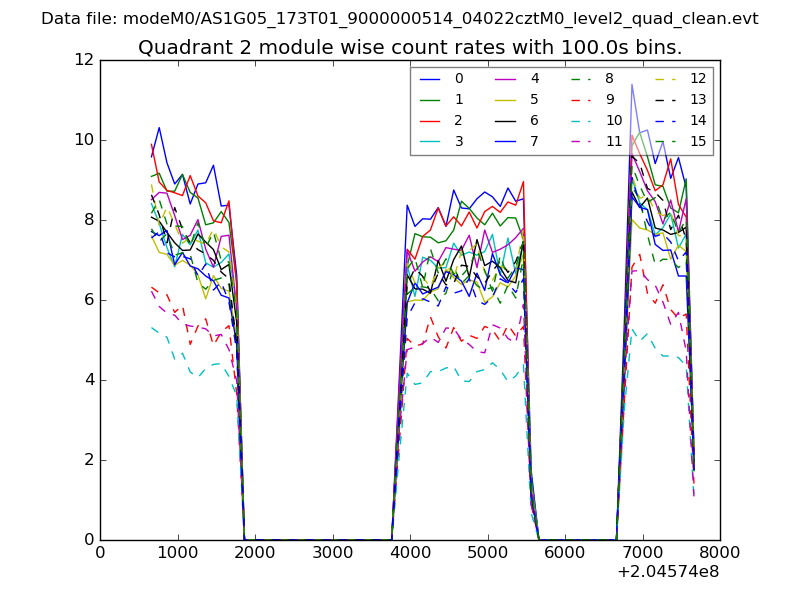
| Module-wise count rates for Quadrant B Data is divided into 100 sec bins |
 |
 |
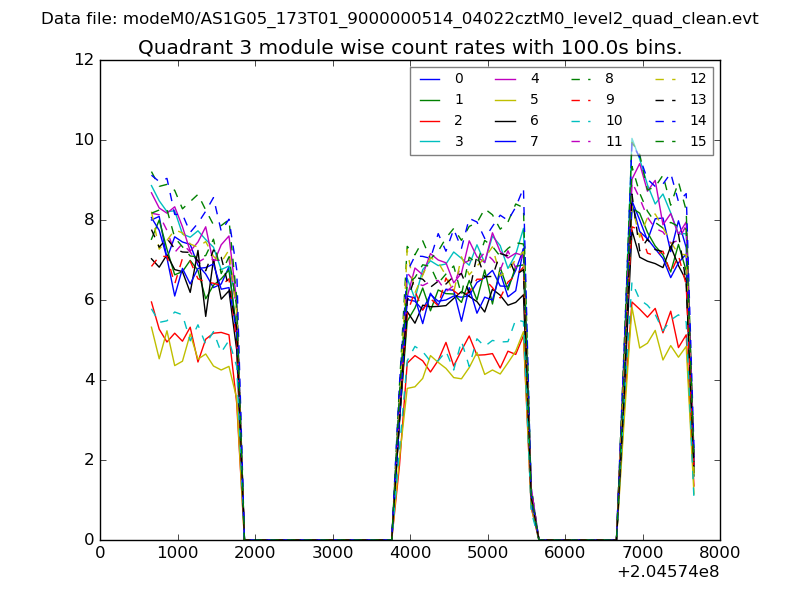
| Module-wise count rates for Quadrant C Data is divided into 100 sec bins |
 |
 |
| Module-wise count rates for Quadrant D Data is divided into 100 sec bins |
 |
 |
| Parameter | Plot |
|---|---|
| CZT HV Monitor | 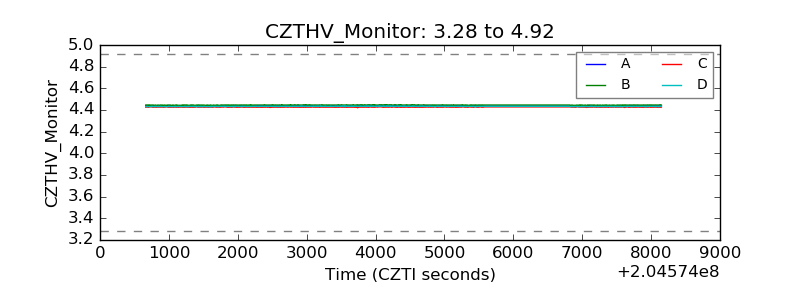 |
| D_VDD | 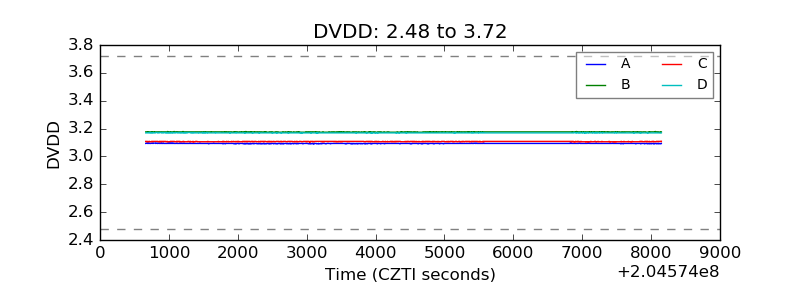 |
| Temperature 1 | 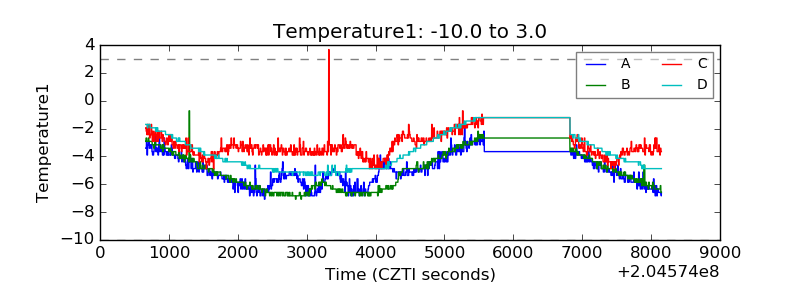 |
| Veto HV Monitor | 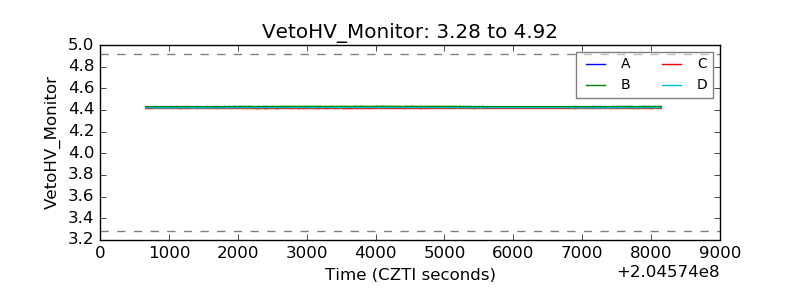 |
| Veto LLD | 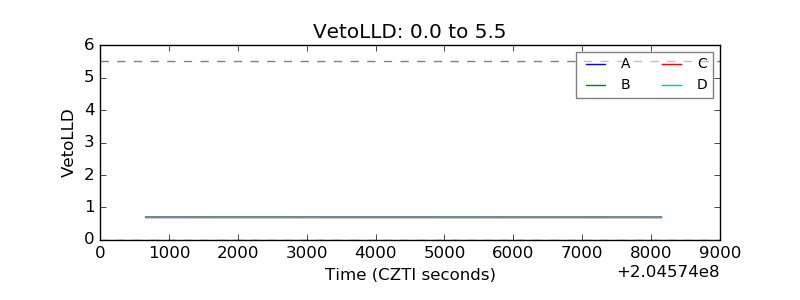 |
| Alpha Counter | 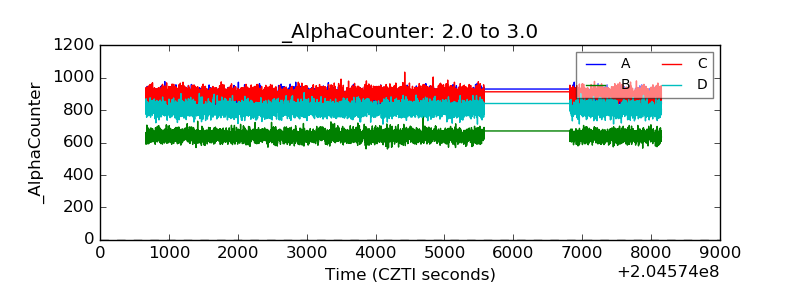 |
| _CPM_Rate | 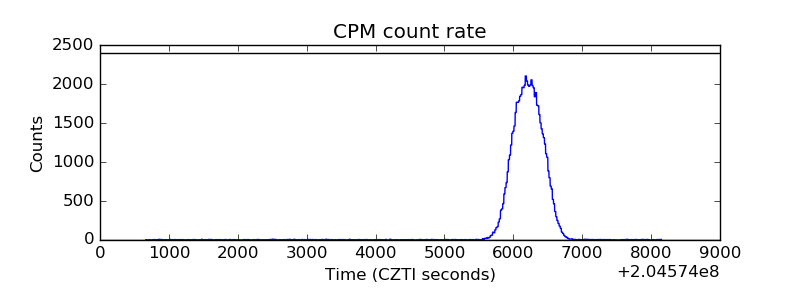 |
| CZT Counter | 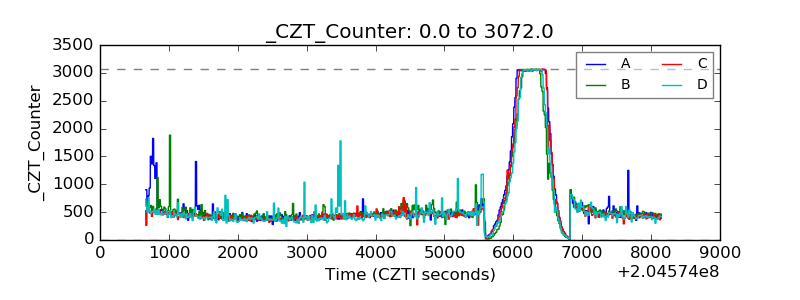 |
| +2.5 Volts monitor |  |
| +5 Volts monitor |  |
| _ROLL_ROT | 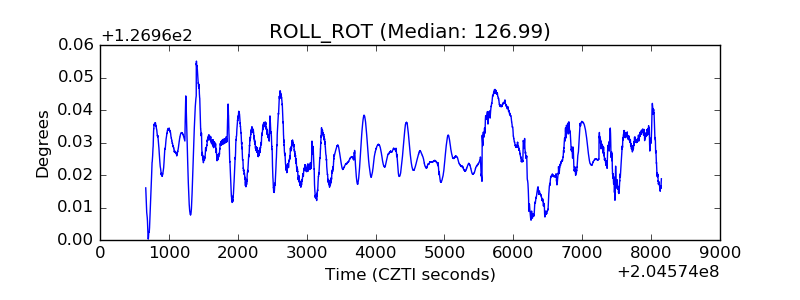 |
| _Roll_DEC | 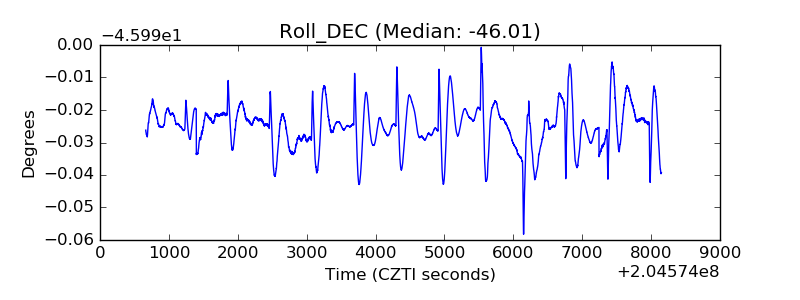 |
| _Roll_RA | 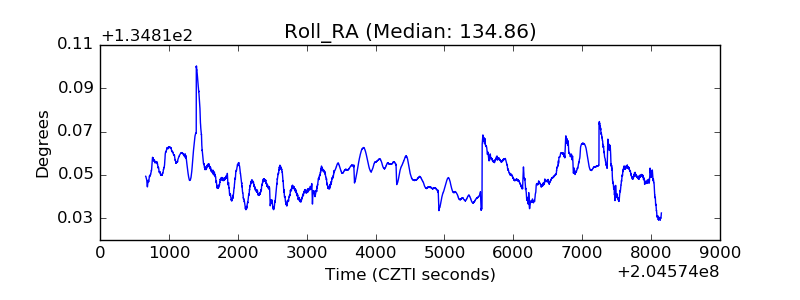 |
| Veto Counter | 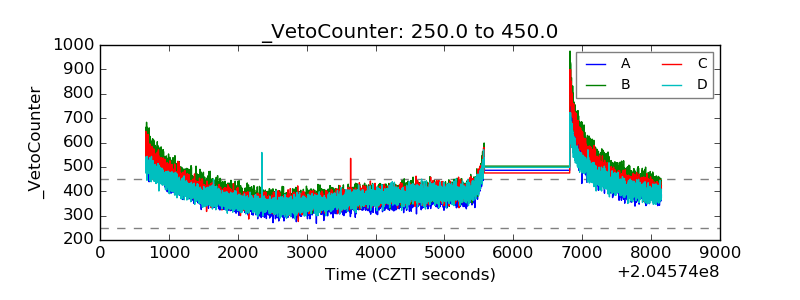 |