| Param | Original file | Final file |
|---|---|---|
| Filename | modeM0/AS1G05_173T01_9000000514_04023cztM0_level2.evt | modeM0/AS1G05_173T01_9000000514_04023cztM0_level2_quad_clean.evt |
| Size (bytes) | 398,142,720 | 64,978,560 |
| Size | 379.7 MB | 62.0 MB |
| Events in quadrant A | 3,016,271 | 388,524 |
| Events in quadrant B | 2,968,663 | 397,430 |
| Events in quadrant C | 2,795,256 | 387,371 |
| Events in quadrant D | 2,862,156 | 367,692 |
| Mode M9 | |||
|---|---|---|---|
| Quadrant | BADHDUFLAG | Total packets | Discarded packets |
| A | 0 | 22 | 0 |
| B | 0 | 22 | 0 |
| C | 0 | 22 | 0 |
| D | 0 | 23 | 0 |
| Mode M0 | |||
|---|---|---|---|
| Quadrant | BADHDUFLAG | Total packets | Discarded packets |
| A | 0 | 13010 | 3 |
| B | 0 | 12745 | 2 |
| C | 0 | 12481 | 2 |
| D | 0 | 12931 | 2 |
| Mode SS | |||
|---|---|---|---|
| Quadrant | BADHDUFLAG | Total packets | Discarded packets |
| A | 0 | 124 | 0 |
| B | 0 | 124 | 0 |
| C | 0 | 124 | 0 |
| D | 0 | 124 | 0 |
| Quadrant | Total seconds | Saturated seconds | Saturation percentage |
|---|---|---|---|
| A | 6106 | 31 | 0.507697% |
| B | 6106 | 23 | 0.376679% |
| C | 6106 | 4 | 0.065509% |
| D | 6106 | 34 | 0.556829% |
Noise dominated data is calculated using 1-second bins in cleaned event files. If a bin has >2000 counts, and if more than 50% of those come from <1% of pixels, then it is considered to be noise-dominated and hence unusable.
| Quadrant | # 1 sec bins | Bins with >0 counts | Bins with >2000 counts | High rate bins dominated by noise | Noise dominated (total time) | Noise dominated (detector-on time) | Marked lightcurve |
|---|---|---|---|---|---|---|---|
| A | 7416 | 6107 | 18 | 18 | 0.24% | 0.29% | 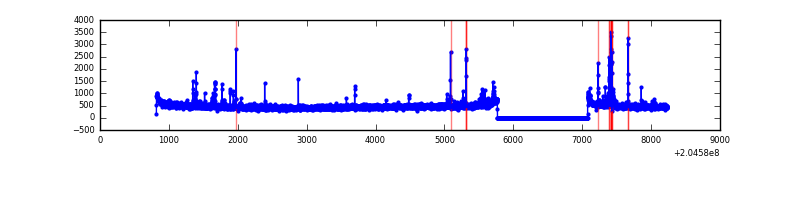 |
| B | 7416 | 6107 | 3 | 3 | 0.04% | 0.05% | 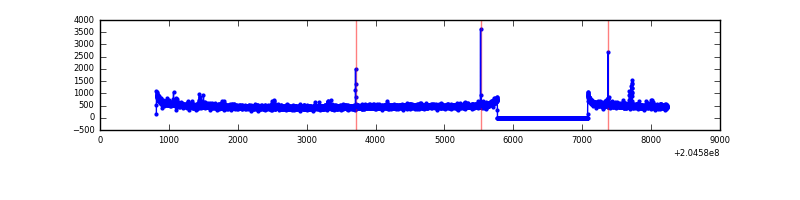 |
| C | 7416 | 6107 | 1 | 1 | 0.01% | 0.02% | 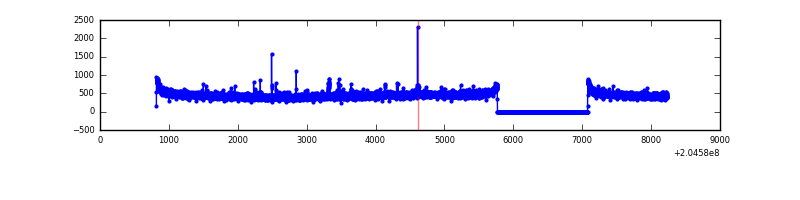 |
| D | 7416 | 6107 | 11 | 11 | 0.15% | 0.18% | 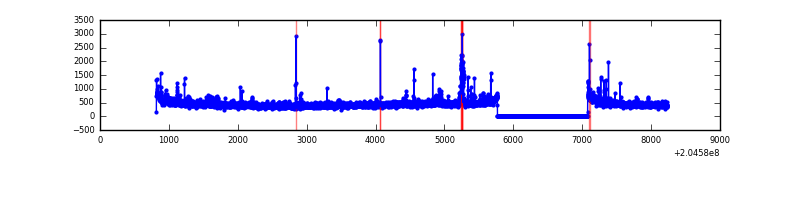 |
Top three noisy pixels from each quadrant. If the there are fewer than three noisy pixels in the level2.evt file, extra rows are filled as -1
| Pixel properties | Quadrant properties | ||||||
|---|---|---|---|---|---|---|---|
| Quadrant | DetID | PixID | Counts | Sigma | Mean | Median | Sigma |
| A | 0 | 50 | 92492 | 612.65 | 735 | 723 | 149.8 |
| A | 0 | 118 | 60805 | 401.11 | 735 | 723 | 149.8 |
| A | 0 | 226 | 13161 | 83.04 | 735 | 723 | 149.8 |
| B | 4 | 81 | 36296 | 252.81 | 746 | 730 | 140.7 |
| B | 15 | 204 | 24827 | 171.28 | 746 | 730 | 140.7 |
| B | 12 | 111 | 11343 | 75.44 | 746 | 730 | 140.7 |
| C | 9 | 144 | 21562 | 128.27 | 706 | 711 | 162.6 |
| C | 10 | 65 | 13428 | 78.23 | 706 | 711 | 162.6 |
| C | 13 | 61 | 5982 | 32.43 | 706 | 711 | 162.6 |
| D | 2 | 14 | 83730 | 498.41 | 697 | 677 | 166.6 |
| D | 10 | 246 | 44411 | 262.45 | 697 | 677 | 166.6 |
| D | 2 | 232 | 34807 | 204.82 | 697 | 677 | 166.6 |
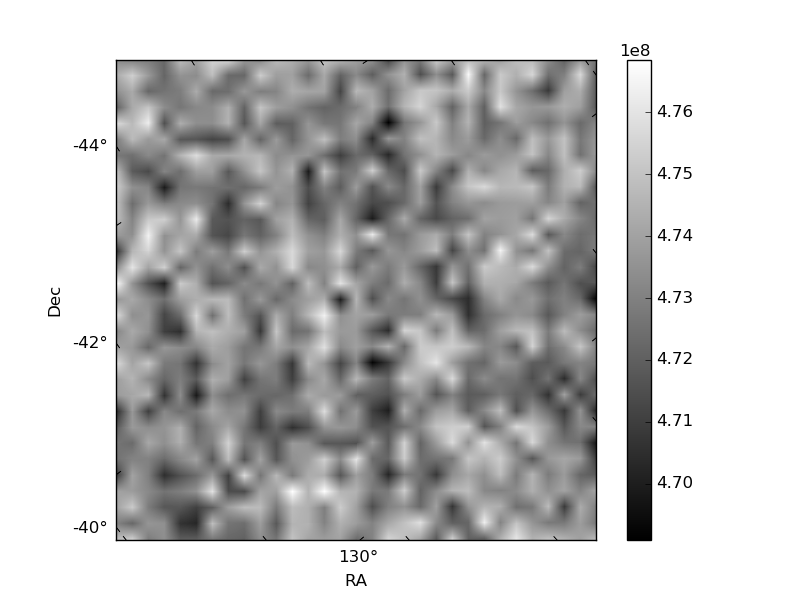
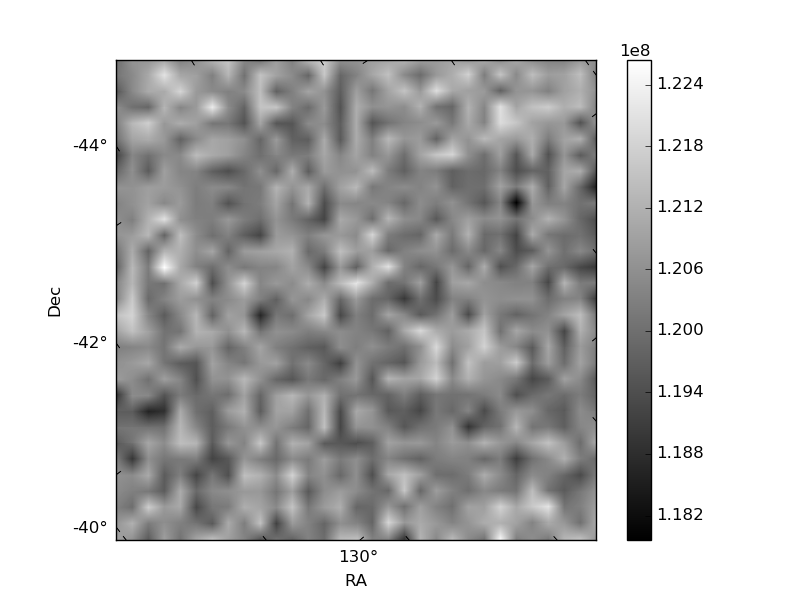
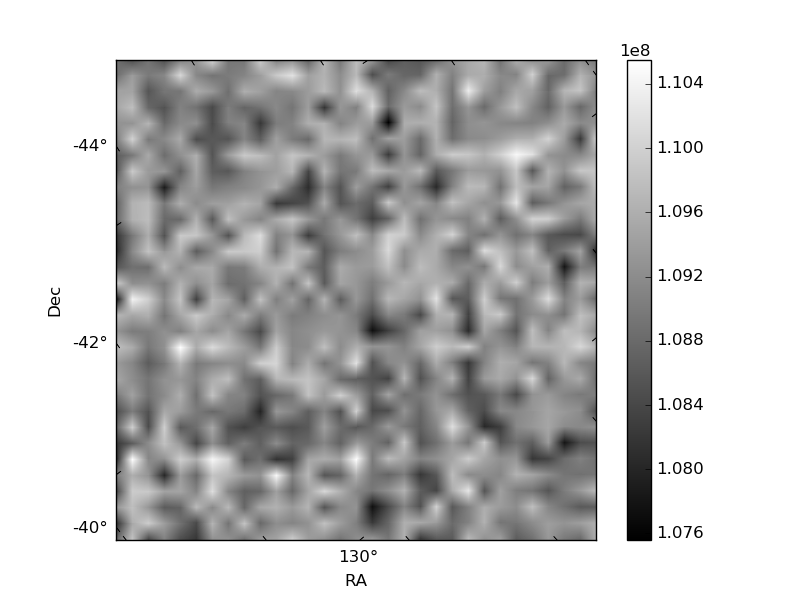
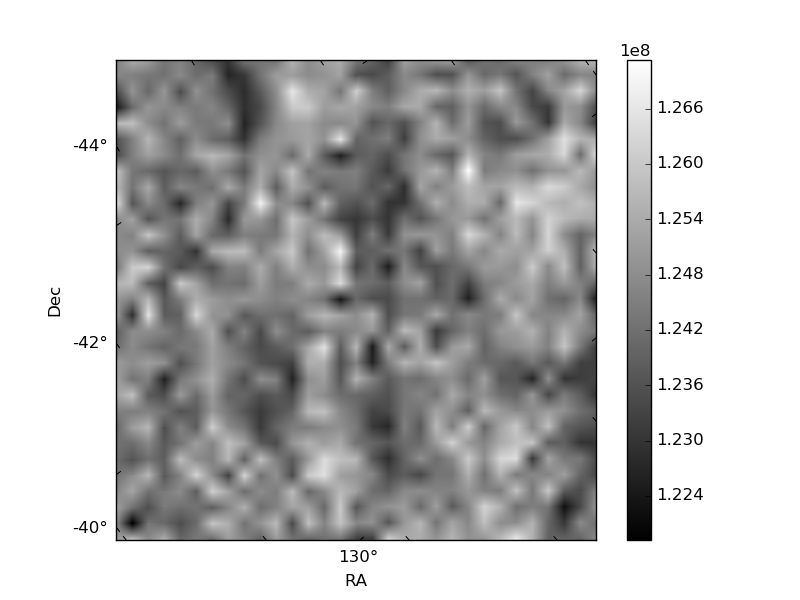
Histogram calculated using DETX and DETY for each event in the final _common_clean file
| Quadrant A | 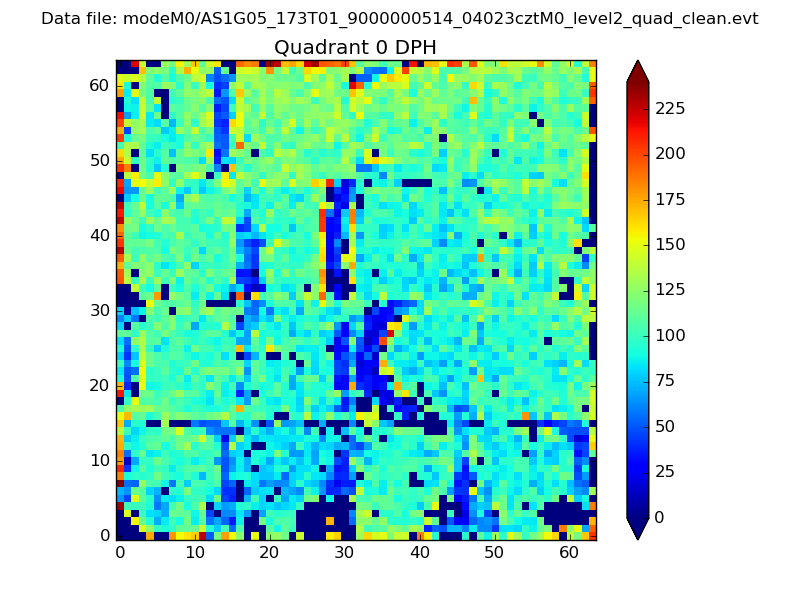 |
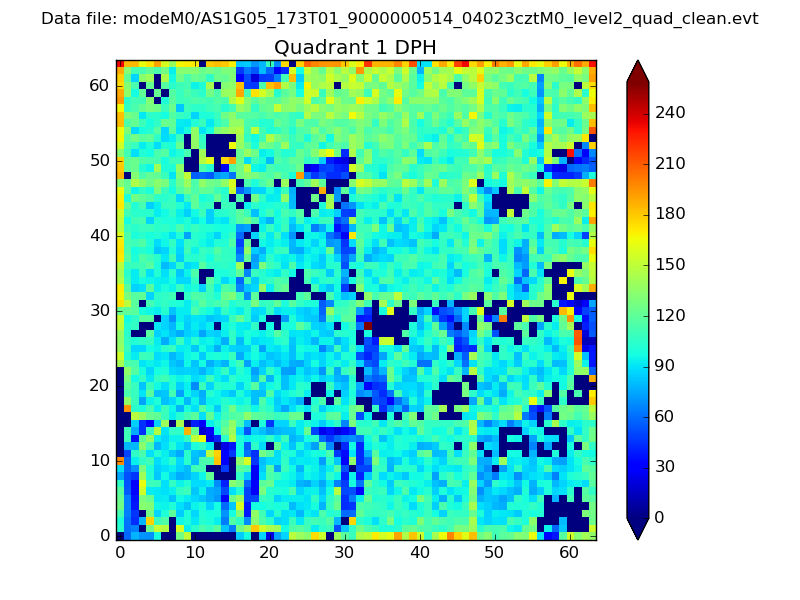 |
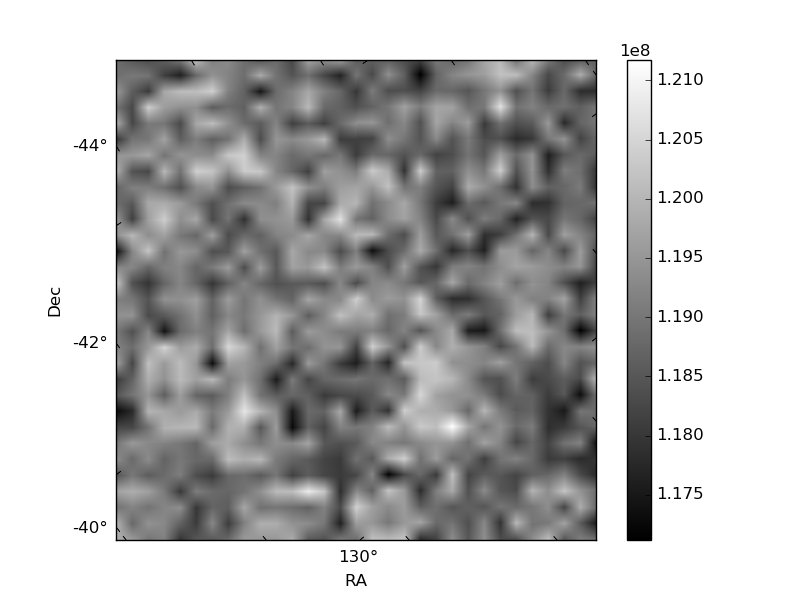
Quadrant B |
|---|---|---|---|
| Quadrant D | 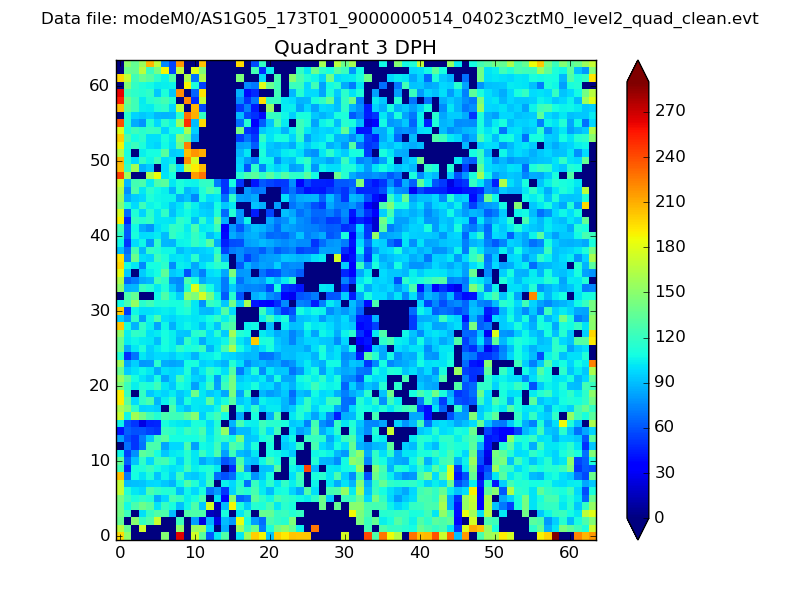 |
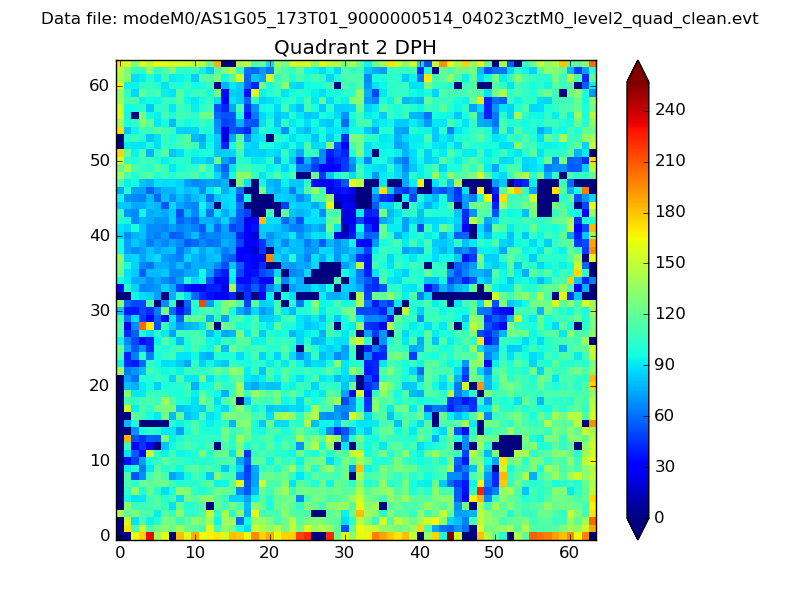 |
Quadrant C |
| Plot type | Count rate plots | Images |
|---|---|---|
| Comparison with Poisson distribution Blue bars denote a histogram of data divided into 1 sec bins. Red curve is a Poisson curve with rate = median count rate of data. |
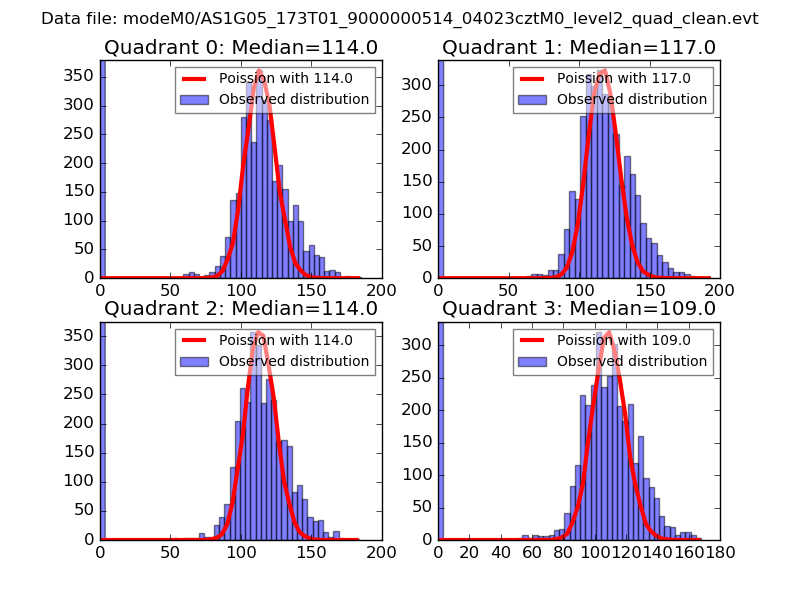 |
 |
| Quadrant-wise count rates Data is divided into 100 sec bins |
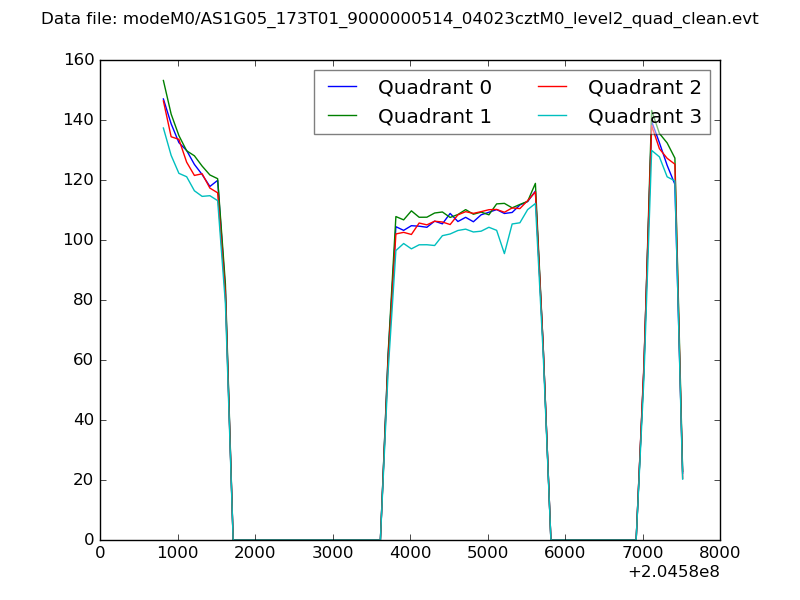 |
|
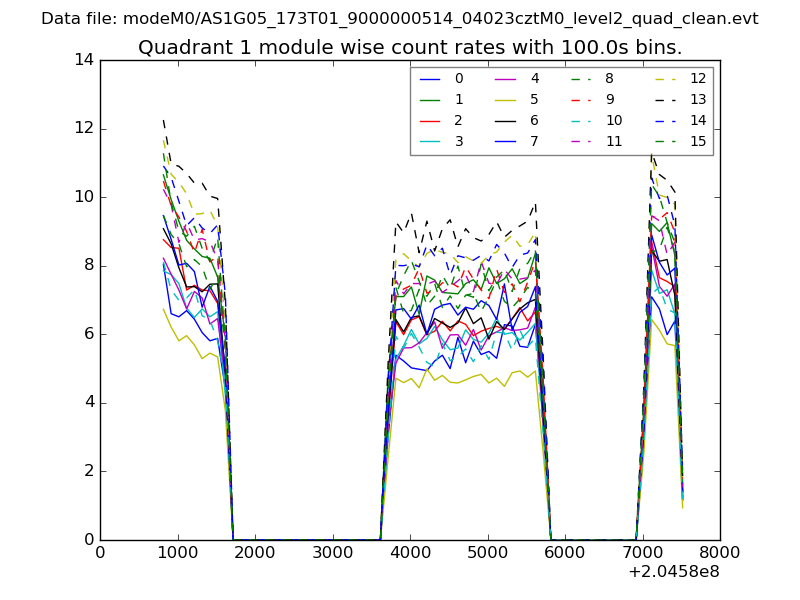
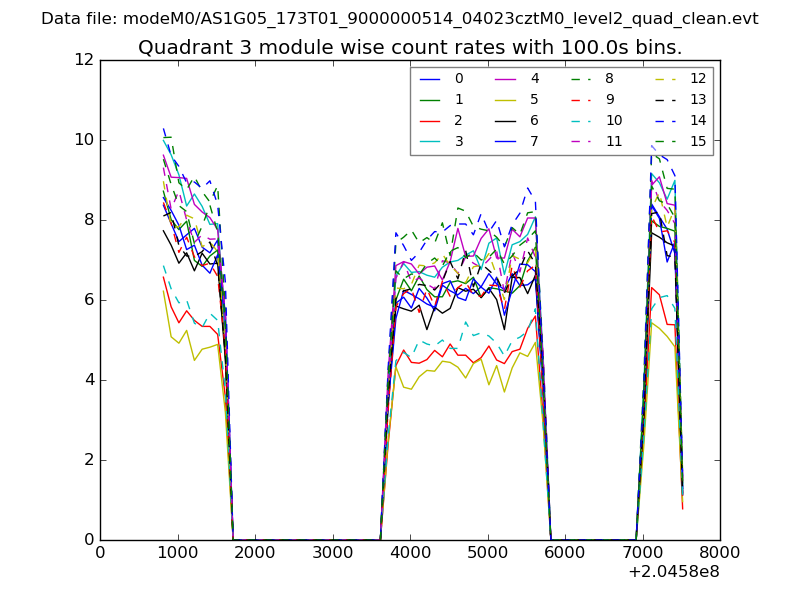
| Module-wise count rates for Quadrant A Data is divided into 100 sec bins |
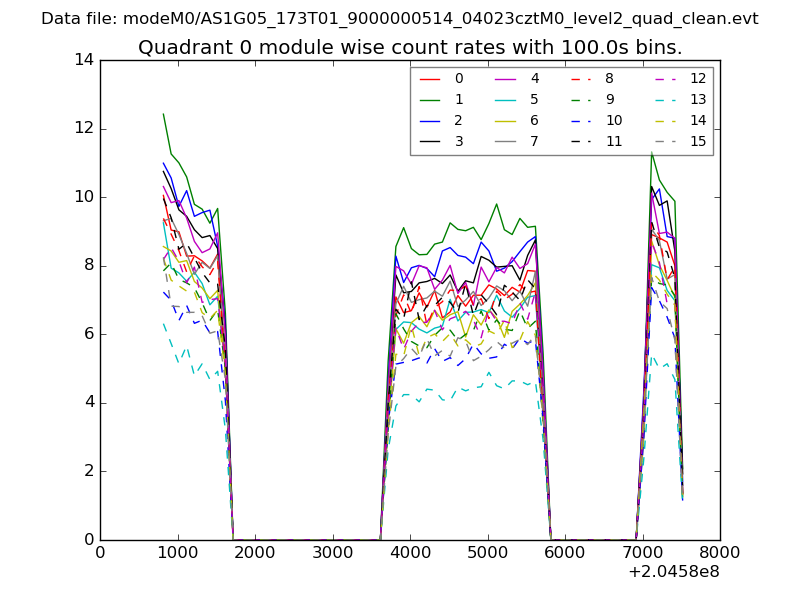 |
 |
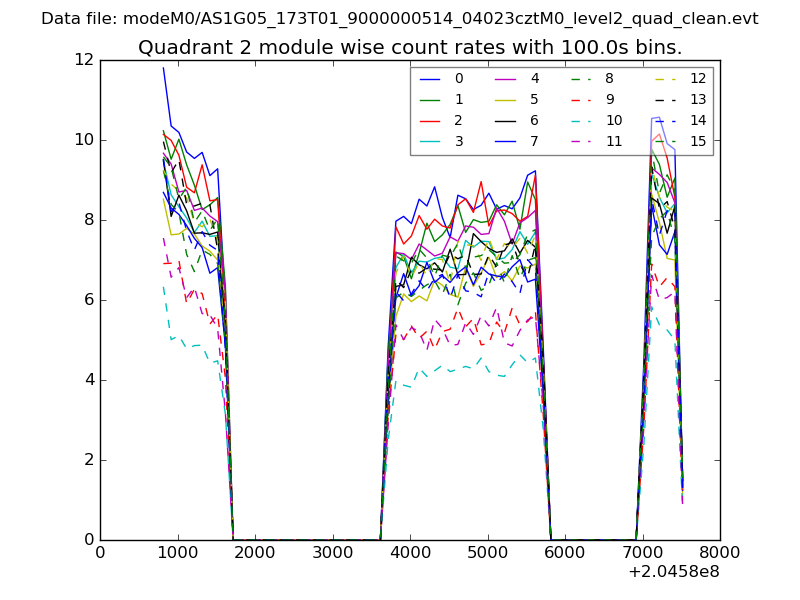
| Module-wise count rates for Quadrant B Data is divided into 100 sec bins |
 |
 |
| Module-wise count rates for Quadrant C Data is divided into 100 sec bins |
 |
 |
| Module-wise count rates for Quadrant D Data is divided into 100 sec bins |
 |
 |
| Parameter | Plot |
|---|---|
| CZT HV Monitor | 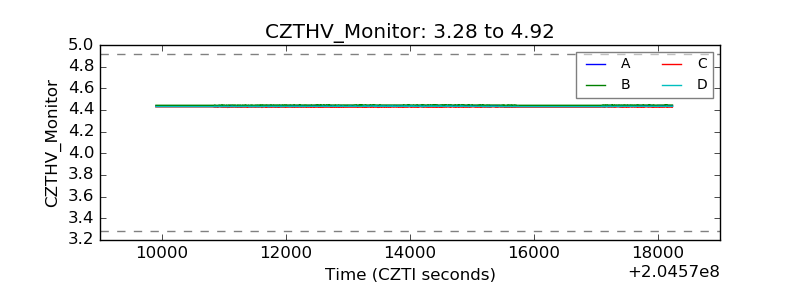 |
| D_VDD | 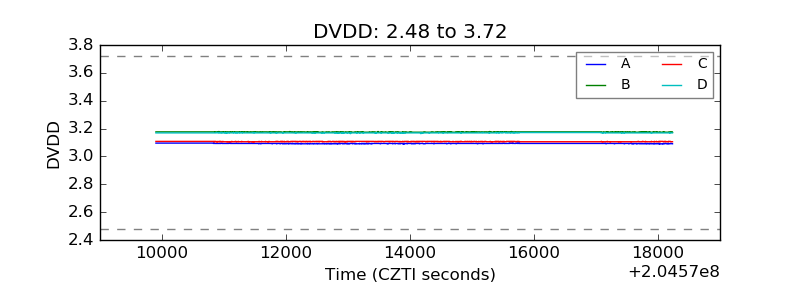 |
| Temperature 1 | 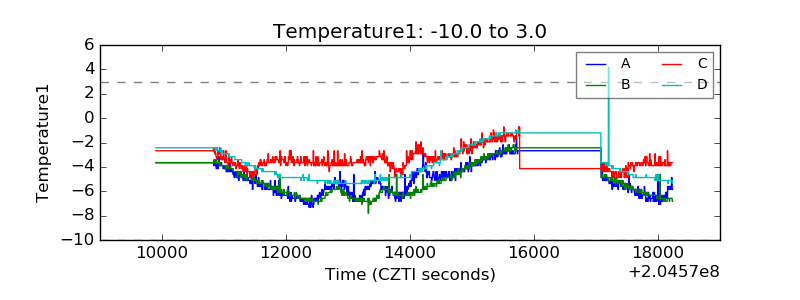 |
| Veto HV Monitor | 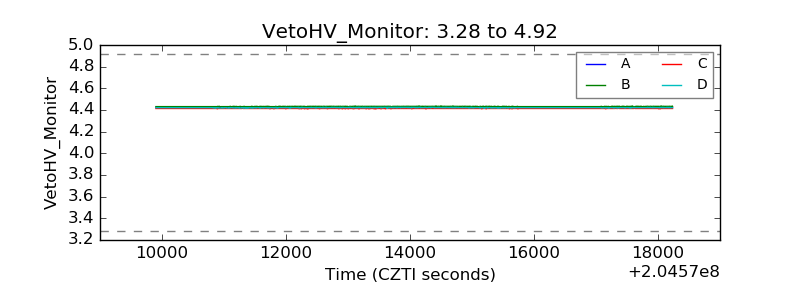 |
| Veto LLD | 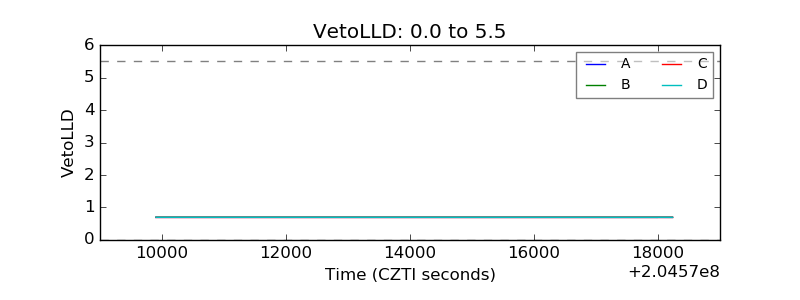 |
| Alpha Counter | 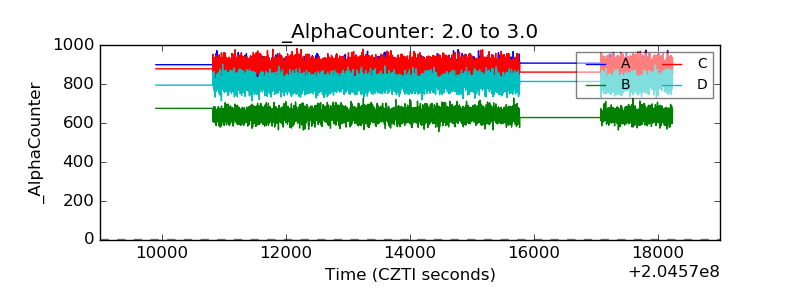 |
| _CPM_Rate | 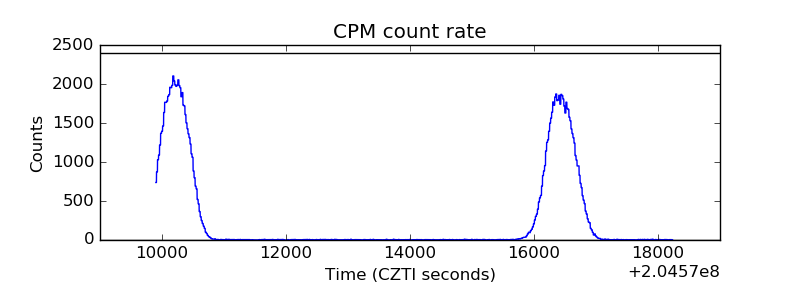 |
| CZT Counter | 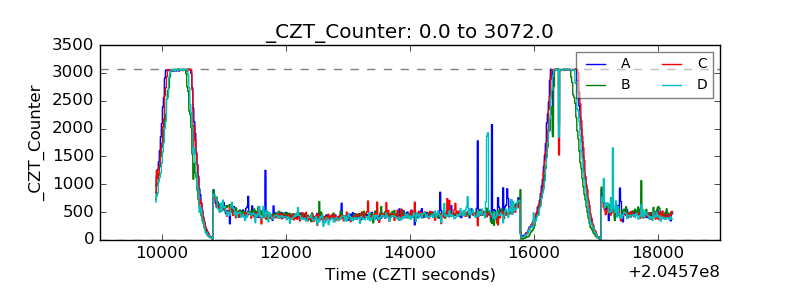 |
| +2.5 Volts monitor | 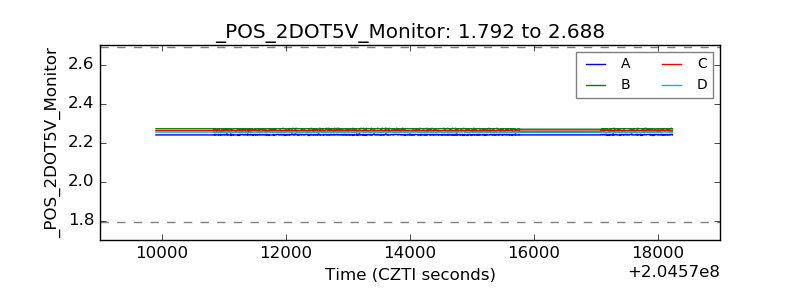 |
| +5 Volts monitor | 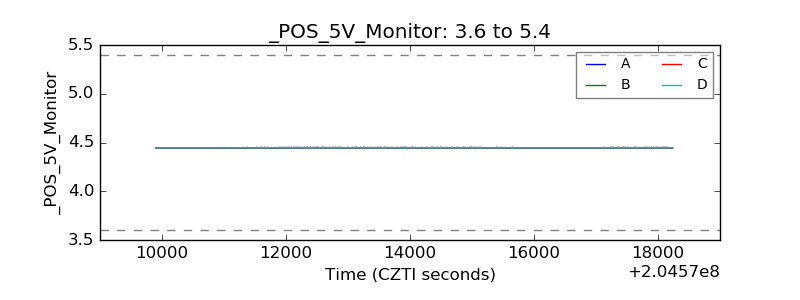 |
| _ROLL_ROT | 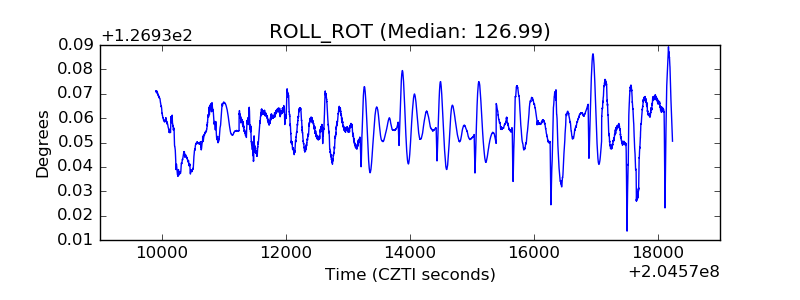 |
| _Roll_DEC | 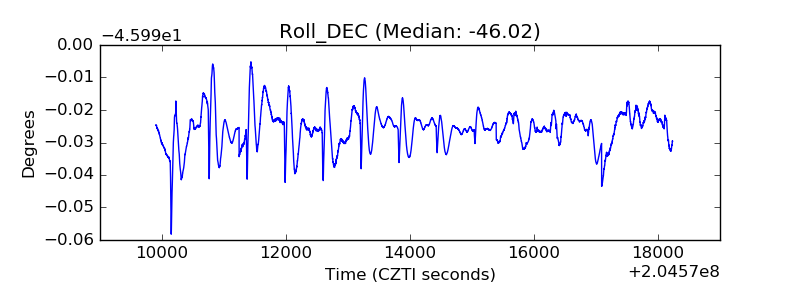 |
| _Roll_RA | 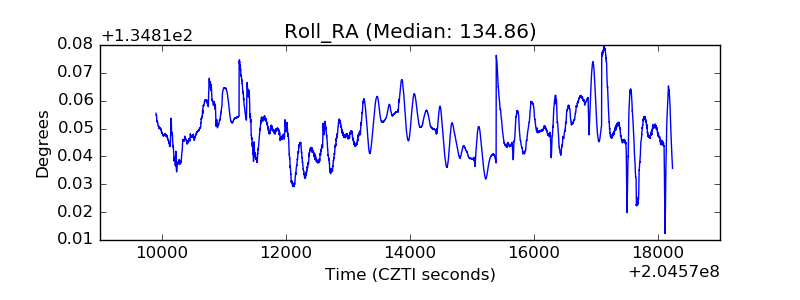 |
| Veto Counter | 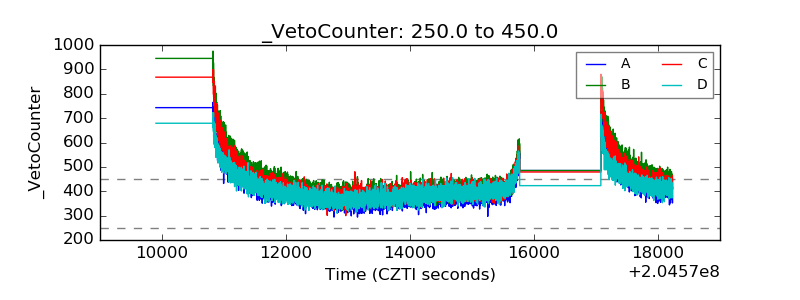 |