| Param | Original file | Final file |
|---|---|---|
| Filename | modeM0/AS1G05_173T01_9000000514_04024cztM0_level2.evt | modeM0/AS1G05_173T01_9000000514_04024cztM0_level2_quad_clean.evt |
| Size (bytes) | 413,343,360 | 57,447,360 |
| Size | 394.2 MB | 54.8 MB |
| Events in quadrant A | 3,117,203 | 326,805 |
| Events in quadrant B | 3,155,025 | 333,183 |
| Events in quadrant C | 2,922,317 | 326,574 |
| Events in quadrant D | 2,895,136 | 312,972 |
| Mode M9 | |||
|---|---|---|---|
| Quadrant | BADHDUFLAG | Total packets | Discarded packets |
| A | 0 | 22 | 0 |
| B | 0 | 22 | 0 |
| C | 0 | 22 | 0 |
| D | 0 | 23 | 0 |
| Mode M0 | |||
|---|---|---|---|
| Quadrant | BADHDUFLAG | Total packets | Discarded packets |
| A | 0 | 13436 | 3 |
| B | 0 | 13353 | 2 |
| C | 0 | 12986 | 2 |
| D | 0 | 13151 | 2 |
| Mode SS | |||
|---|---|---|---|
| Quadrant | BADHDUFLAG | Total packets | Discarded packets |
| A | 0 | 128 | 0 |
| B | 0 | 128 | 0 |
| C | 0 | 128 | 0 |
| D | 0 | 128 | 0 |
| Quadrant | Total seconds | Saturated seconds | Saturation percentage |
|---|---|---|---|
| A | 6298 | 57 | 0.905049% |
| B | 6298 | 23 | 0.365195% |
| C | 6298 | 11 | 0.174659% |
| D | 6298 | 29 | 0.460464% |
Noise dominated data is calculated using 1-second bins in cleaned event files. If a bin has >2000 counts, and if more than 50% of those come from <1% of pixels, then it is considered to be noise-dominated and hence unusable.
| Quadrant | # 1 sec bins | Bins with >0 counts | Bins with >2000 counts | High rate bins dominated by noise | Noise dominated (total time) | Noise dominated (detector-on time) | Marked lightcurve |
|---|---|---|---|---|---|---|---|
| A | 7628 | 6299 | 30 | 30 | 0.39% | 0.48% | 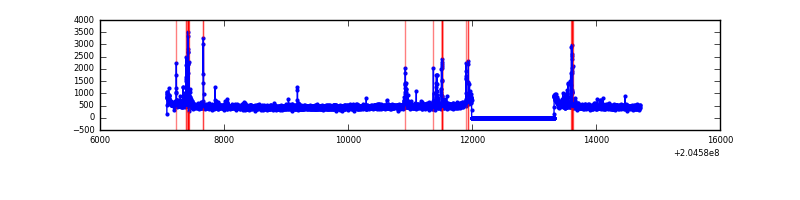 |
| B | 7628 | 6299 | 6 | 6 | 0.08% | 0.10% | 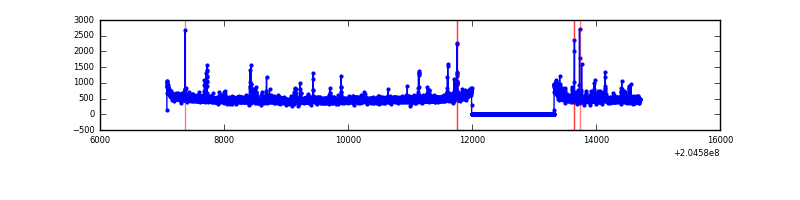 |
| C | 7628 | 6299 | 7 | 7 | 0.09% | 0.11% | 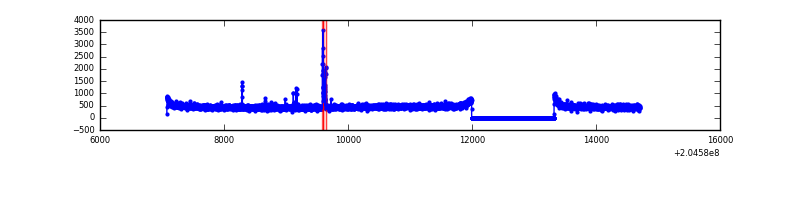 |
| D | 7628 | 6299 | 12 | 12 | 0.16% | 0.19% | 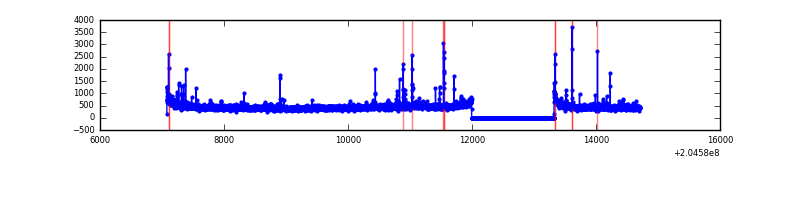 |
Top three noisy pixels from each quadrant. If the there are fewer than three noisy pixels in the level2.evt file, extra rows are filled as -1
| Pixel properties | Quadrant properties | ||||||
|---|---|---|---|---|---|---|---|
| Quadrant | DetID | PixID | Counts | Sigma | Mean | Median | Sigma |
| A | 0 | 50 | 143684 | 927.1 | 755 | 740 | 154.2 |
| A | 0 | 118 | 31284 | 198.1 | 755 | 740 | 154.2 |
| A | 7 | 16 | 17420 | 108.18 | 755 | 740 | 154.2 |
| B | 4 | 81 | 102595 | 702.35 | 768 | 752 | 145.0 |
| B | 14 | 167 | 28711 | 192.82 | 768 | 752 | 145.0 |
| B | 0 | 172 | 26682 | 178.82 | 768 | 752 | 145.0 |
| C | 4 | 112 | 47022 | 274.83 | 728 | 733 | 168.4 |
| C | 9 | 144 | 19142 | 109.3 | 728 | 733 | 168.4 |
| C | 10 | 65 | 6211 | 32.52 | 728 | 733 | 168.4 |
| D | 2 | 14 | 42059 | 241.21 | 720 | 700 | 171.5 |
| D | 2 | 232 | 36738 | 210.18 | 720 | 700 | 171.5 |
| D | 10 | 246 | 23929 | 135.47 | 720 | 700 | 171.5 |
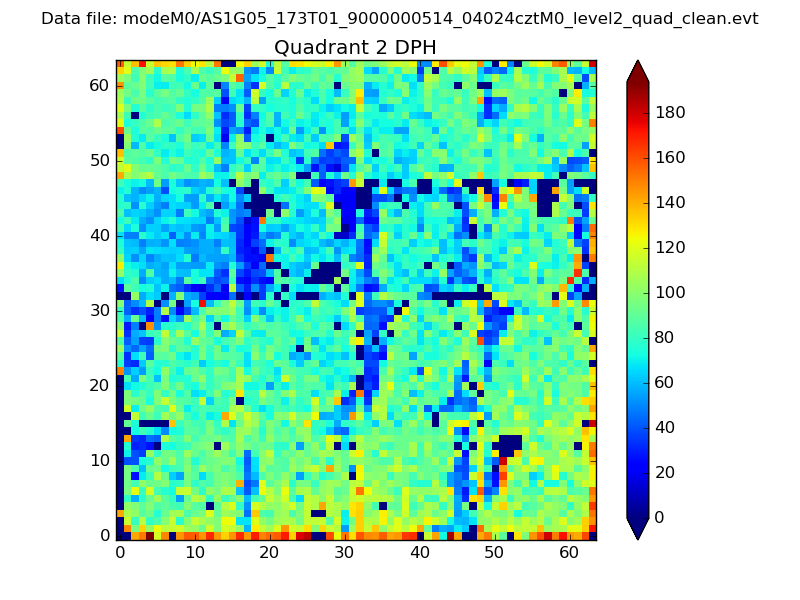
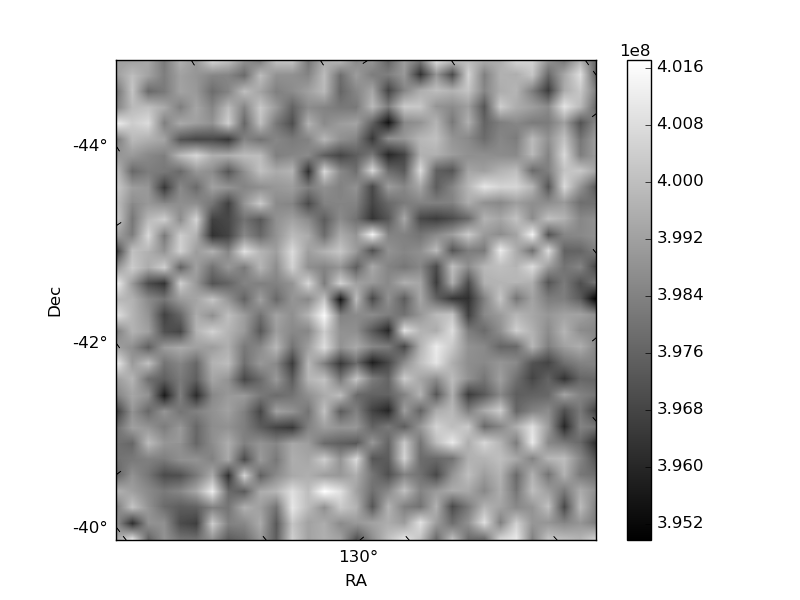
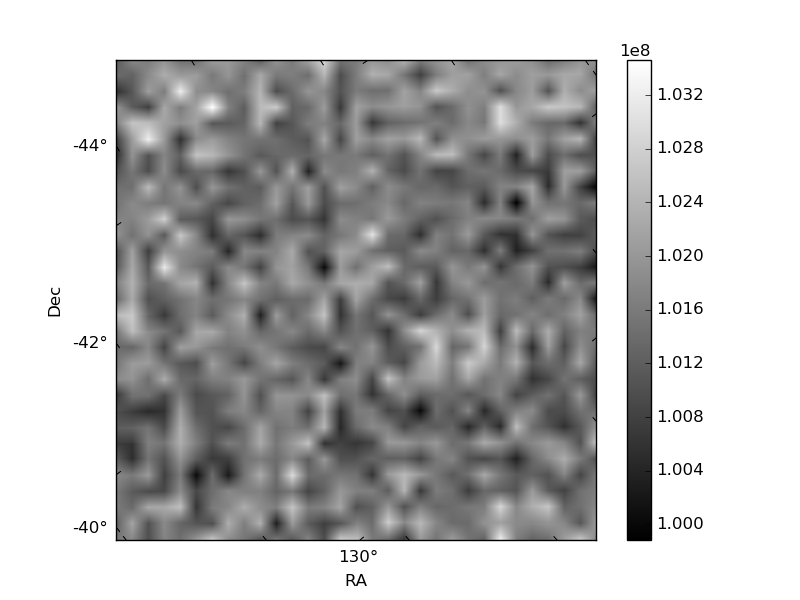
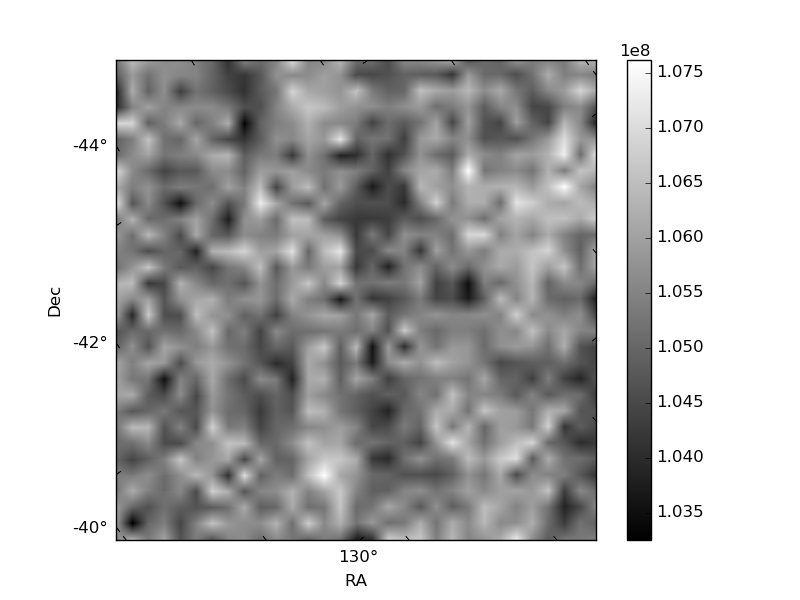
Histogram calculated using DETX and DETY for each event in the final _common_clean file
| Quadrant A | 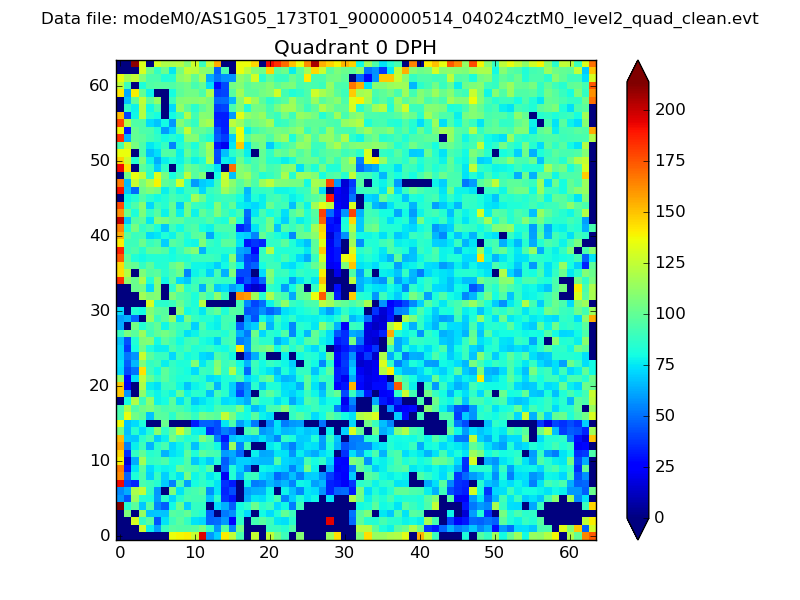 |
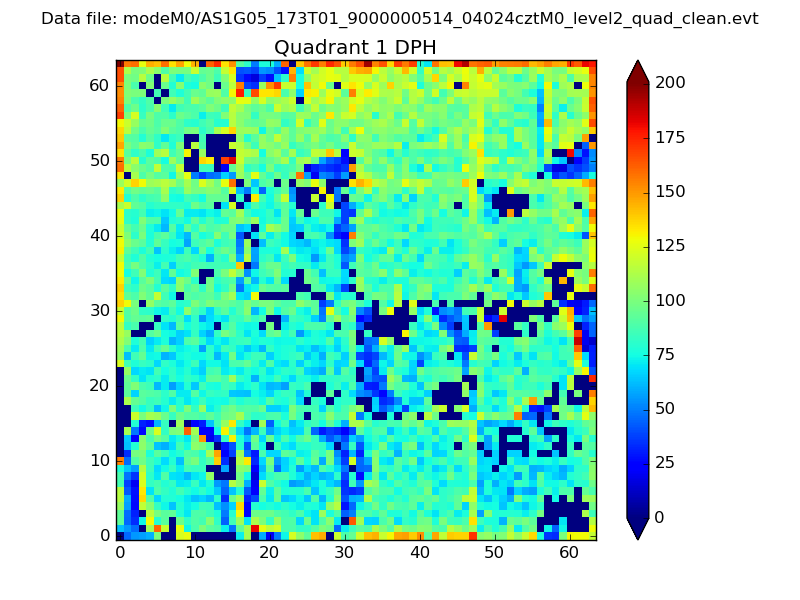 |
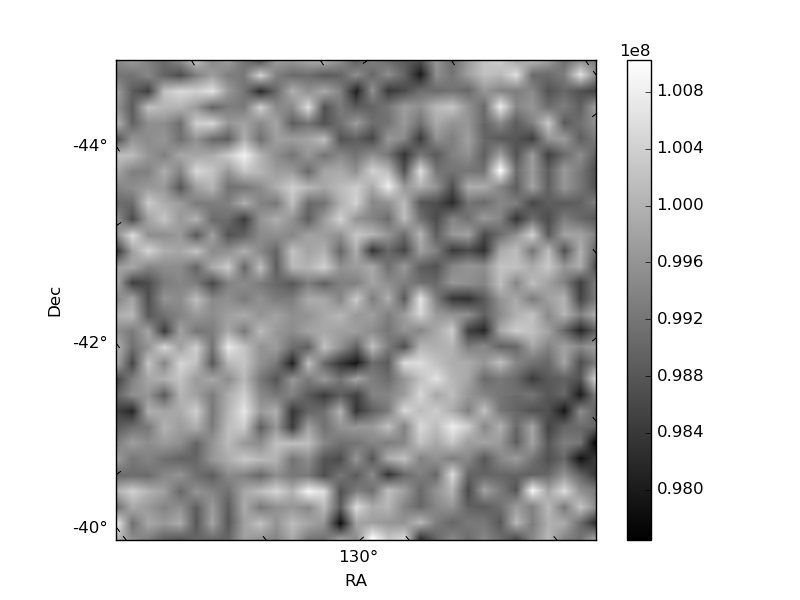
Quadrant B |
|---|---|---|---|
| Quadrant D | 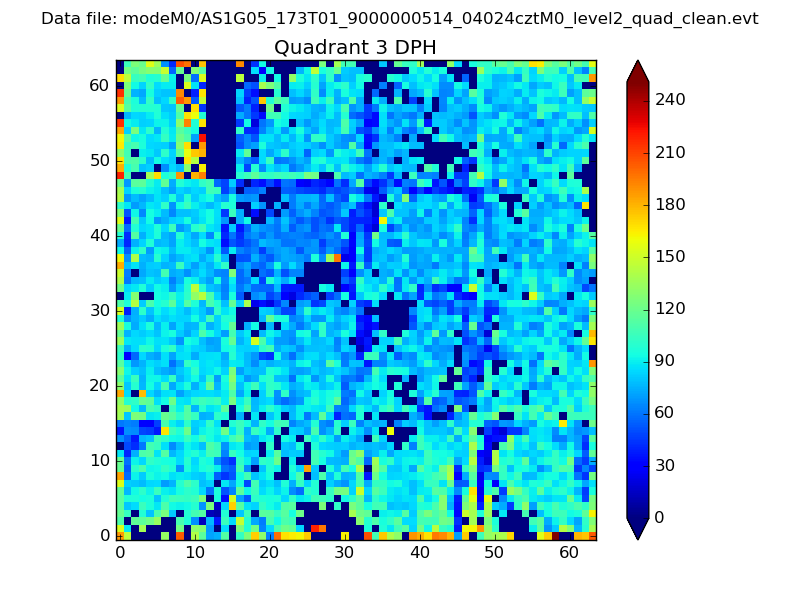 |
 |
Quadrant C |
| Plot type | Count rate plots | Images |
|---|---|---|
| Comparison with Poisson distribution Blue bars denote a histogram of data divided into 1 sec bins. Red curve is a Poisson curve with rate = median count rate of data. |
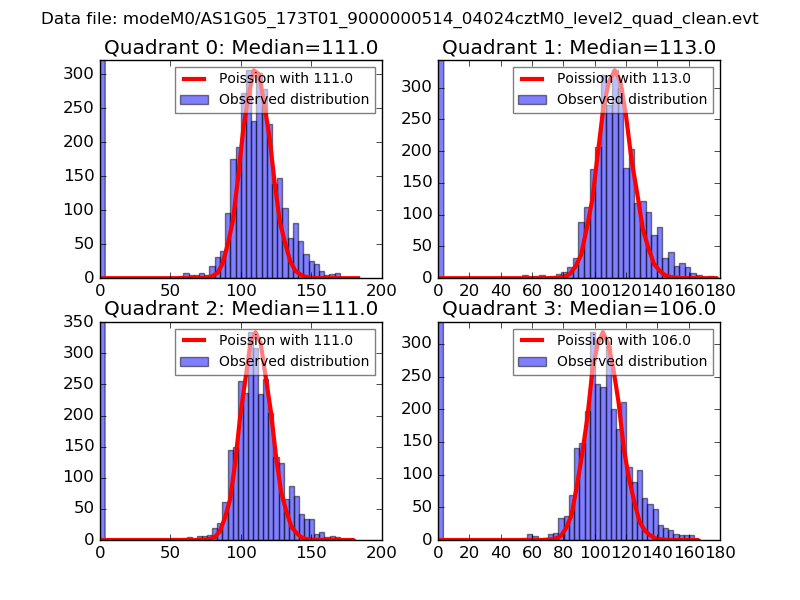 |
 |
| Quadrant-wise count rates Data is divided into 100 sec bins |
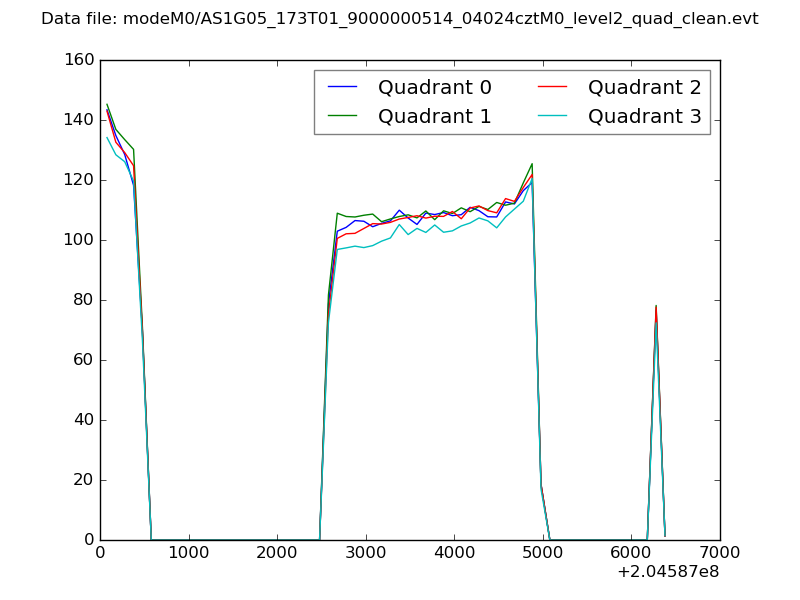 |
|
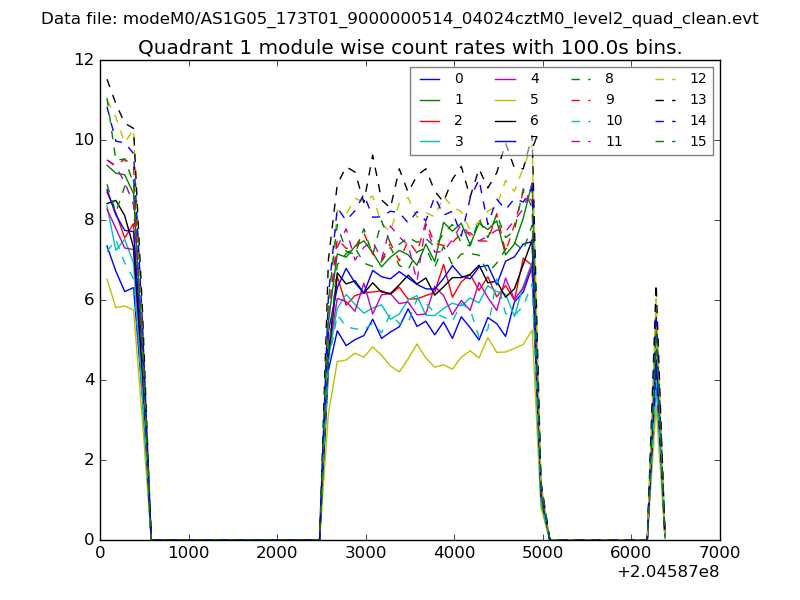
| Module-wise count rates for Quadrant A Data is divided into 100 sec bins |
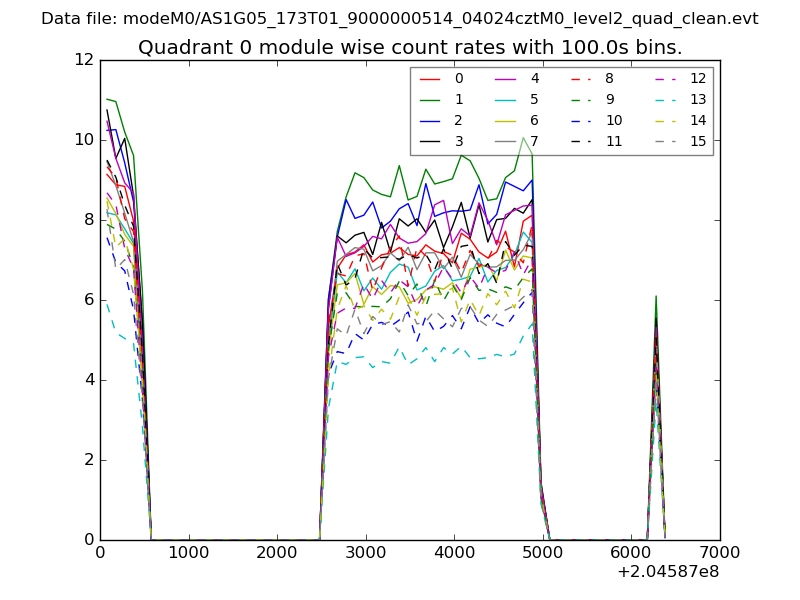 |
 |
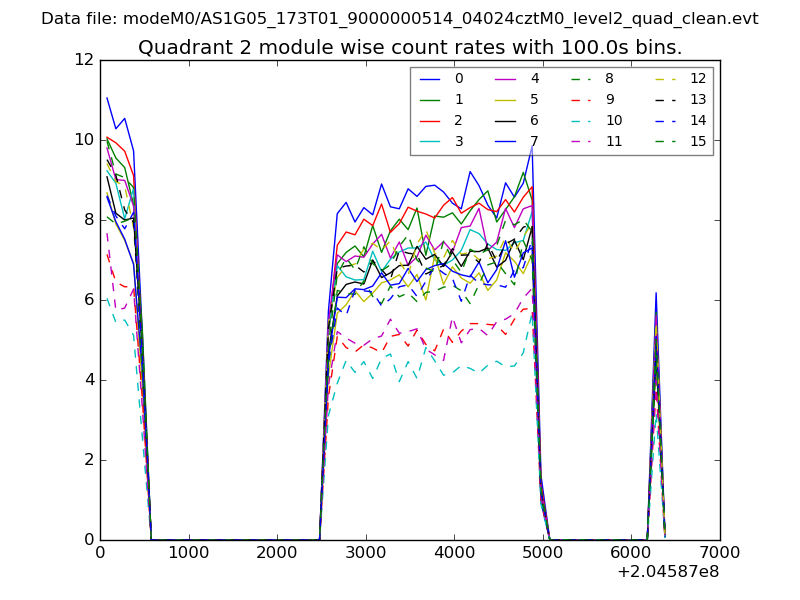
| Module-wise count rates for Quadrant B Data is divided into 100 sec bins |
 |
 |
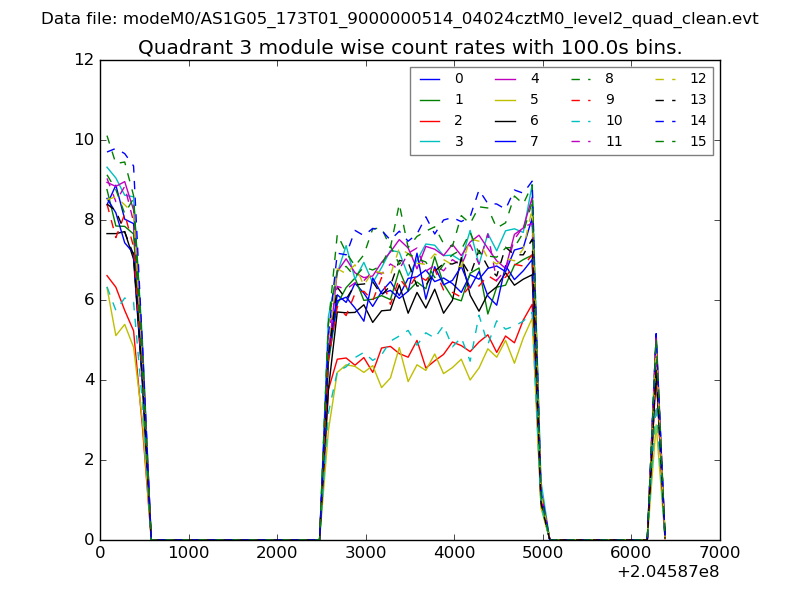
| Module-wise count rates for Quadrant C Data is divided into 100 sec bins |
 |
 |
| Module-wise count rates for Quadrant D Data is divided into 100 sec bins |
 |
 |
| Parameter | Plot |
|---|---|
| CZT HV Monitor | 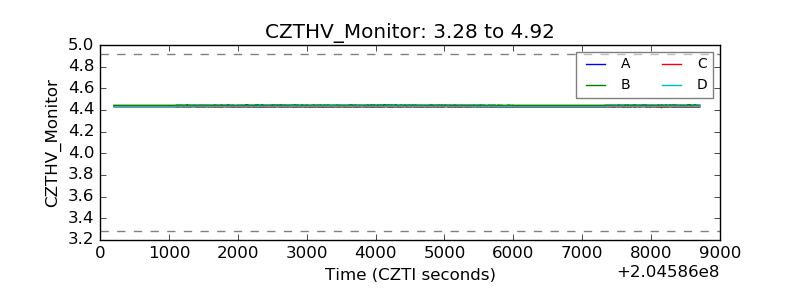 |
| D_VDD | 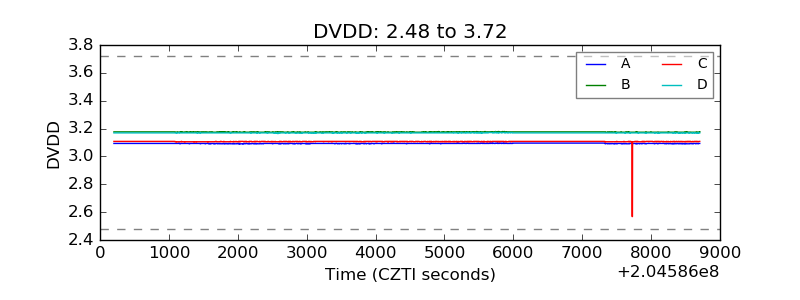 |
| Temperature 1 | 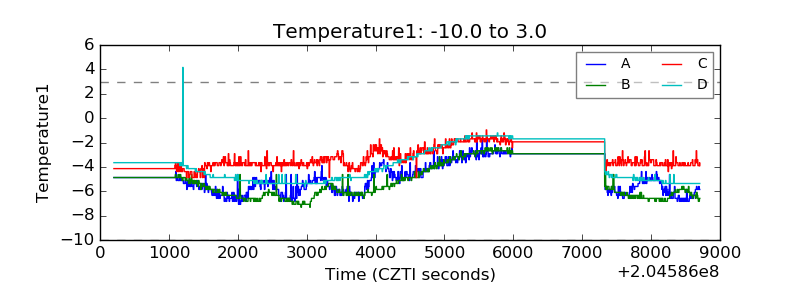 |
| Veto HV Monitor | 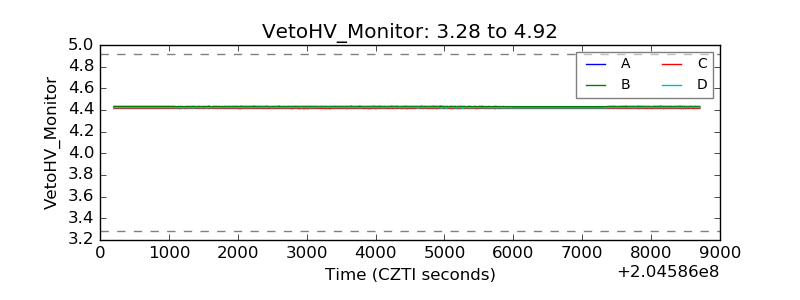 |
| Veto LLD |  |
| Alpha Counter | 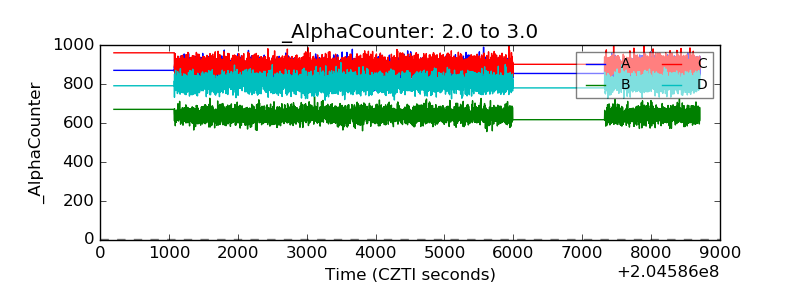 |
| _CPM_Rate | 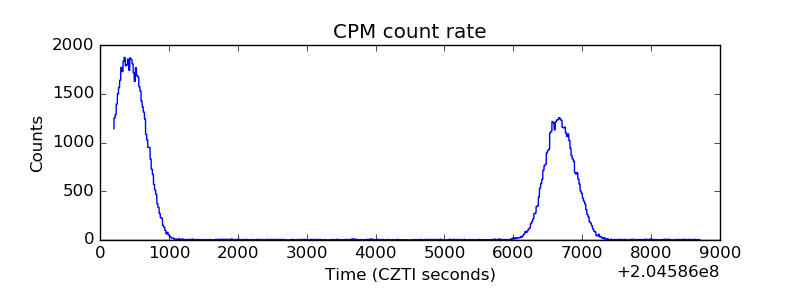 |
| CZT Counter | 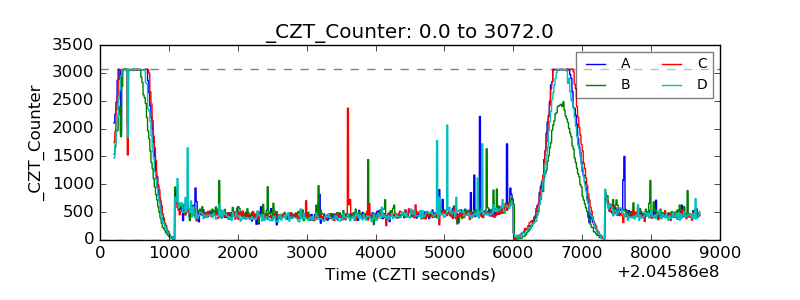 |
| +2.5 Volts monitor |  |
| +5 Volts monitor |  |
| _ROLL_ROT | 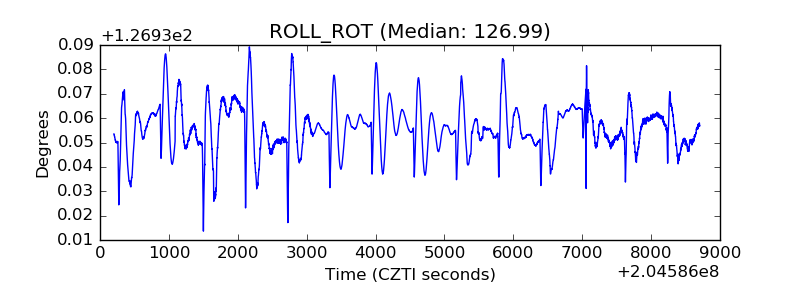 |
| _Roll_DEC | 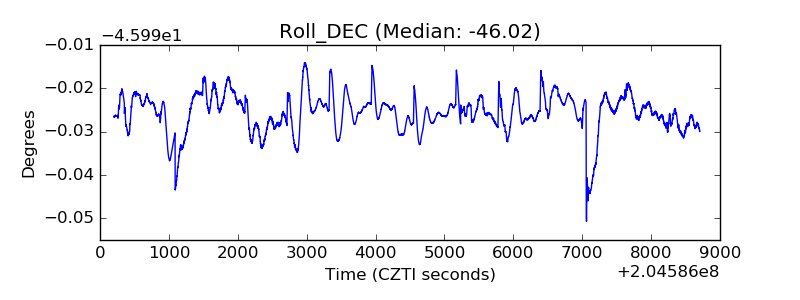 |
| _Roll_RA | 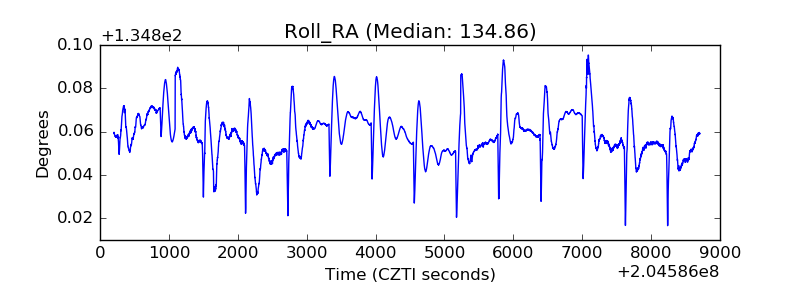 |
| Veto Counter | 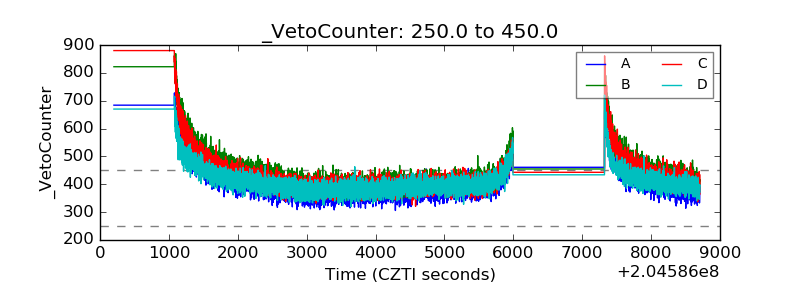 |