| Param | Original file | Final file |
|---|---|---|
| Filename | modeM0/AS1G05_173T01_9000000514_04026cztM0_level2.evt | modeM0/AS1G05_173T01_9000000514_04026cztM0_level2_quad_clean.evt |
| Size (bytes) | 425,531,520 | 64,408,320 |
| Size | 405.8 MB | 61.4 MB |
| Events in quadrant A | 3,254,574 | 373,063 |
| Events in quadrant B | 3,095,593 | 376,635 |
| Events in quadrant C | 2,946,877 | 374,085 |
| Events in quadrant D | 3,136,286 | 361,049 |
| Mode M9 | |||
|---|---|---|---|
| Quadrant | BADHDUFLAG | Total packets | Discarded packets |
| A | 0 | 17 | 0 |
| B | 0 | 17 | 0 |
| C | 0 | 17 | 0 |
| D | 0 | 18 | 0 |
| Mode M0 | |||
|---|---|---|---|
| Quadrant | BADHDUFLAG | Total packets | Discarded packets |
| A | 0 | 14382 | 3 |
| B | 0 | 13687 | 2 |
| C | 0 | 13617 | 2 |
| D | 0 | 14190 | 2 |
| Mode SS | |||
|---|---|---|---|
| Quadrant | BADHDUFLAG | Total packets | Discarded packets |
| A | 0 | 134 | 0 |
| B | 0 | 134 | 0 |
| C | 0 | 134 | 0 |
| D | 0 | 134 | 0 |
| Quadrant | Total seconds | Saturated seconds | Saturation percentage |
|---|---|---|---|
| A | 6677 | 95 | 1.422795% |
| B | 6677 | 71 | 1.063352% |
| C | 6677 | 48 | 0.718886% |
| D | 6677 | 69 | 1.033398% |
Noise dominated data is calculated using 1-second bins in cleaned event files. If a bin has >2000 counts, and if more than 50% of those come from <1% of pixels, then it is considered to be noise-dominated and hence unusable.
| Quadrant | # 1 sec bins | Bins with >0 counts | Bins with >2000 counts | High rate bins dominated by noise | Noise dominated (total time) | Noise dominated (detector-on time) | Marked lightcurve |
|---|---|---|---|---|---|---|---|
| A | 7622 | 6679 | 11 | 11 | 0.14% | 0.16% | 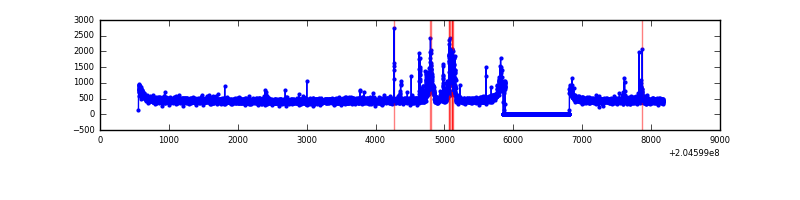 |
| B | 7622 | 6679 | 0 | 0 | 0.00% | 0.00% | 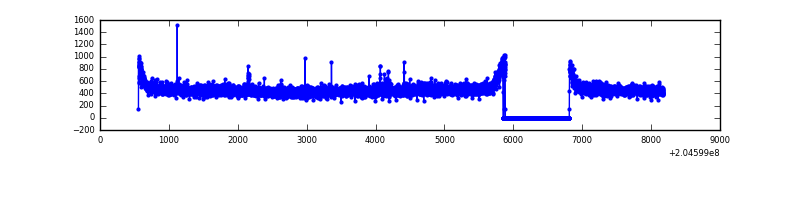 |
| C | 7622 | 6679 | 0 | 0 | 0.00% | 0.00% | 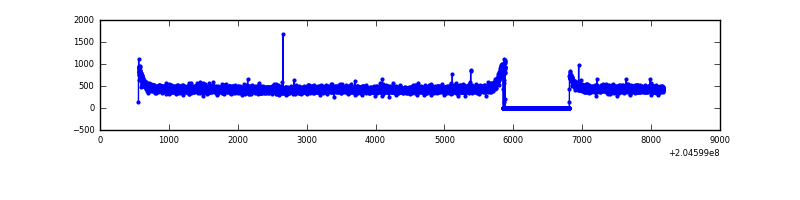 |
| D | 7622 | 6679 | 16 | 16 | 0.21% | 0.24% | 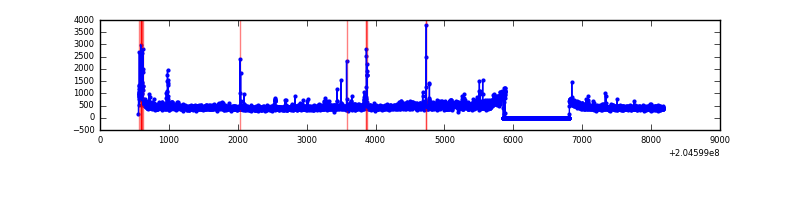 |
Top three noisy pixels from each quadrant. If the there are fewer than three noisy pixels in the level2.evt file, extra rows are filled as -1
| Pixel properties | Quadrant properties | ||||||
|---|---|---|---|---|---|---|---|
| Quadrant | DetID | PixID | Counts | Sigma | Mean | Median | Sigma |
| A | 0 | 50 | 232775 | 1468.62 | 772 | 754 | 158.0 |
| A | 14 | 111 | 31787 | 196.43 | 772 | 754 | 158.0 |
| A | 8 | 15 | 15716 | 94.7 | 772 | 754 | 158.0 |
| B | 15 | 204 | 29247 | 189.65 | 782 | 765 | 150.2 |
| B | 0 | 183 | 14759 | 93.18 | 782 | 765 | 150.2 |
| B | 4 | 81 | 13016 | 81.58 | 782 | 765 | 150.2 |
| C | 13 | 61 | 6339 | 31.91 | 751 | 753 | 175.1 |
| C | 1 | 16 | 4209 | 19.74 | 751 | 753 | 175.1 |
| C | 9 | 144 | 3937 | 18.19 | 751 | 753 | 175.1 |
| D | 11 | 132 | 122462 | 677.11 | 744 | 722 | 179.8 |
| D | 2 | 14 | 48434 | 265.37 | 744 | 722 | 179.8 |
| D | 2 | 232 | 36960 | 201.55 | 744 | 722 | 179.8 |
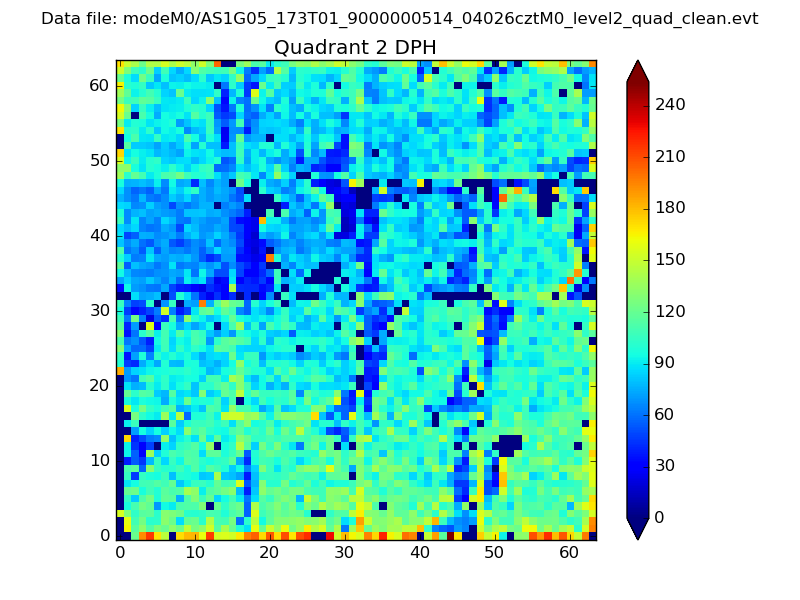
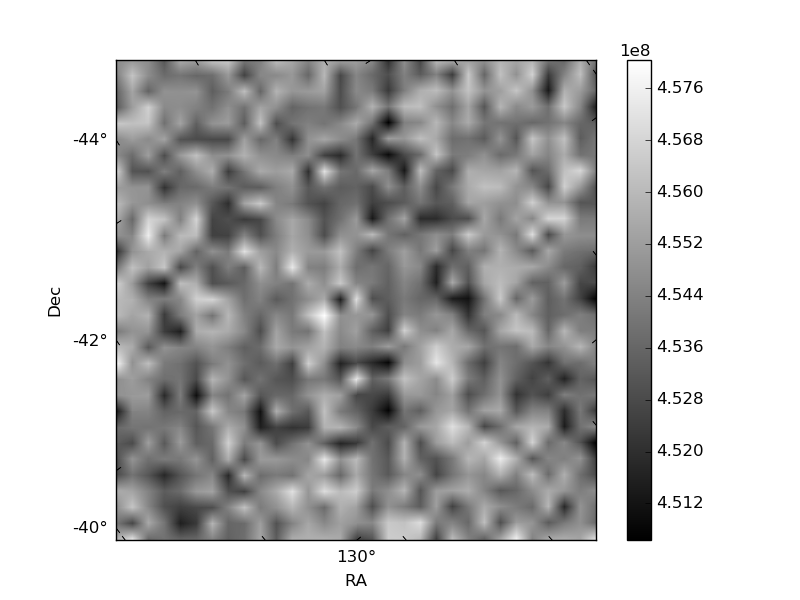
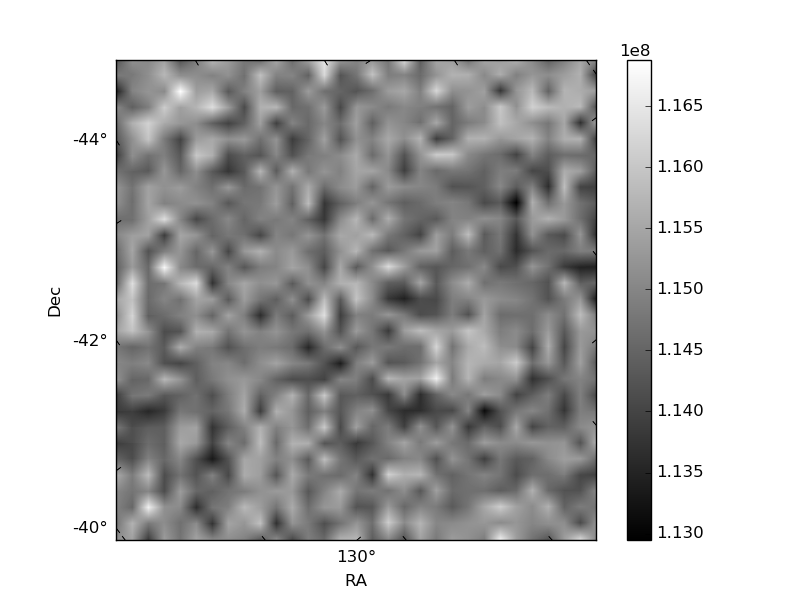
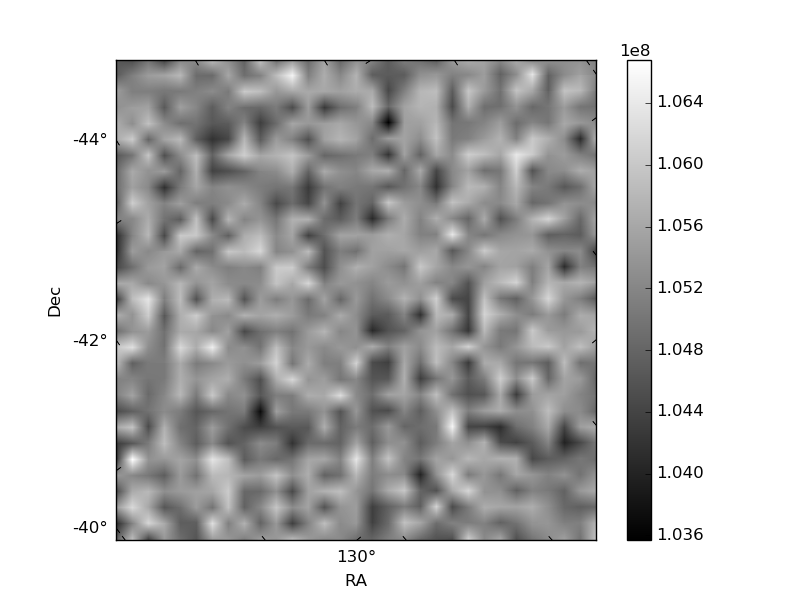
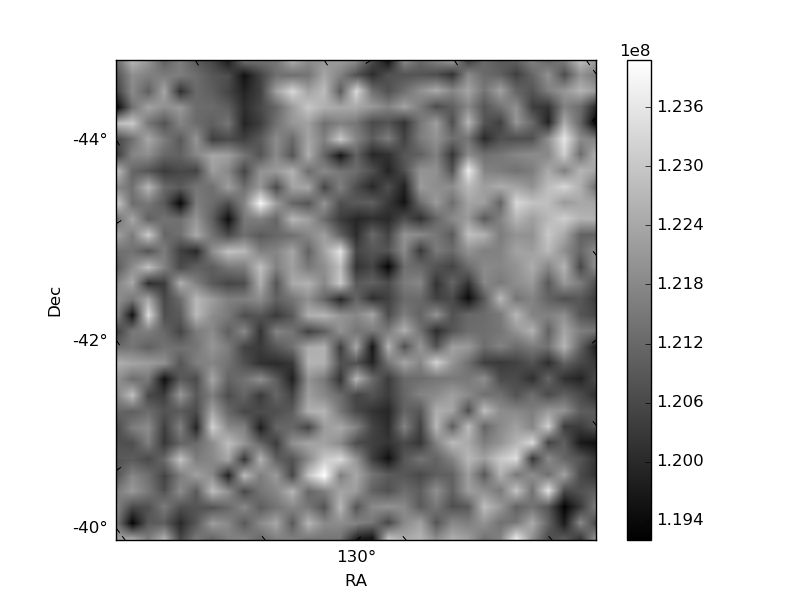
Histogram calculated using DETX and DETY for each event in the final _common_clean file
| Quadrant A | 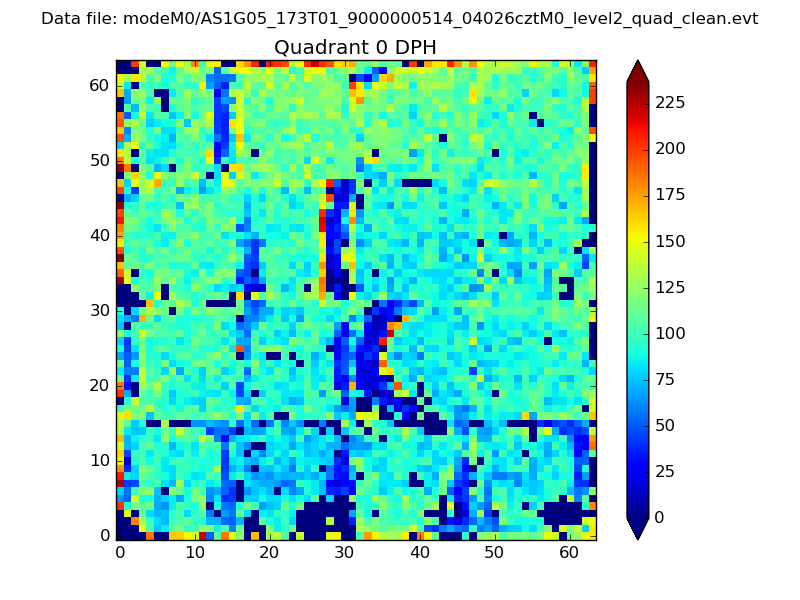 |
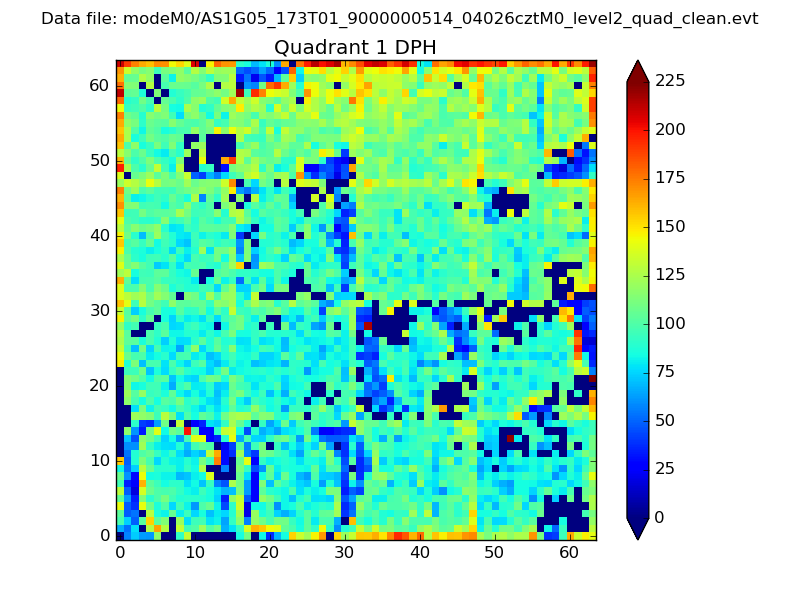 |
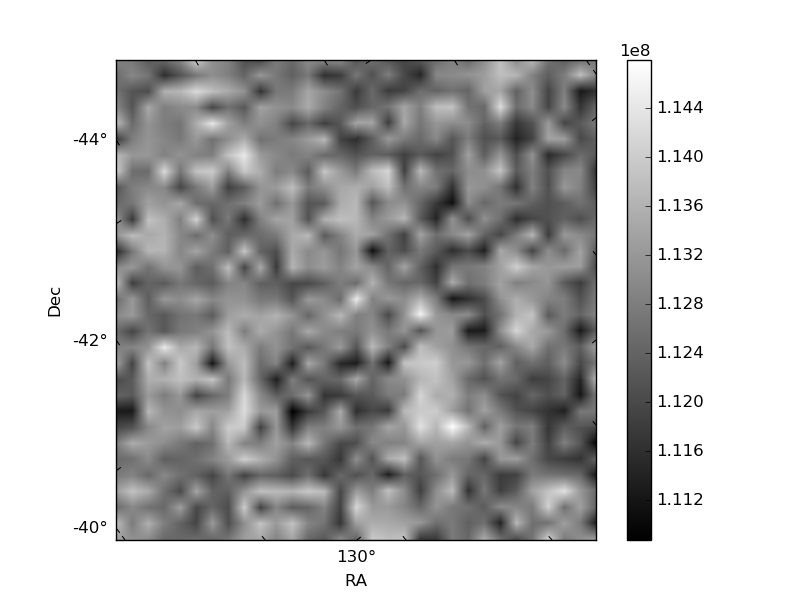
Quadrant B |
|---|---|---|---|
| Quadrant D | 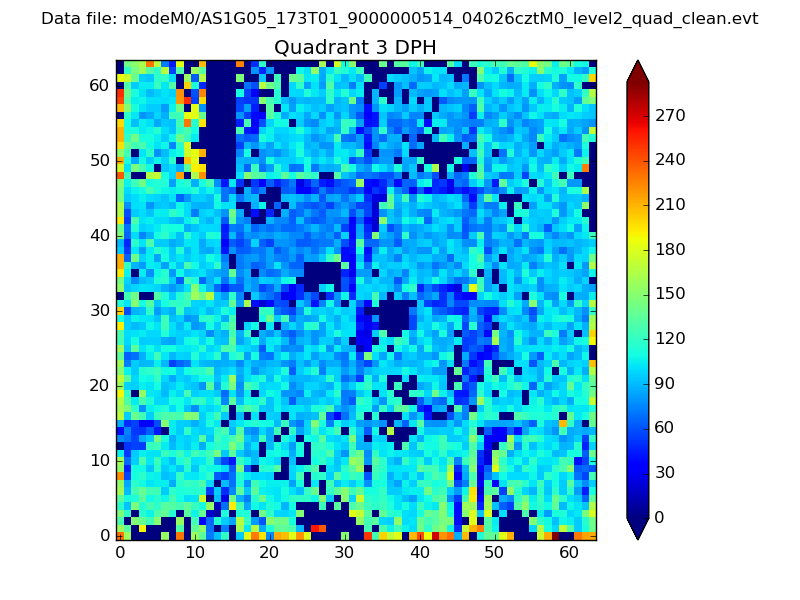 |
 |
Quadrant C |
| Plot type | Count rate plots | Images |
|---|---|---|
| Comparison with Poisson distribution Blue bars denote a histogram of data divided into 1 sec bins. Red curve is a Poisson curve with rate = median count rate of data. |
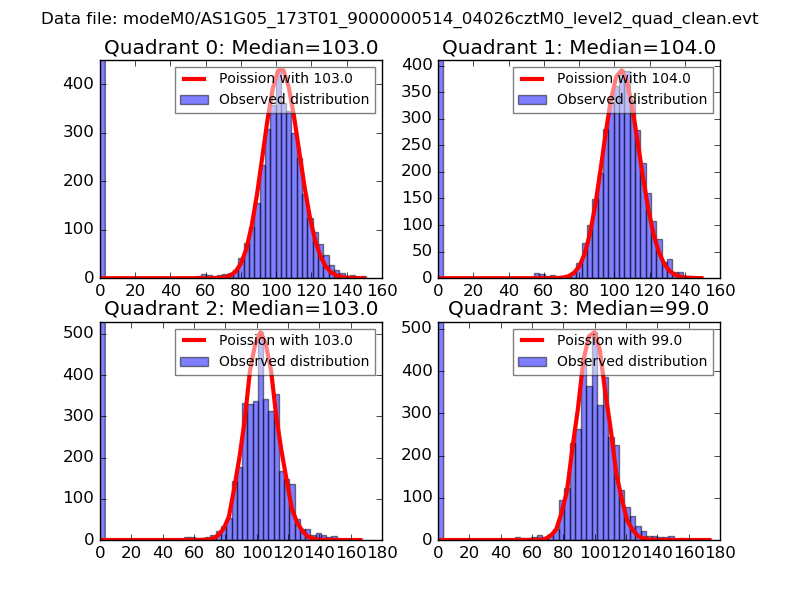 |
 |
| Quadrant-wise count rates Data is divided into 100 sec bins |
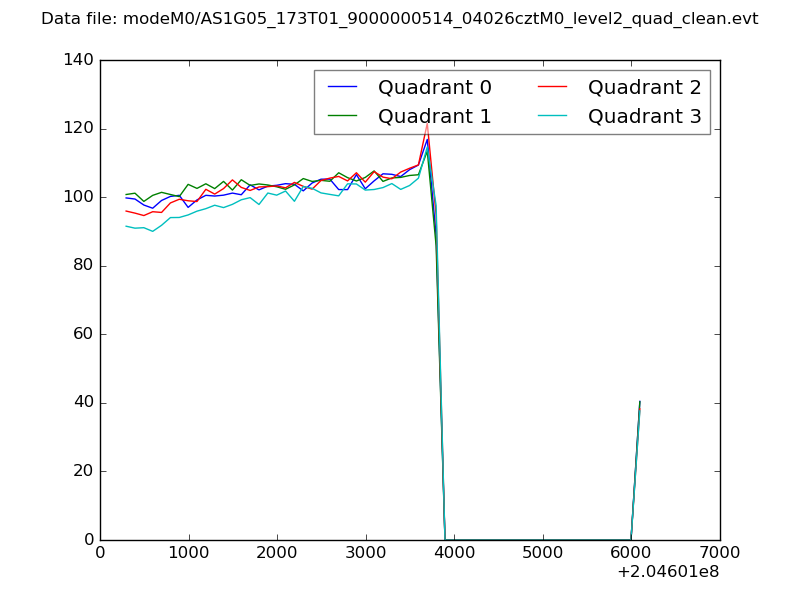 |
|
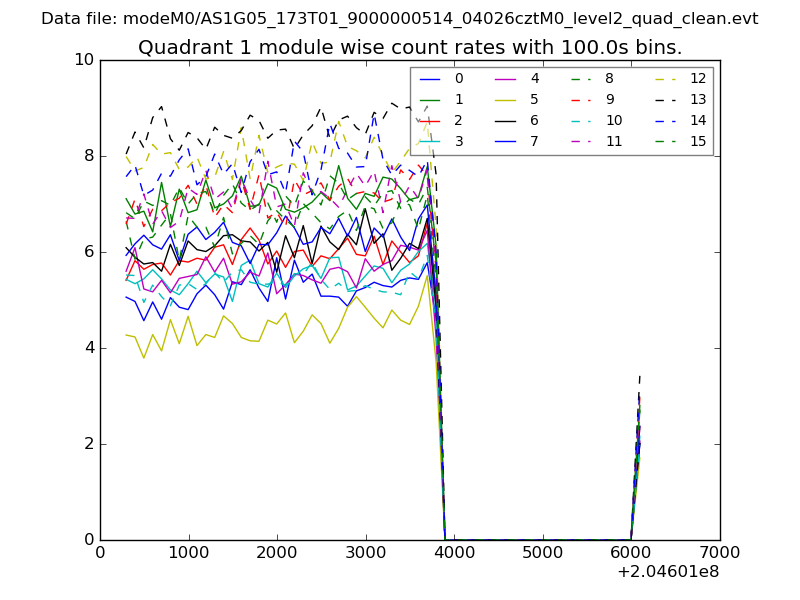
| Module-wise count rates for Quadrant A Data is divided into 100 sec bins |
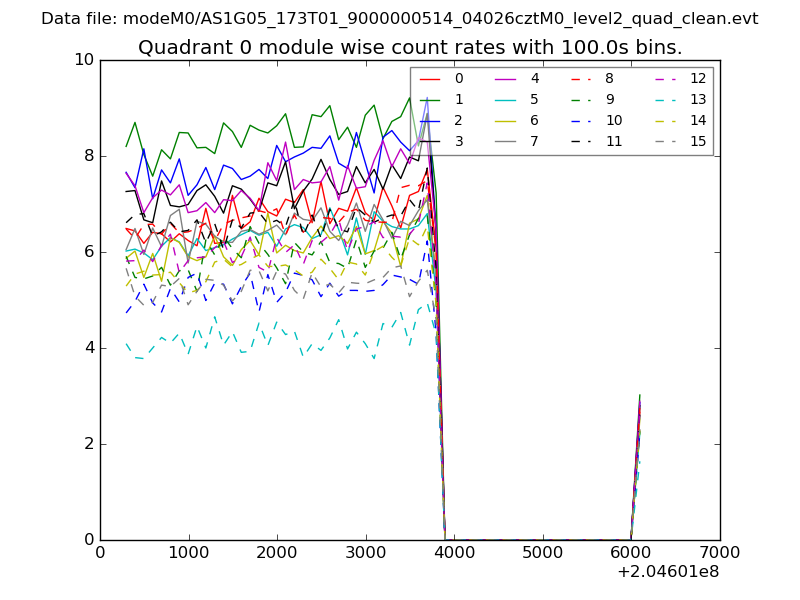 |
 |
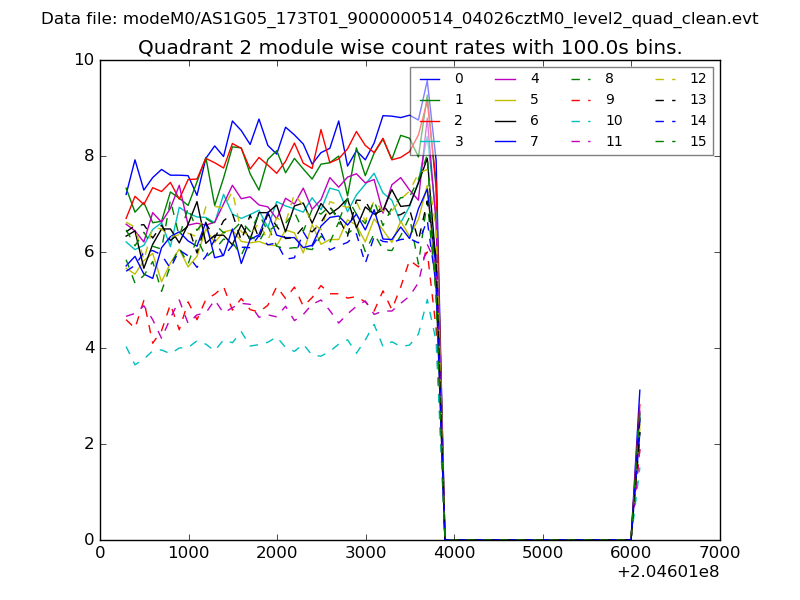
| Module-wise count rates for Quadrant B Data is divided into 100 sec bins |
 |
 |
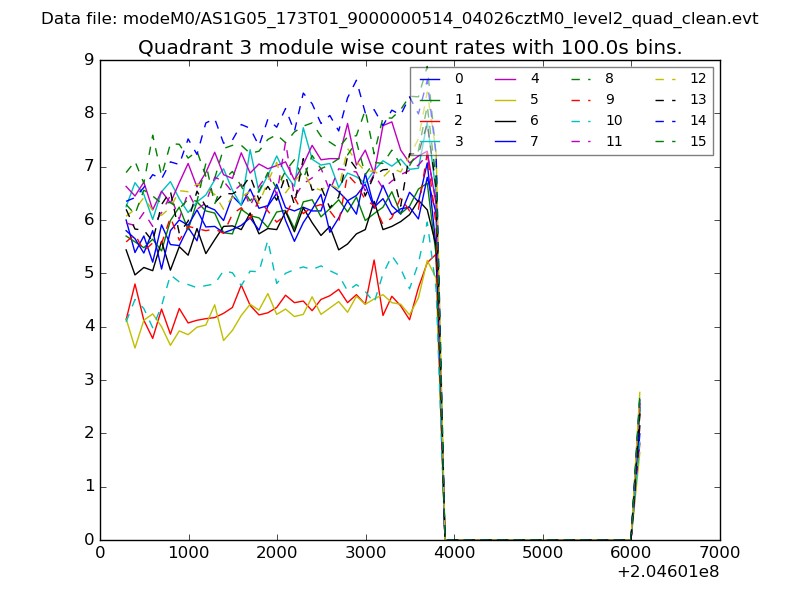
| Module-wise count rates for Quadrant C Data is divided into 100 sec bins |
 |
 |
| Module-wise count rates for Quadrant D Data is divided into 100 sec bins |
 |
 |
| Parameter | Plot |
|---|---|
| CZT HV Monitor | 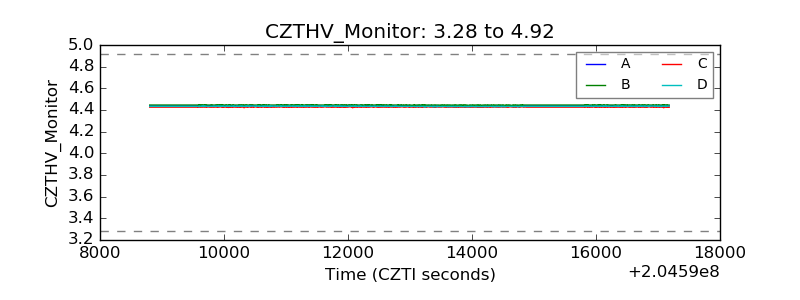 |
| D_VDD | 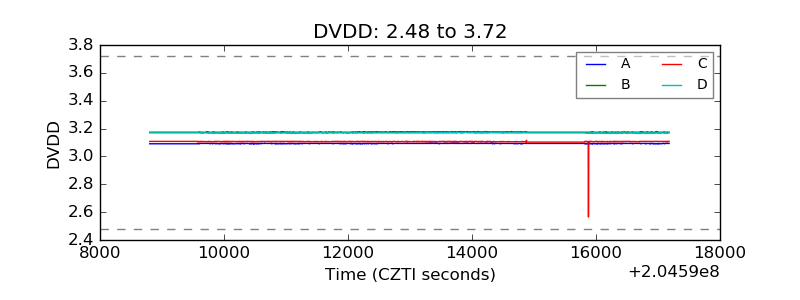 |
| Temperature 1 | 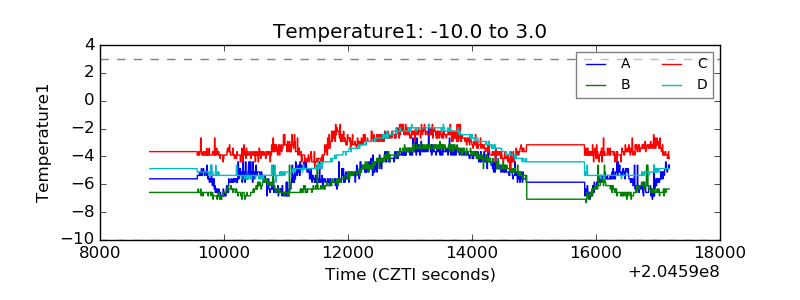 |
| Veto HV Monitor | 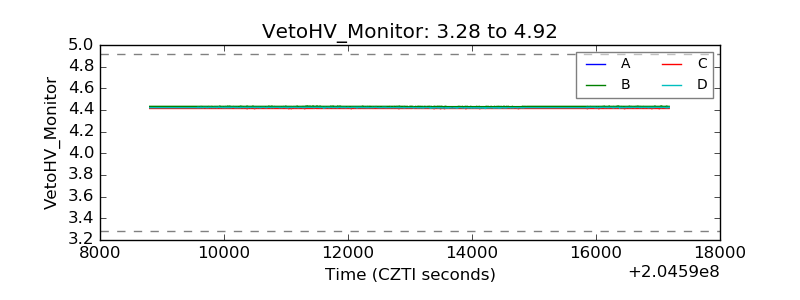 |
| Veto LLD | 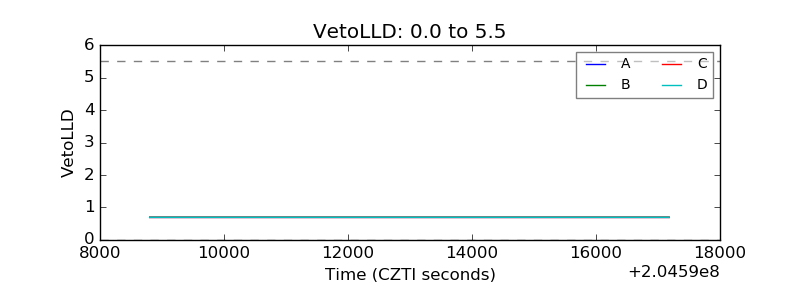 |
| Alpha Counter | 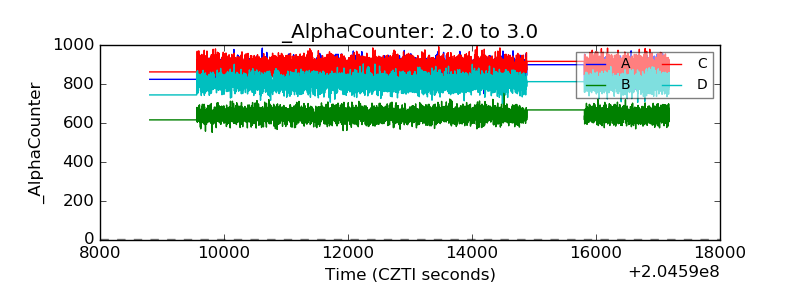 |
| _CPM_Rate | 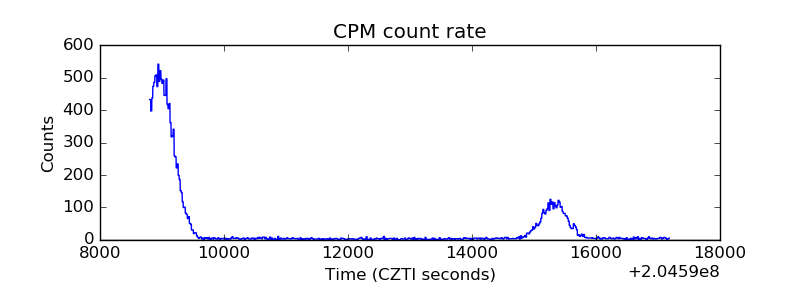 |
| CZT Counter | 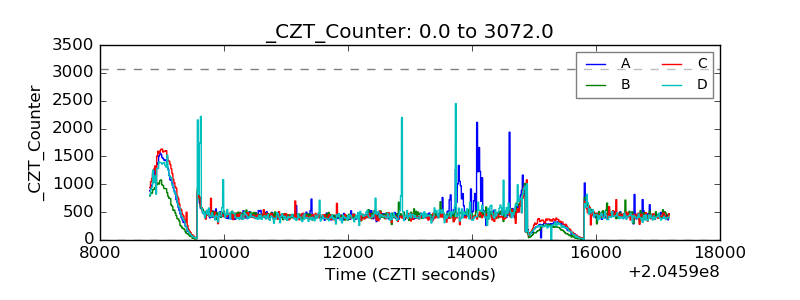 |
| +2.5 Volts monitor |  |
| +5 Volts monitor |  |
| _ROLL_ROT | 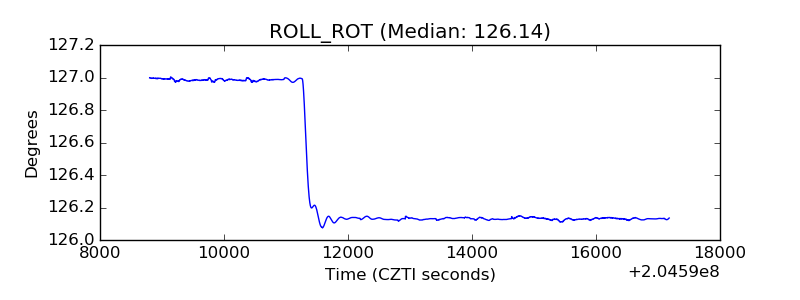 |
| _Roll_DEC | 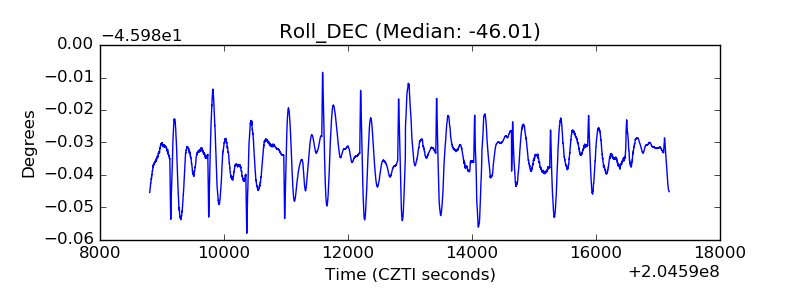 |
| _Roll_RA | 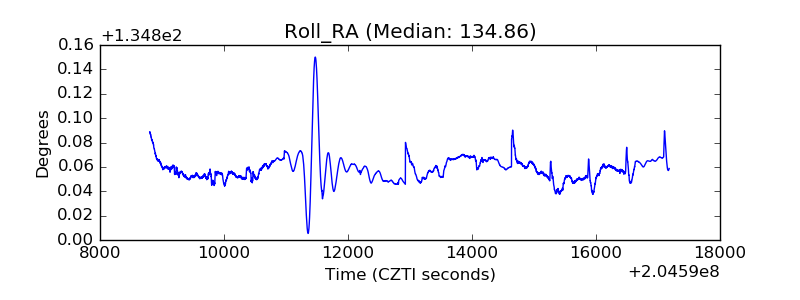 |
| Veto Counter | 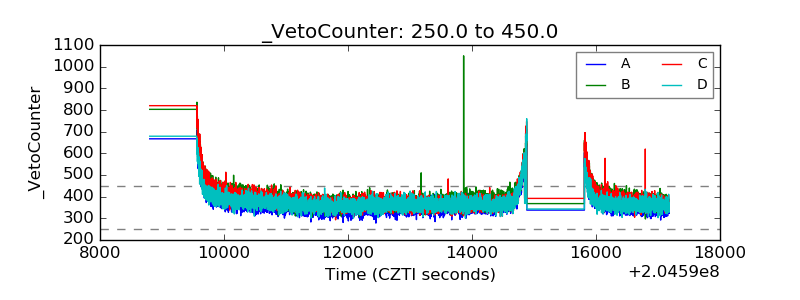 |