| Param | Original file | Final file |
|---|---|---|
| Filename | modeM0/AS1G05_173T01_9000000514_04028cztM0_level2.evt | modeM0/AS1G05_173T01_9000000514_04028cztM0_level2_quad_clean.evt |
| Size (bytes) | 538,977,600 | 79,274,880 |
| Size | 514.0 MB | 75.6 MB |
| Events in quadrant A | 3,837,255 | 468,488 |
| Events in quadrant B | 3,808,772 | 470,562 |
| Events in quadrant C | 3,612,847 | 463,368 |
| Events in quadrant D | 4,524,603 | 446,243 |
| Mode M9 | |||
|---|---|---|---|
| Quadrant | BADHDUFLAG | Total packets | Discarded packets |
| A | 0 | 5 | 0 |
| B | 0 | 5 | 0 |
| C | 0 | 5 | 0 |
| D | 0 | 5 | 0 |
| Mode M0 | |||
|---|---|---|---|
| Quadrant | BADHDUFLAG | Total packets | Discarded packets |
| A | 0 | 17035 | 5 |
| B | 0 | 16800 | 8 |
| C | 0 | 16578 | 2 |
| D | 0 | 19044 | 4 |
| Mode SS | |||
|---|---|---|---|
| Quadrant | BADHDUFLAG | Total packets | Discarded packets |
| A | 0 | 164 | 0 |
| B | 0 | 164 | 0 |
| C | 0 | 164 | 0 |
| D | 0 | 164 | 0 |
| Quadrant | Total seconds | Saturated seconds | Saturation percentage |
|---|---|---|---|
| A | 7932 | 372 | 4.689864% |
| B | 7930 | 334 | 4.211854% |
| C | 7933 | 296 | 3.731249% |
| D | 7932 | 324 | 4.084720% |
Noise dominated data is calculated using 1-second bins in cleaned event files. If a bin has >2000 counts, and if more than 50% of those come from <1% of pixels, then it is considered to be noise-dominated and hence unusable.
| Quadrant | # 1 sec bins | Bins with >0 counts | Bins with >2000 counts | High rate bins dominated by noise | Noise dominated (total time) | Noise dominated (detector-on time) | Marked lightcurve |
|---|---|---|---|---|---|---|---|
| A | 8483 | 7936 | 16 | 16 | 0.19% | 0.20% | 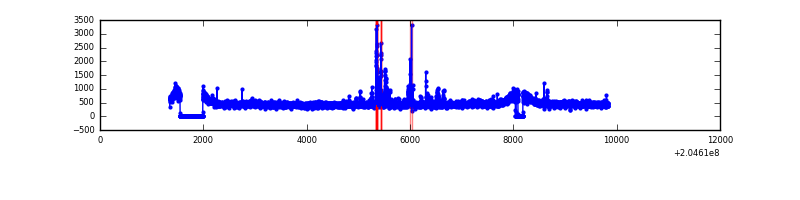 |
| B | 8483 | 7935 | 5 | 5 | 0.06% | 0.06% | 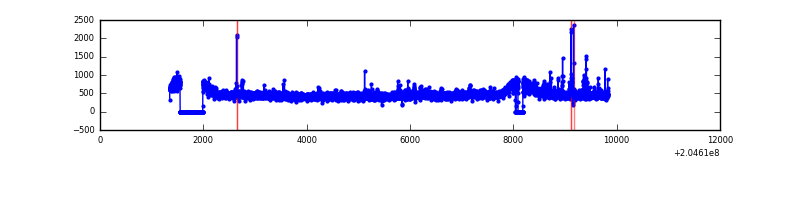 |
| C | 8483 | 7935 | 0 | 0 | 0.00% | 0.00% | 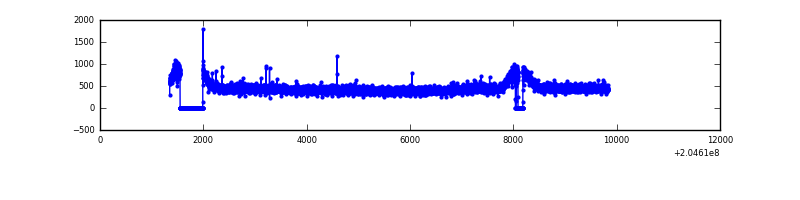 |
| D | 8483 | 7935 | 35 | 35 | 0.41% | 0.44% | 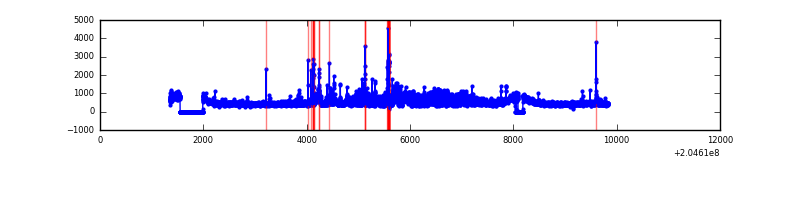 |
Top three noisy pixels from each quadrant. If the there are fewer than three noisy pixels in the level2.evt file, extra rows are filled as -1
| Pixel properties | Quadrant properties | ||||||
|---|---|---|---|---|---|---|---|
| Quadrant | DetID | PixID | Counts | Sigma | Mean | Median | Sigma |
| A | 0 | 50 | 141939 | 724.0 | 938 | 915 | 194.8 |
| A | 0 | 118 | 34347 | 171.64 | 938 | 915 | 194.8 |
| A | 15 | 234 | 20146 | 98.73 | 938 | 915 | 194.8 |
| B | 4 | 81 | 78943 | 424.77 | 948 | 921 | 183.7 |
| B | 15 | 204 | 31921 | 168.77 | 948 | 921 | 183.7 |
| B | 12 | 111 | 16279 | 83.61 | 948 | 921 | 183.7 |
| C | 13 | 61 | 7688 | 31.66 | 918 | 920 | 213.8 |
| C | 8 | 128 | 7577 | 31.14 | 918 | 920 | 213.8 |
| C | 12 | 4 | 6805 | 27.53 | 918 | 920 | 213.8 |
| D | 11 | 132 | 749011 | 3372.46 | 910 | 880 | 221.8 |
| D | 2 | 232 | 92940 | 414.99 | 910 | 880 | 221.8 |
| D | 2 | 63 | 71622 | 318.89 | 910 | 880 | 221.8 |
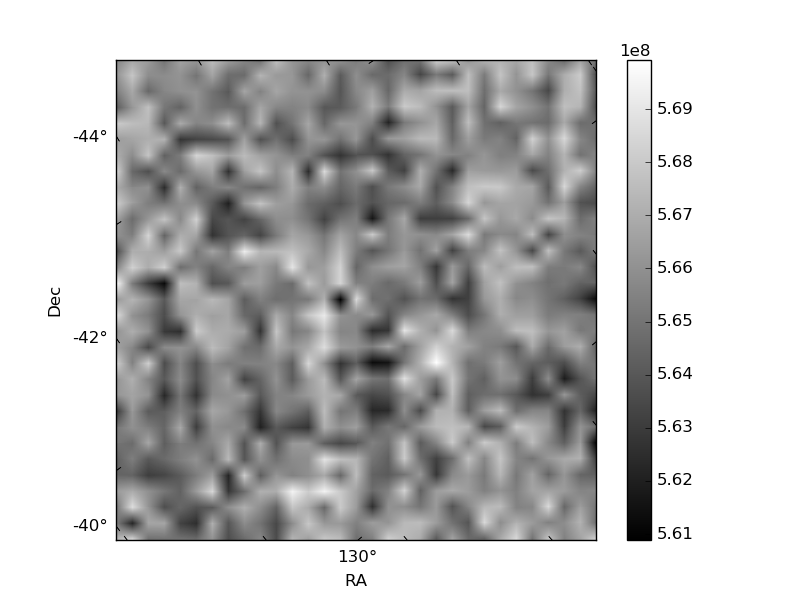
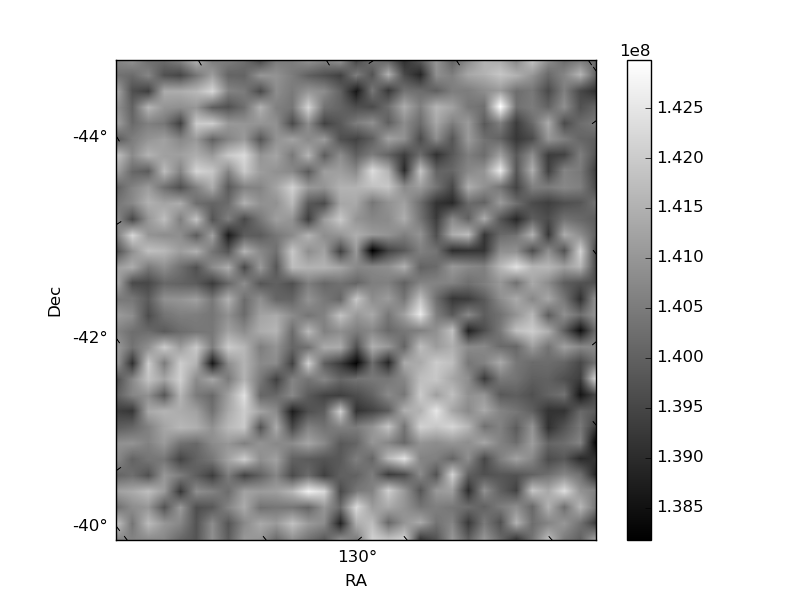
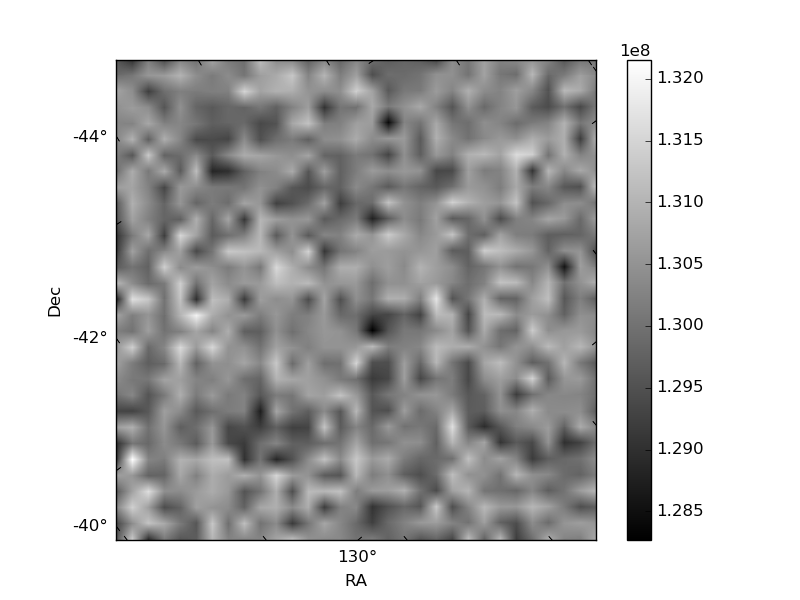
Histogram calculated using DETX and DETY for each event in the final _common_clean file
| Quadrant A | 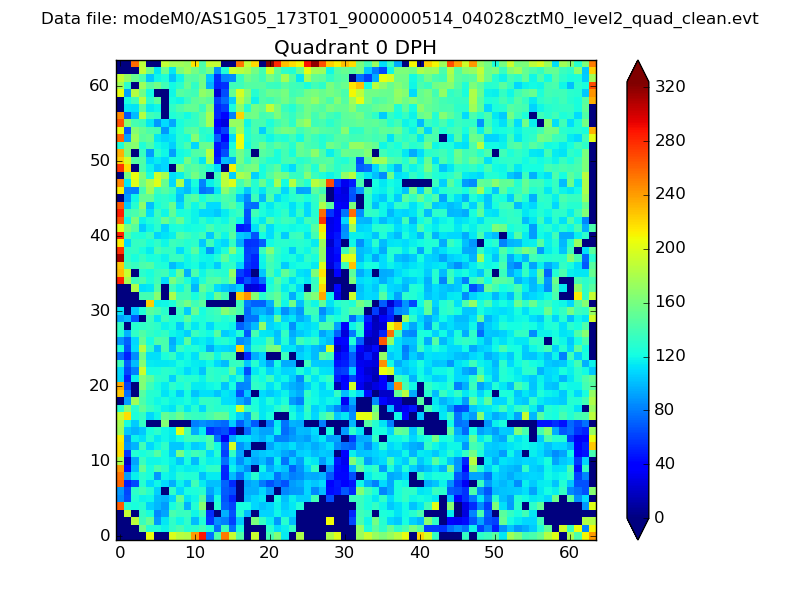 |
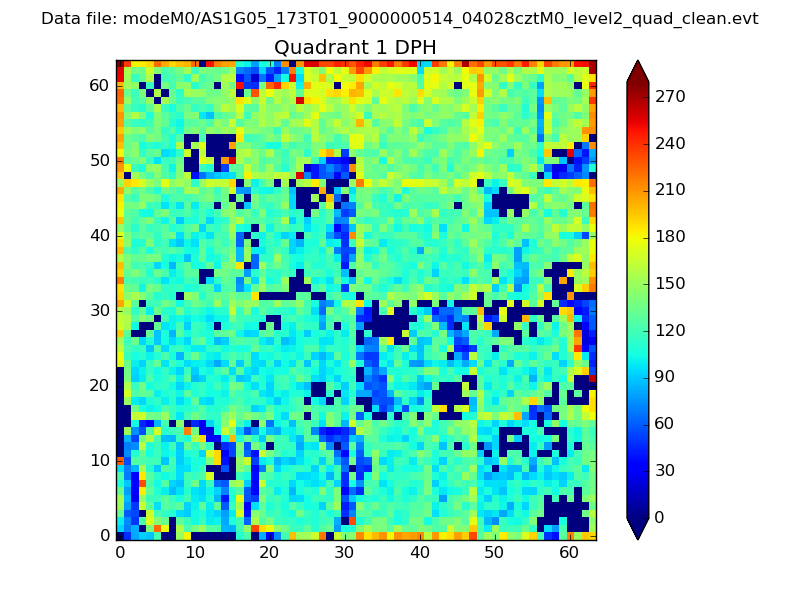 |
Quadrant B |
|---|---|---|---|
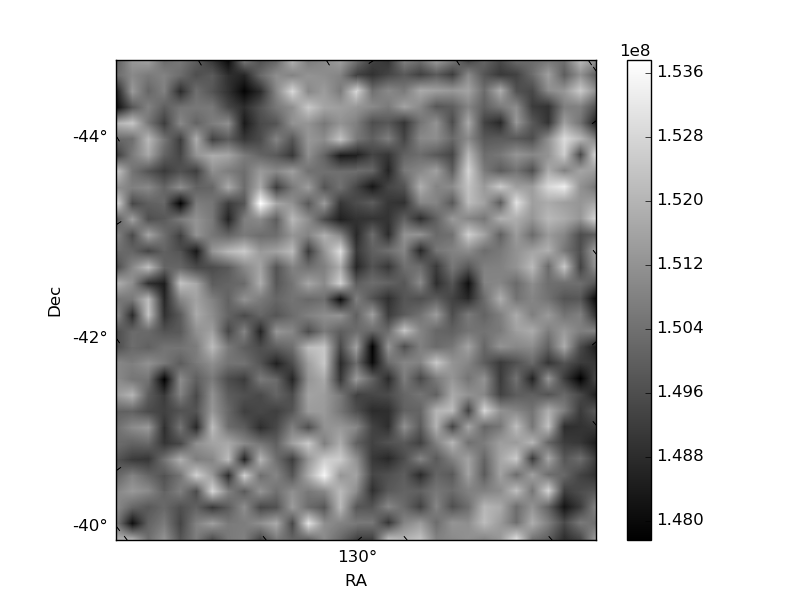
| Quadrant D | 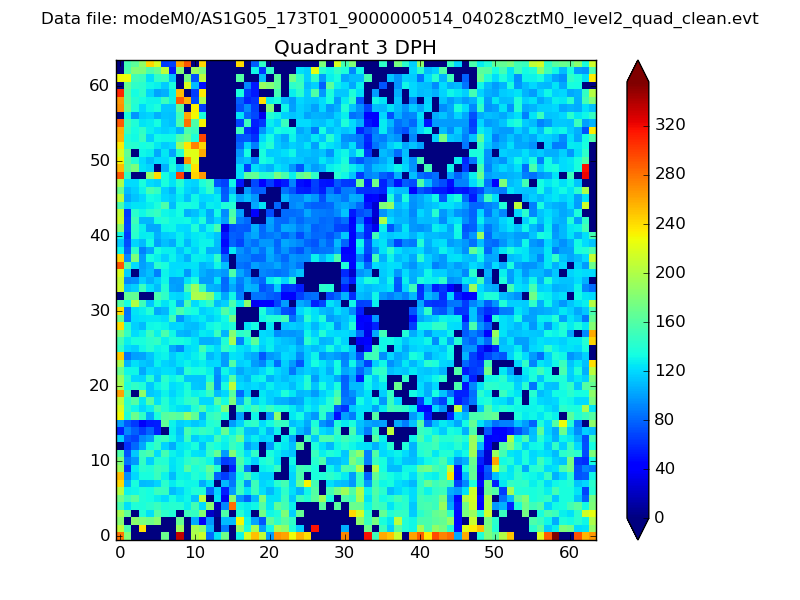 |
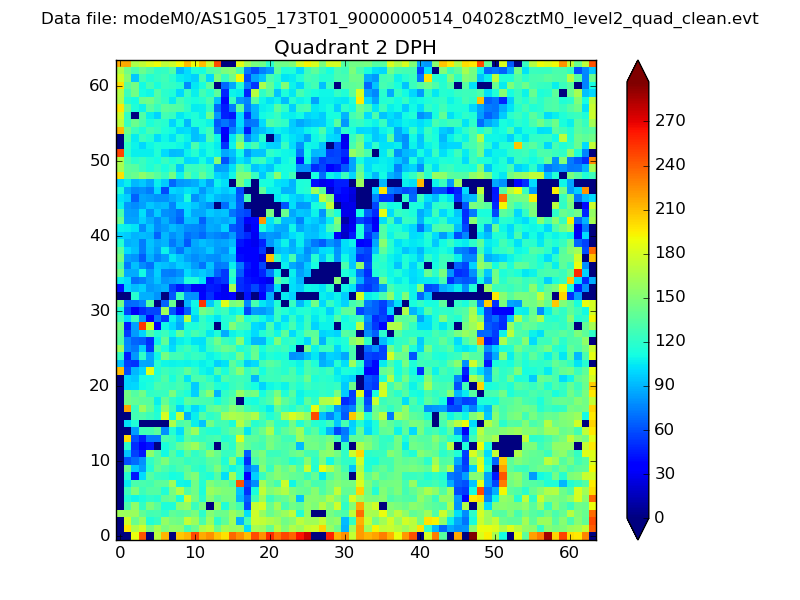 |
Quadrant C |
| Plot type | Count rate plots | Images |
|---|---|---|
| Comparison with Poisson distribution Blue bars denote a histogram of data divided into 1 sec bins. Red curve is a Poisson curve with rate = median count rate of data. |
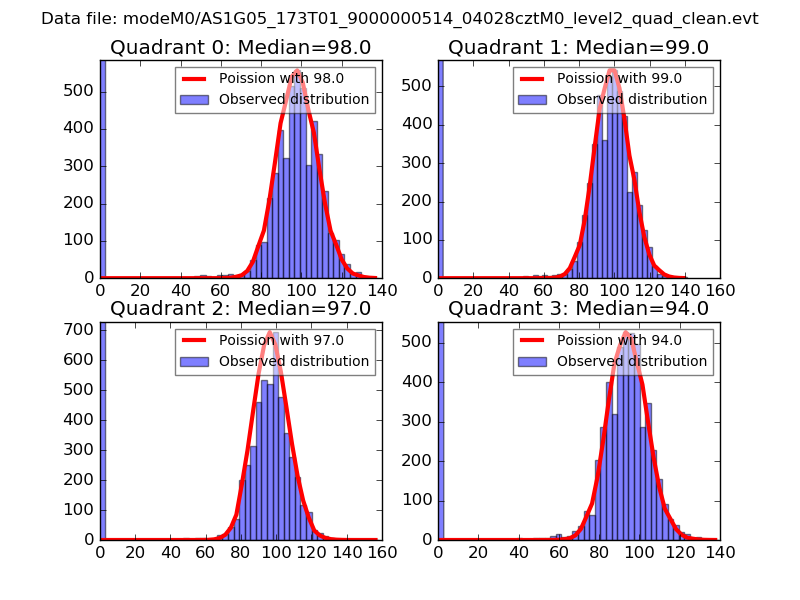 |
 |
| Quadrant-wise count rates Data is divided into 100 sec bins |
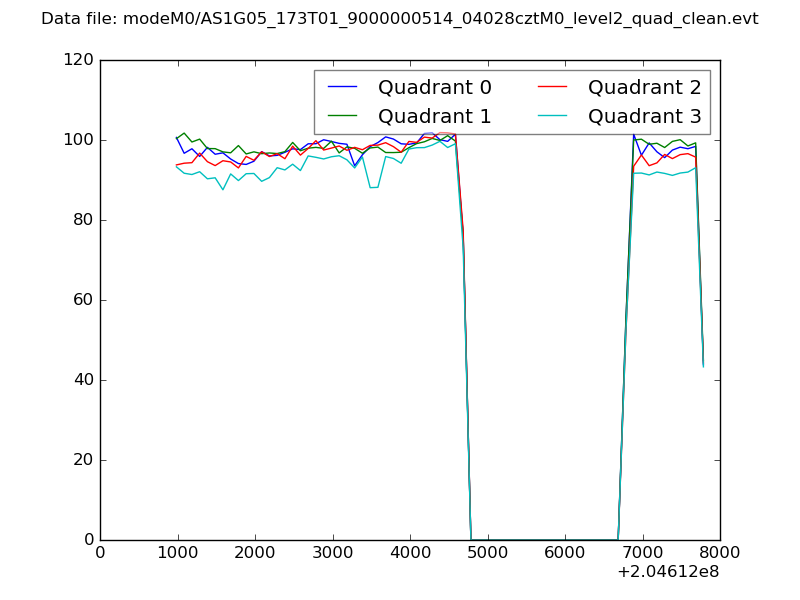 |
|
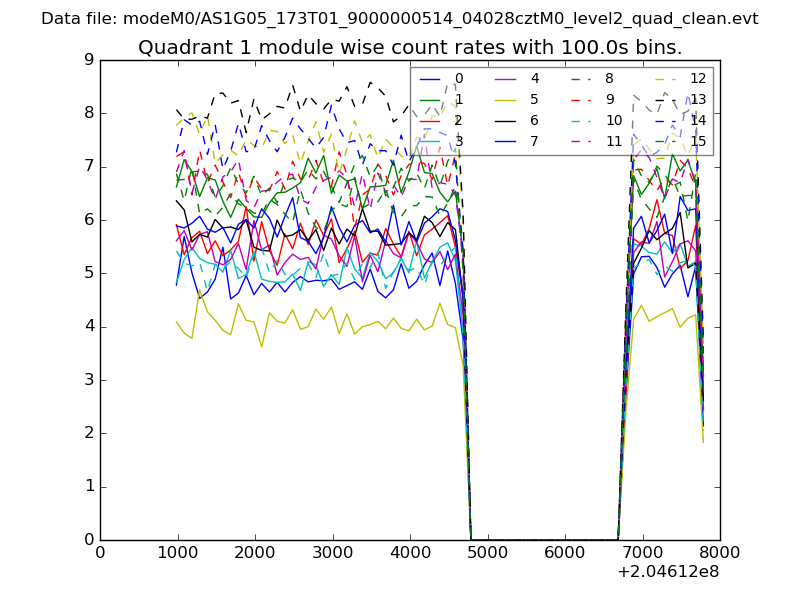
| Module-wise count rates for Quadrant A Data is divided into 100 sec bins |
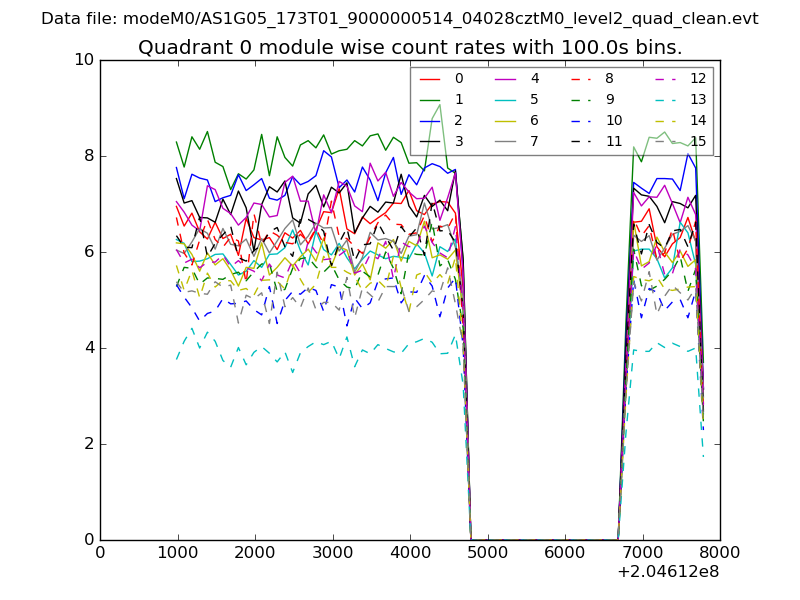 |
 |
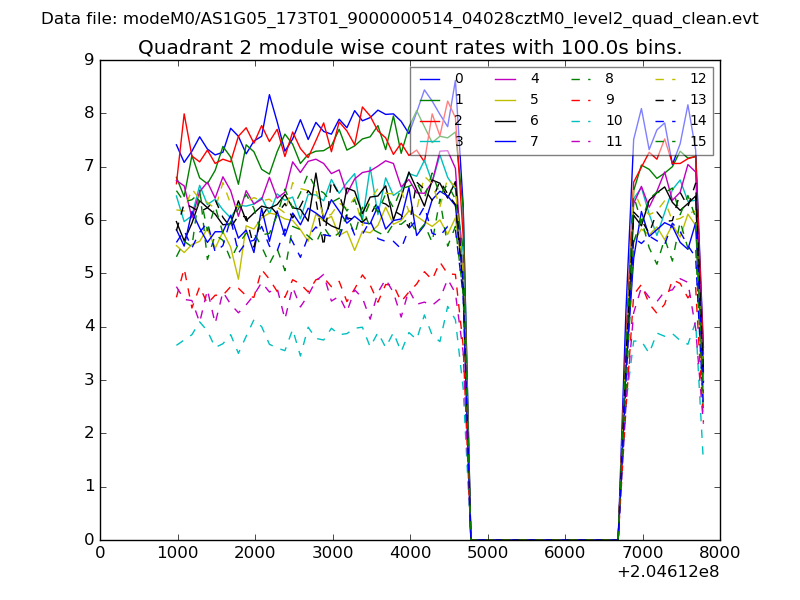
| Module-wise count rates for Quadrant B Data is divided into 100 sec bins |
 |
 |
| Module-wise count rates for Quadrant C Data is divided into 100 sec bins |
 |
 |
| Module-wise count rates for Quadrant D Data is divided into 100 sec bins |
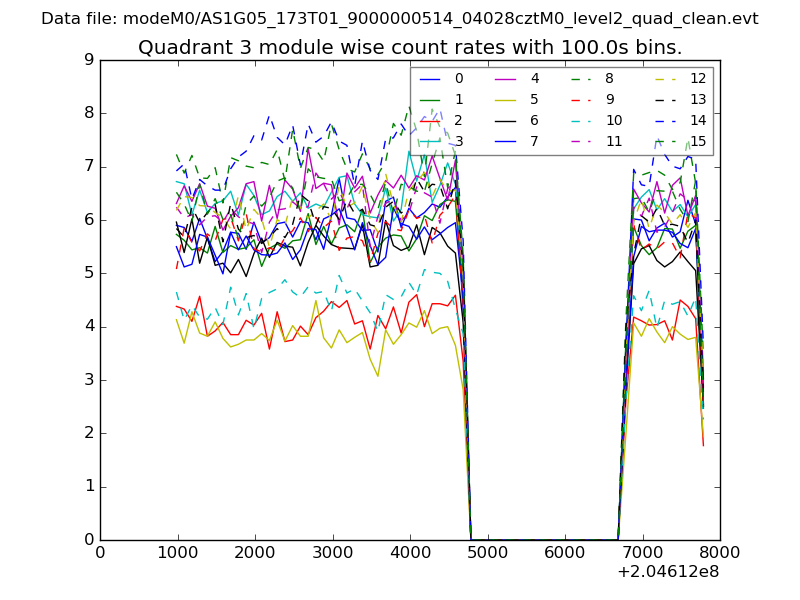 |
 |
| Parameter | Plot |
|---|---|
| CZT HV Monitor | 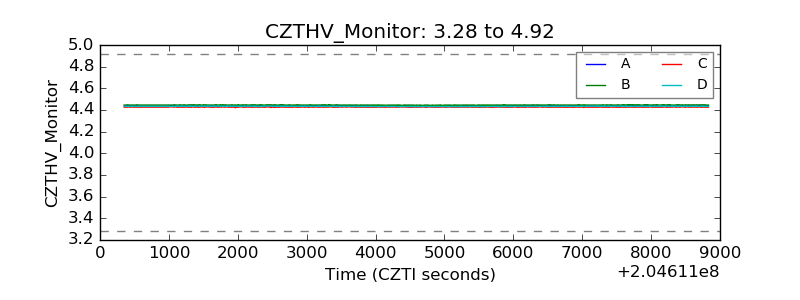 |
| D_VDD | 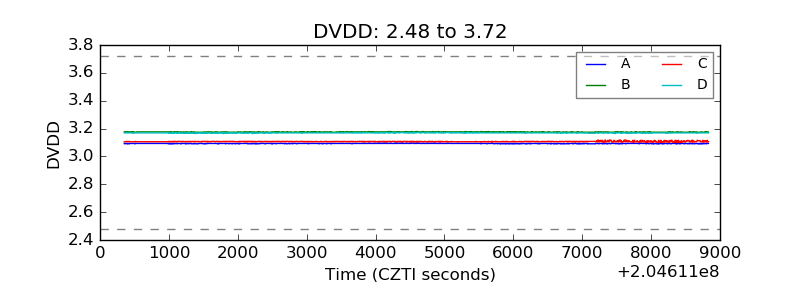 |
| Temperature 1 | 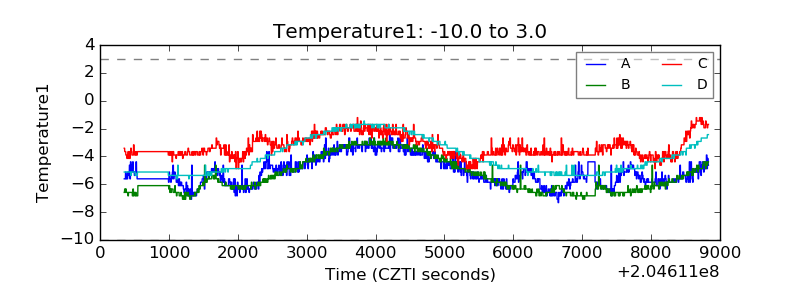 |
| Veto HV Monitor | 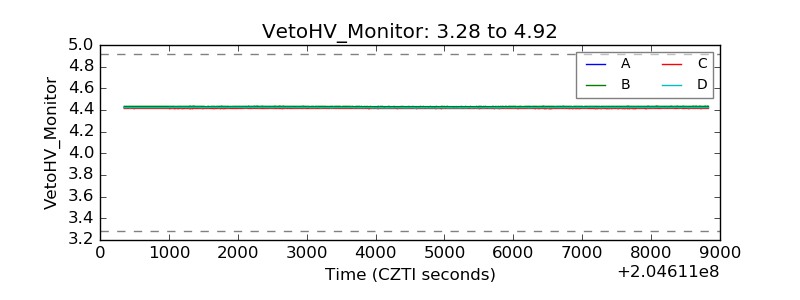 |
| Veto LLD | 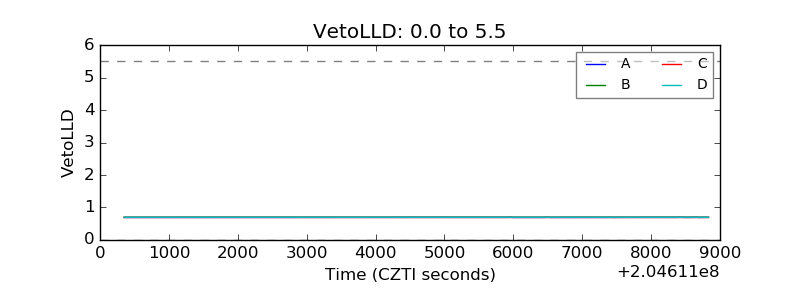 |
| Alpha Counter | 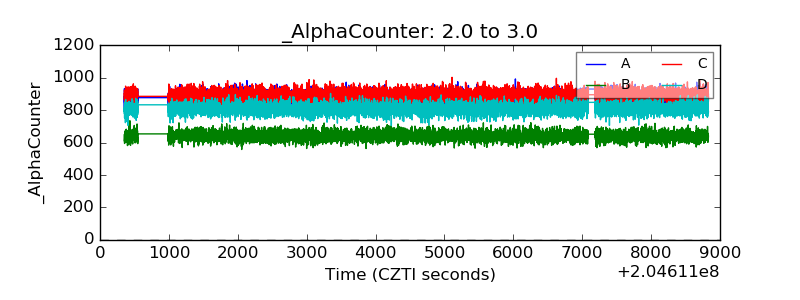 |
| _CPM_Rate | 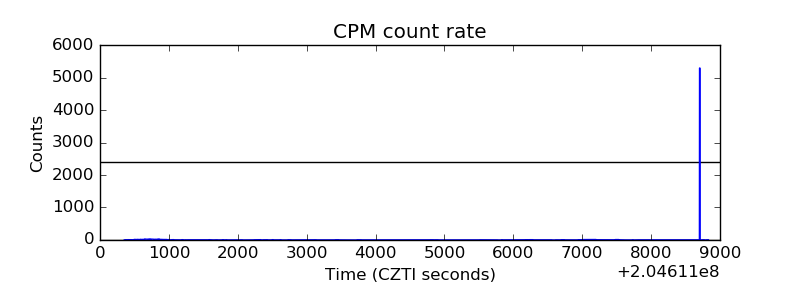 |
| CZT Counter | 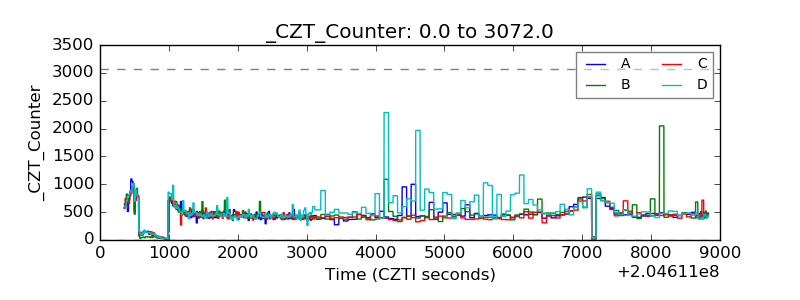 |
| +2.5 Volts monitor |  |
| +5 Volts monitor | 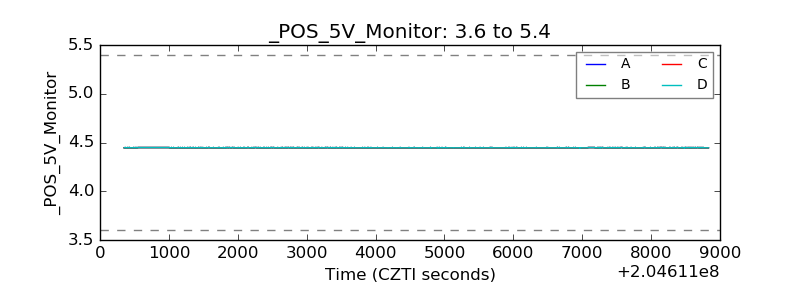 |
| _ROLL_ROT | 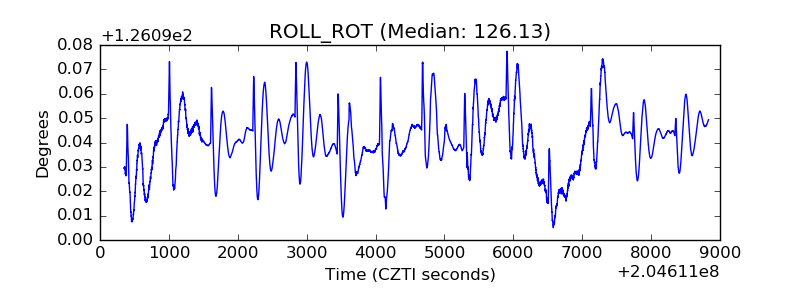 |
| _Roll_DEC | 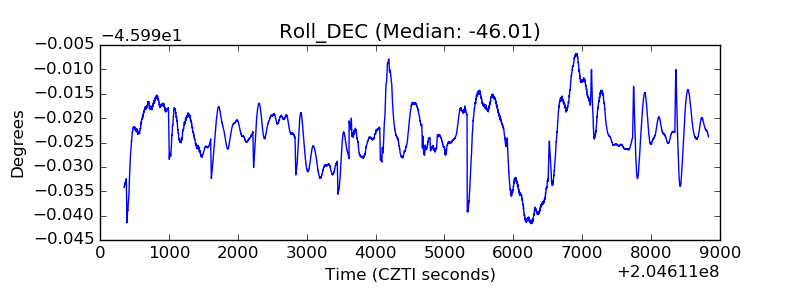 |
| _Roll_RA | 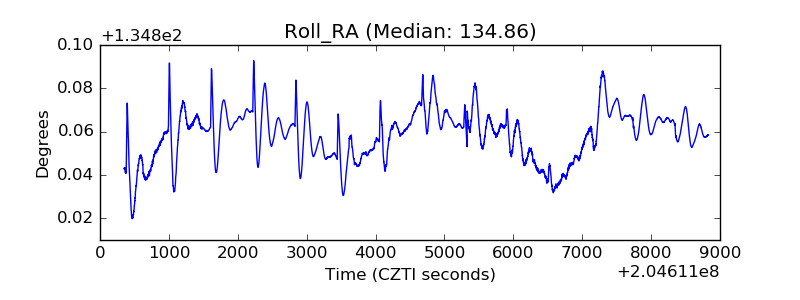 |
| Veto Counter | 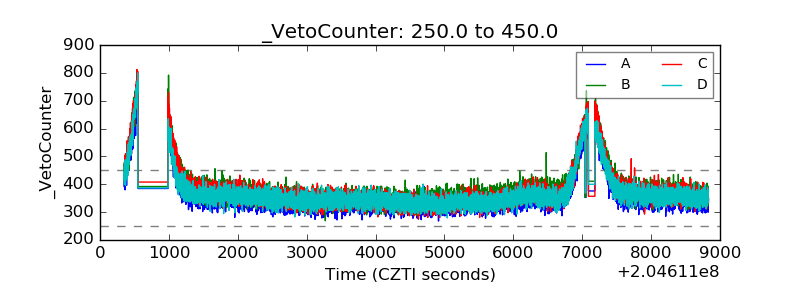 |