| Param | Original file | Final file |
|---|---|---|
| Filename | modeM0/AS1G05_173T01_9000000514_04032cztM0_level2.evt | modeM0/AS1G05_173T01_9000000514_04032cztM0_level2_quad_clean.evt |
| Size (bytes) | 643,072,320 | 111,565,440 |
| Size | 613.3 MB | 106.4 MB |
| Events in quadrant A | 4,828,761 | 681,677 |
| Events in quadrant B | 4,459,973 | 692,848 |
| Events in quadrant C | 3,942,635 | 693,109 |
| Events in quadrant D | 5,611,700 | 664,100 |
| Mode M9 | |||
|---|---|---|---|
| Quadrant | BADHDUFLAG | Total packets | Discarded packets |
| A | 0 | 4 | 0 |
| B | 0 | 4 | 0 |
| C | 0 | 4 | 0 |
| D | 0 | 4 | 0 |
| Mode M0 | |||
|---|---|---|---|
| Quadrant | BADHDUFLAG | Total packets | Discarded packets |
| A | 0 | 20947 | 1 |
| B | 0 | 19589 | 1 |
| C | 0 | 18877 | 1 |
| D | 0 | 23260 | 1 |
| Mode SS | |||
|---|---|---|---|
| Quadrant | BADHDUFLAG | Total packets | Discarded packets |
| A | 0 | 188 | 0 |
| B | 0 | 188 | 0 |
| C | 0 | 188 | 0 |
| D | 0 | 188 | 0 |
| Quadrant | Total seconds | Saturated seconds | Saturation percentage |
|---|---|---|---|
| A | 9327 | 354 | 3.795433% |
| B | 9327 | 72 | 0.771952% |
| C | 9327 | 25 | 0.268039% |
| D | 9327 | 172 | 1.844109% |
Noise dominated data is calculated using 1-second bins in cleaned event files. If a bin has >2000 counts, and if more than 50% of those come from <1% of pixels, then it is considered to be noise-dominated and hence unusable.
| Quadrant | # 1 sec bins | Bins with >0 counts | Bins with >2000 counts | High rate bins dominated by noise | Noise dominated (total time) | Noise dominated (detector-on time) | Marked lightcurve |
|---|---|---|---|---|---|---|---|
| A | 9767 | 9328 | 124 | 124 | 1.27% | 1.33% |  |
| B | 9767 | 9328 | 13 | 13 | 0.13% | 0.14% |  |
| C | 9767 | 9328 | 1 | 1 | 0.01% | 0.01% | 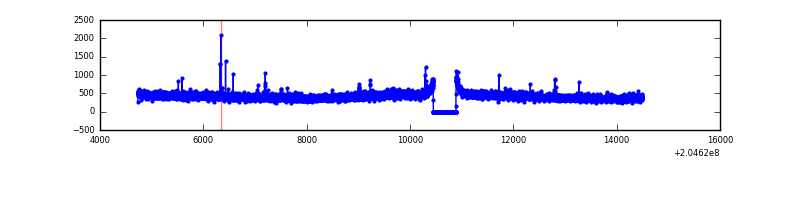 |
| D | 9767 | 9328 | 162 | 162 | 1.66% | 1.74% |  |
Top three noisy pixels from each quadrant. If the there are fewer than three noisy pixels in the level2.evt file, extra rows are filled as -1
| Pixel properties | Quadrant properties | ||||||
|---|---|---|---|---|---|---|---|
| Quadrant | DetID | PixID | Counts | Sigma | Mean | Median | Sigma |
| A | 0 | 50 | 403420 | 1895.22 | 1026 | 1004 | 212.3 |
| A | 14 | 111 | 256590 | 1203.71 | 1026 | 1004 | 212.3 |
| A | 0 | 118 | 114482 | 534.44 | 1026 | 1004 | 212.3 |
| B | 15 | 204 | 163048 | 807.89 | 1041 | 1016 | 200.6 |
| B | 10 | 16 | 146194 | 723.85 | 1041 | 1016 | 200.6 |
| B | 4 | 81 | 75410 | 370.93 | 1041 | 1016 | 200.6 |
| C | 9 | 144 | 33621 | 139.88 | 1000 | 1003 | 233.2 |
| C | 13 | 61 | 8174 | 30.75 | 1000 | 1003 | 233.2 |
| C | 12 | 4 | 3944 | 12.61 | 1000 | 1003 | 233.2 |
| D | 11 | 132 | 808636 | 3352.63 | 1001 | 971 | 240.9 |
| D | 2 | 33 | 698856 | 2896.93 | 1001 | 971 | 240.9 |
| D | 2 | 232 | 113692 | 467.9 | 1001 | 971 | 240.9 |
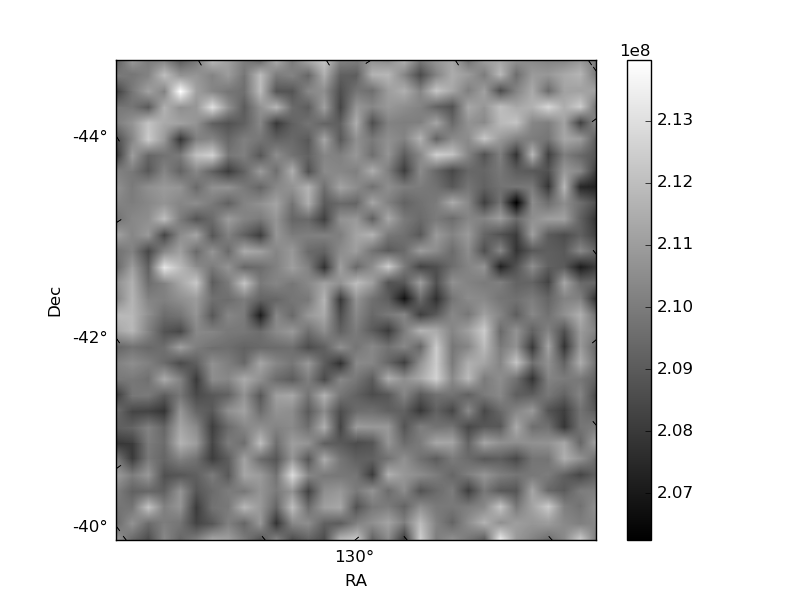
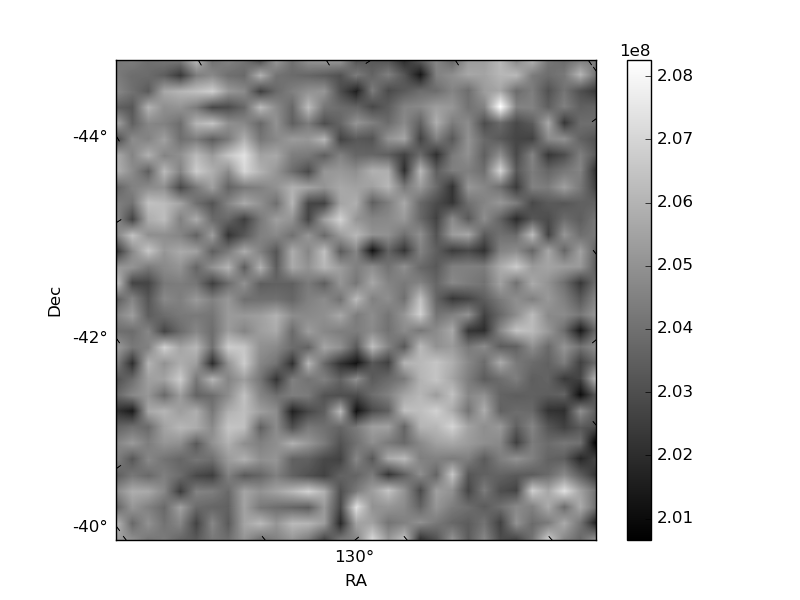
Histogram calculated using DETX and DETY for each event in the final _common_clean file
| Quadrant A | 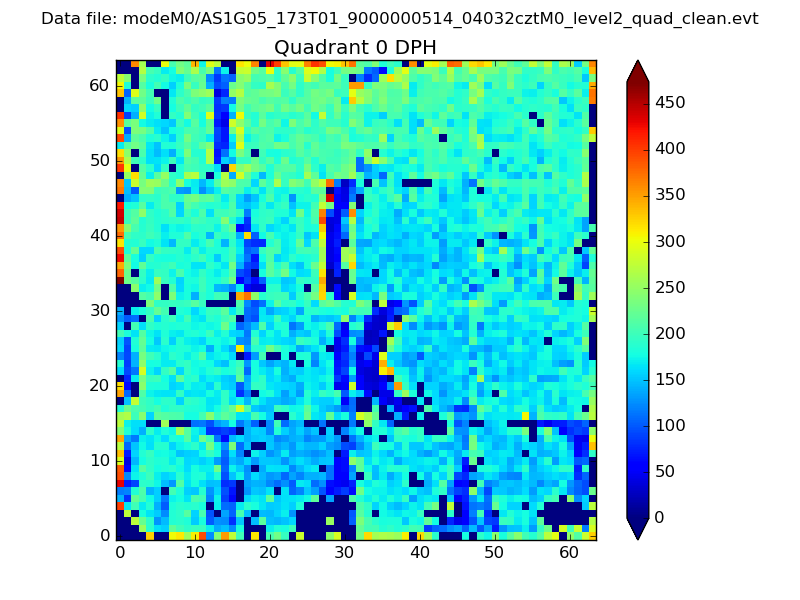 |
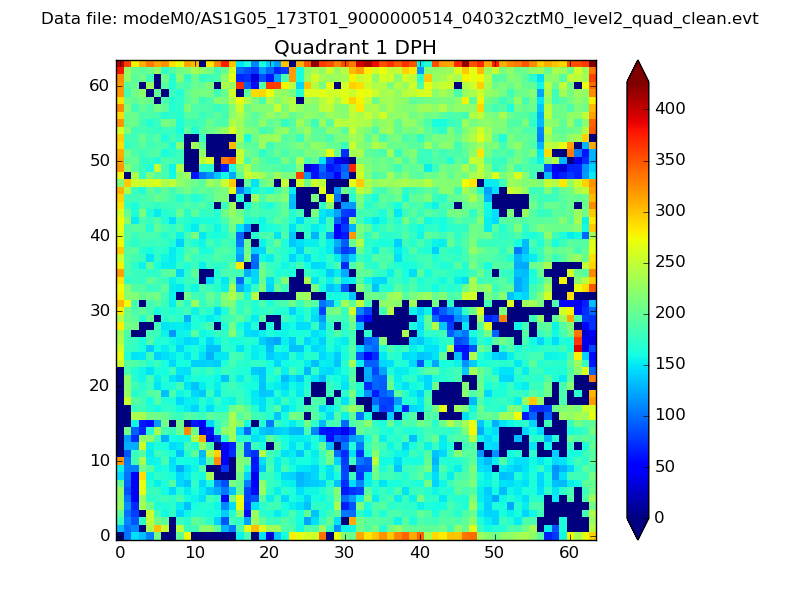 |
Quadrant B |
|---|---|---|---|
| Quadrant D | 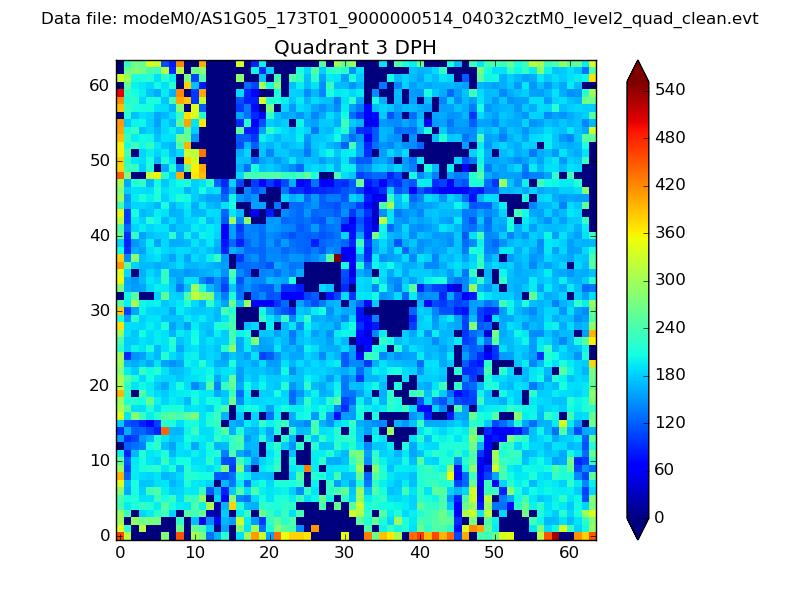 |
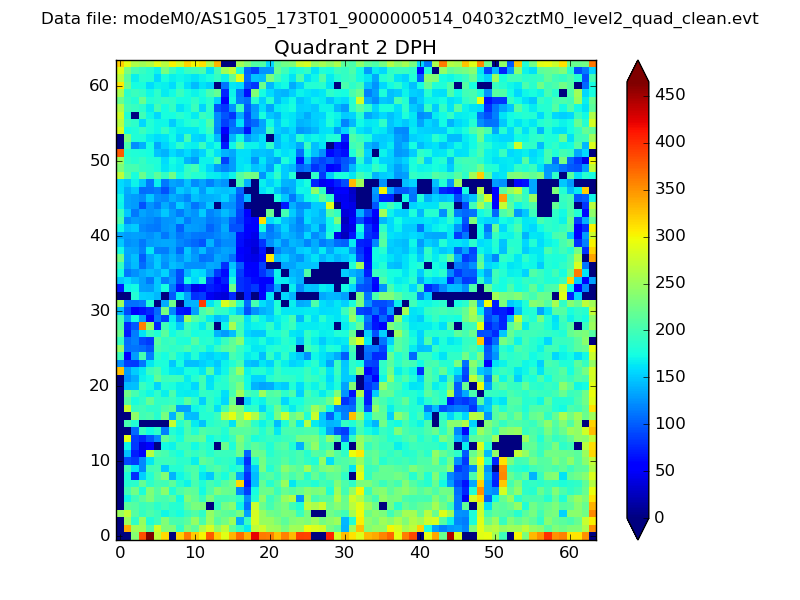 |
Quadrant C |
| Plot type | Count rate plots | Images |
|---|---|---|
| Comparison with Poisson distribution Blue bars denote a histogram of data divided into 1 sec bins. Red curve is a Poisson curve with rate = median count rate of data. |
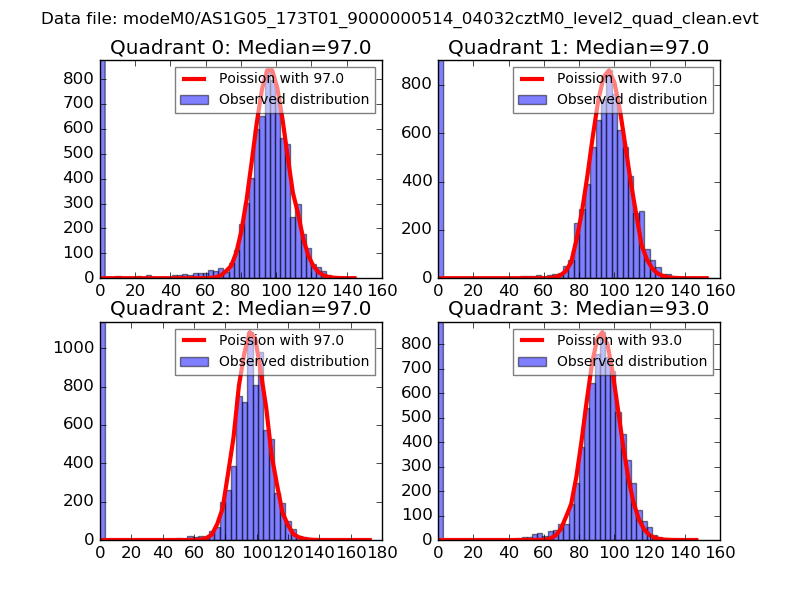 |
 |
| Quadrant-wise count rates Data is divided into 100 sec bins |
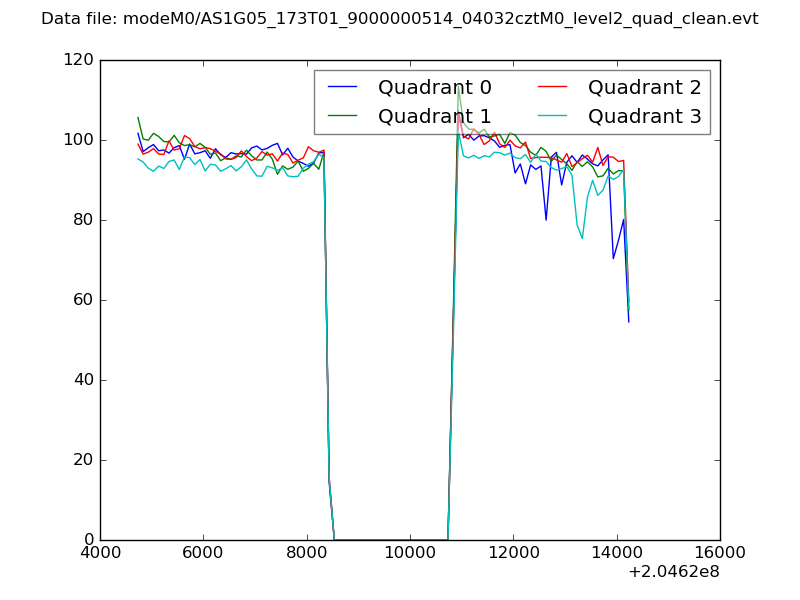 |
|
| Module-wise count rates for Quadrant A Data is divided into 100 sec bins |
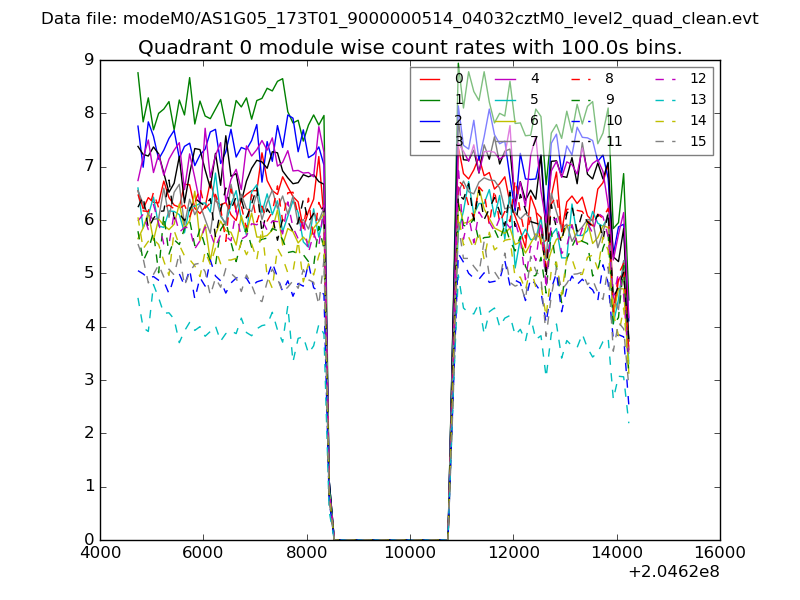 |
 |
| Module-wise count rates for Quadrant B Data is divided into 100 sec bins |
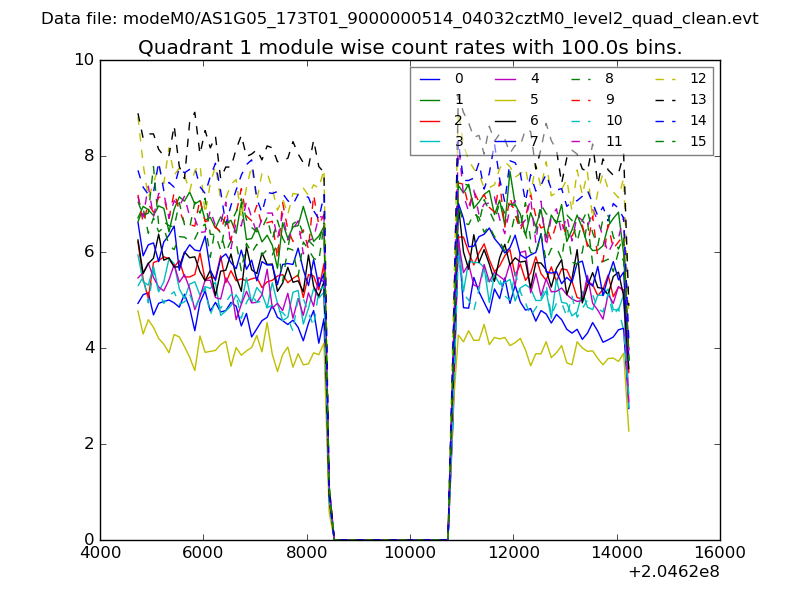 |
 |
| Module-wise count rates for Quadrant C Data is divided into 100 sec bins |
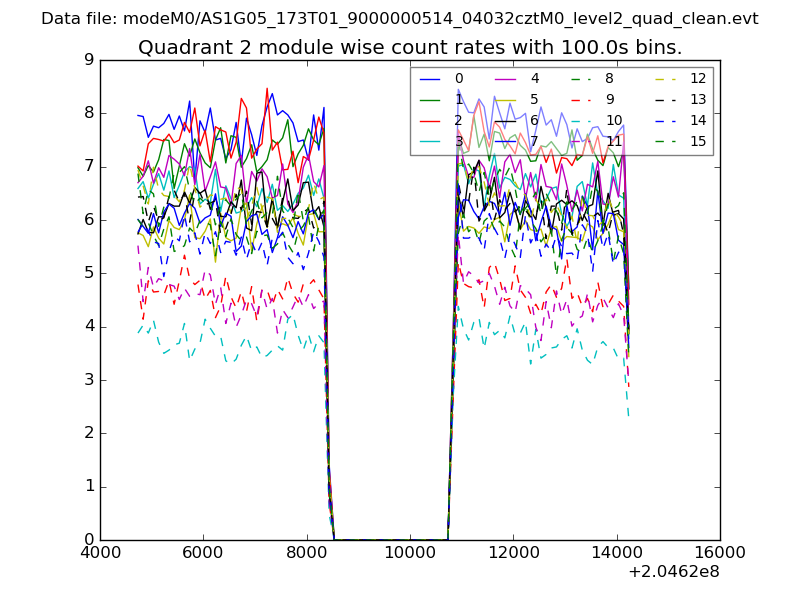 |
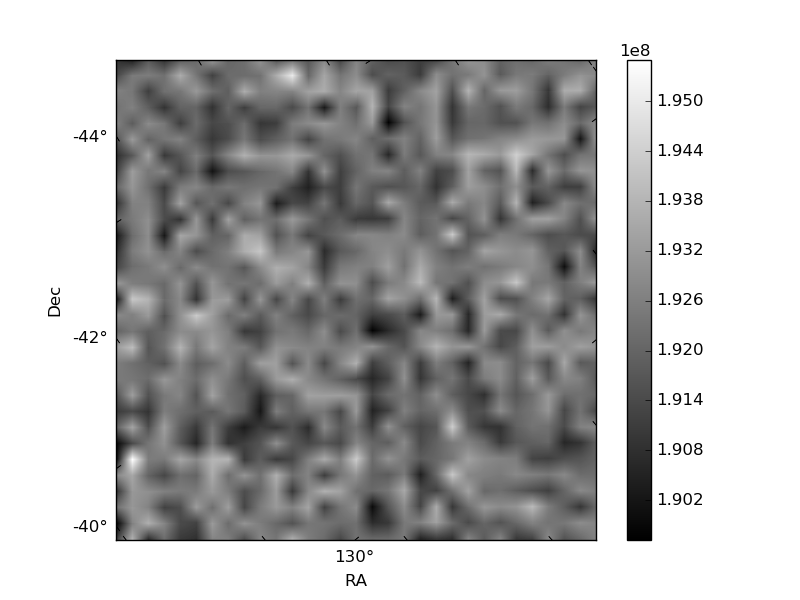 |
| Module-wise count rates for Quadrant D Data is divided into 100 sec bins |
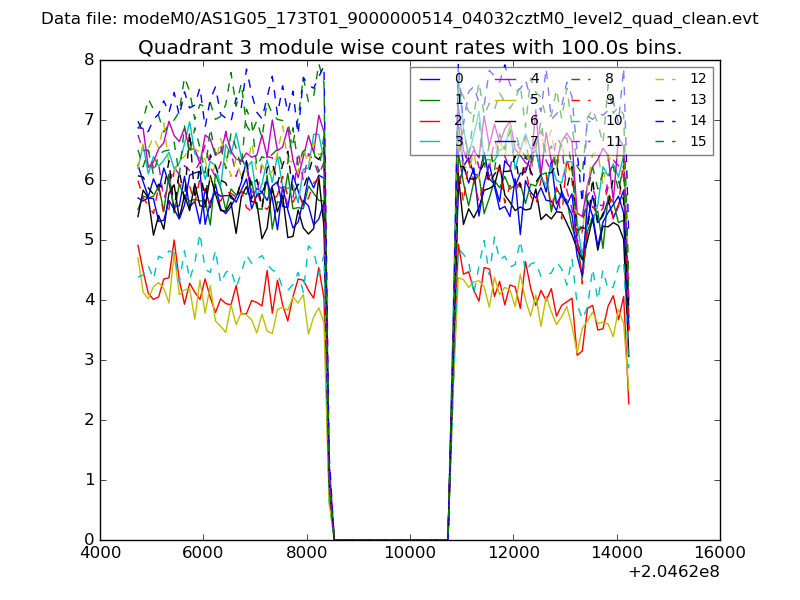 |
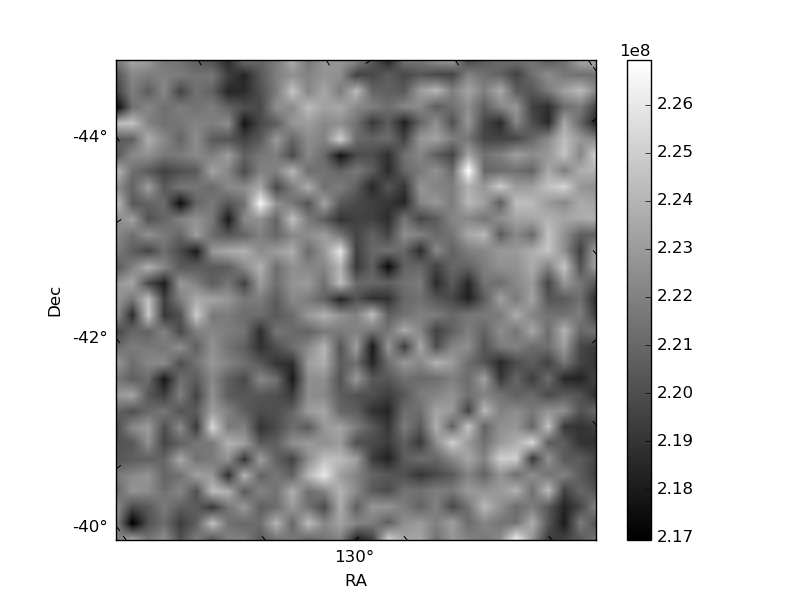 |
| Parameter | Plot |
|---|---|
| CZT HV Monitor | 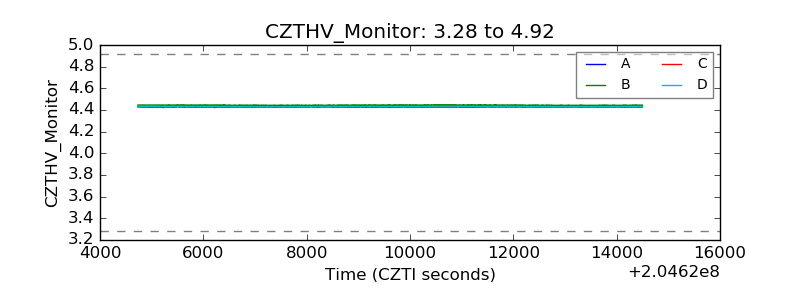 |
| D_VDD | 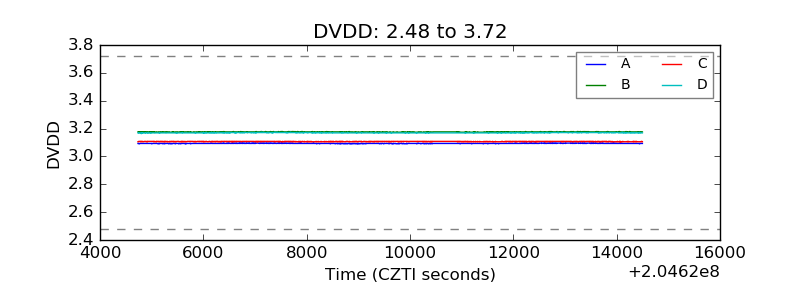 |
| Temperature 1 | 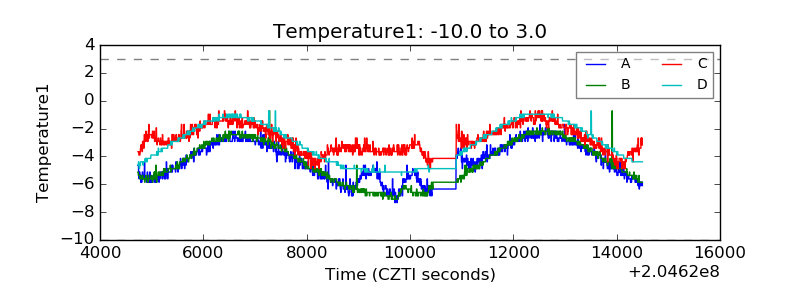 |
| Veto HV Monitor | 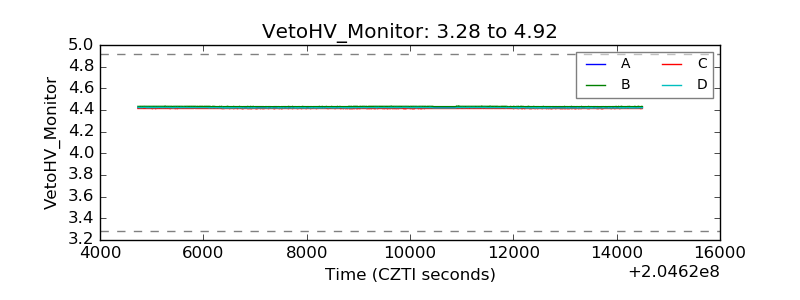 |
| Veto LLD | 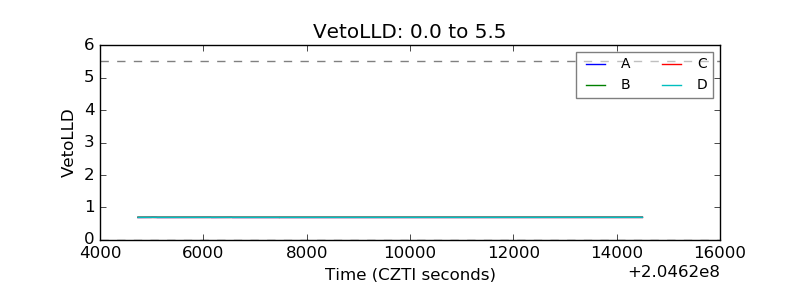 |
| Alpha Counter | 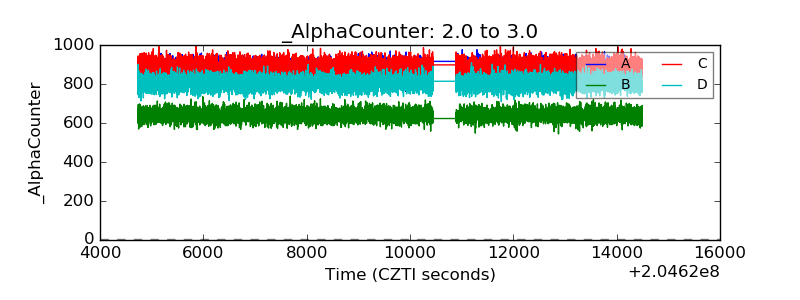 |
| _CPM_Rate | 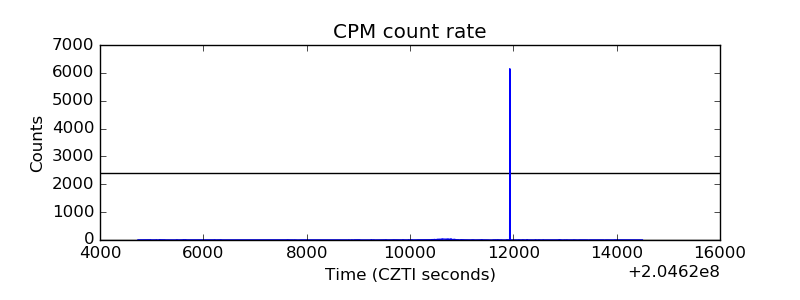 |
| CZT Counter | 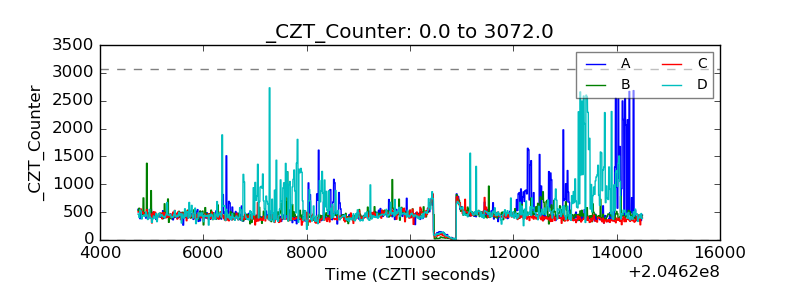 |
| +2.5 Volts monitor |  |
| +5 Volts monitor |  |
| _ROLL_ROT | 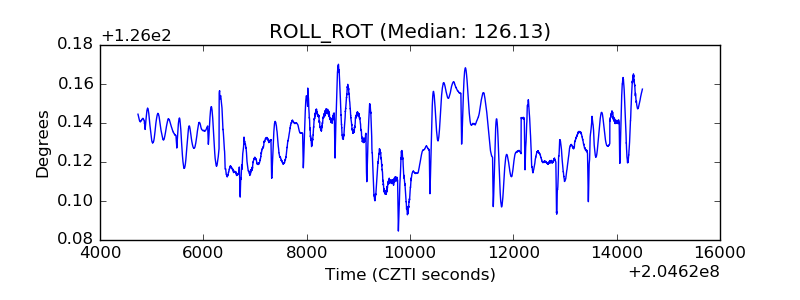 |
| _Roll_DEC | 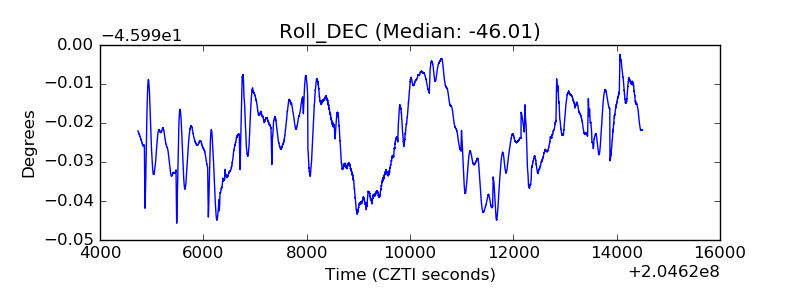 |
| _Roll_RA | 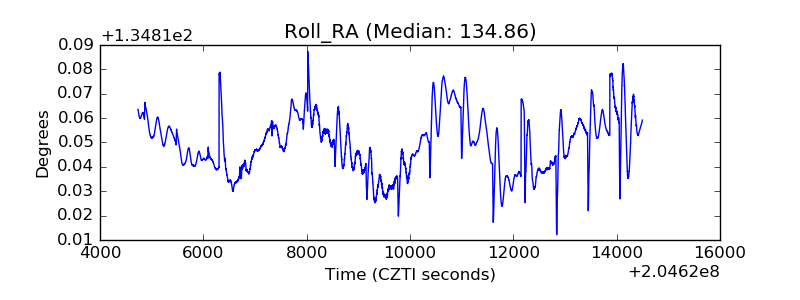 |
| Veto Counter | 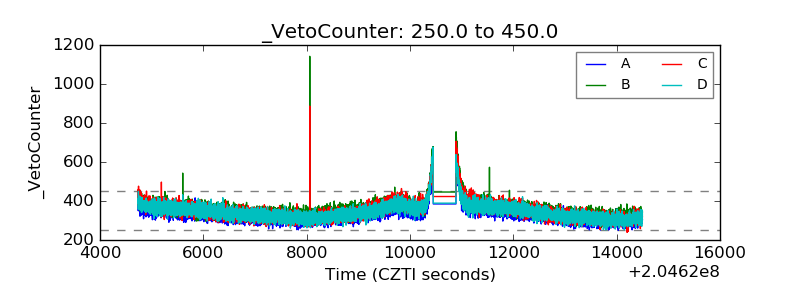 |