| Param | Original file | Final file |
|---|---|---|
| Filename | modeM0/AS1G05_246T03_9000000516cztM0_level2.fits | modeM0/AS1G05_246T03_9000000516cztM0_level2_quad_clean.evt |
| Size (bytes) | 503,421,120 | 488,586,240 |
| Size | 480.1 MB | 466.0 MB |
| Events in quadrant A | 2,932,542 | 2,782,967 |
| Events in quadrant B | 2,902,366 | 2,833,373 |
| Events in quadrant C | 3,003,384 | 2,773,451 |
| Events in quadrant D | 2,528,238 | 2,528,913 |
| Mode M9 | |||
|---|---|---|---|
| Quadrant | BADHDUFLAG | Total packets | Discarded packets |
| A | 0 | 94 | 0 |
| B | 0 | 94 | 0 |
| C | 0 | 94 | 0 |
| D | 0 | 94 | 0 |
| Mode M0 | |||
|---|---|---|---|
| Quadrant | BADHDUFLAG | Total packets | Discarded packets |
| A | 0 | 149821 | 0 |
| B | 0 | 126689 | 0 |
| C | 0 | 117178 | 0 |
| D | 0 | 134667 | 0 |
| Mode SS | |||
|---|---|---|---|
| Quadrant | BADHDUFLAG | Total packets | Discarded packets |
| A | 0 | 1146 | 0 |
| B | 0 | 1144 | 0 |
| C | 0 | 1146 | 0 |
| D | 0 | 1146 | 0 |
| Quadrant | Total seconds | Saturated seconds | Saturation percentage |
|---|---|---|---|
| A | 56538 | 2458 | 4.347518% |
| B | 56549 | 1338 | 2.366090% |
| C | 56548 | 646 | 1.142392% |
| D | 56538 | 1859 | 3.288054% |
Noise dominated data is calculated using 1-second bins in cleaned event files. If a bin has >2000 counts, and if more than 50% of those come from <1% of pixels, then it is considered to be noise-dominated and hence unusable.
| Quadrant | # 1 sec bins | Bins with >0 counts | Bins with >2000 counts | High rate bins dominated by noise | Noise dominated (total time) | Noise dominated (detector-on time) | Marked lightcurve |
|---|---|---|---|---|---|---|---|
| A | 65687 | 56501 | 0 | 0 | 0.00% | 0.00% |  |
| B | 65687 | 56559 | 0 | 0 | 0.00% | 0.00% |  |
| C | 65687 | 56560 | 0 | 0 | 0.00% | 0.00% |  |
| D | 65687 | 56513 | 0 | 0 | 0.00% | 0.00% |  |
Top three noisy pixels from each quadrant. If the there are fewer than three noisy pixels in the level2.evt file, extra rows are filled as -1
| Pixel properties | Quadrant properties | ||||||
|---|---|---|---|---|---|---|---|
| Quadrant | DetID | PixID | Counts | Sigma | Mean | Median | Sigma |
| A | 0 | 29 | 2899 | 10.95 | 762 | 711 | 199.7 |
| A | 7 | 110 | 2567 | 9.29 | 762 | 711 | 199.7 |
| A | 0 | 30 | 2301 | 7.96 | 762 | 711 | 199.7 |
| B | 2 | 9 | 2501 | 11.56 | 766 | 726 | 153.6 |
| B | 12 | 226 | 2141 | 9.21 | 766 | 726 | 153.6 |
| B | 14 | 254 | 2033 | 8.51 | 766 | 726 | 153.6 |
| C | 12 | 241 | 2173 | 6.73 | 792 | 731 | 214.3 |
| C | 1 | 81 | 2128 | 6.52 | 792 | 731 | 214.3 |
| C | 1 | 80 | 2125 | 6.5 | 792 | 731 | 214.3 |
| D | 3 | 14 | 1965 | 6.77 | 719 | 652 | 194.0 |
| D | 1 | 19 | 1902 | 6.44 | 719 | 652 | 194.0 |
| D | 6 | 231 | 1860 | 6.23 | 719 | 652 | 194.0 |
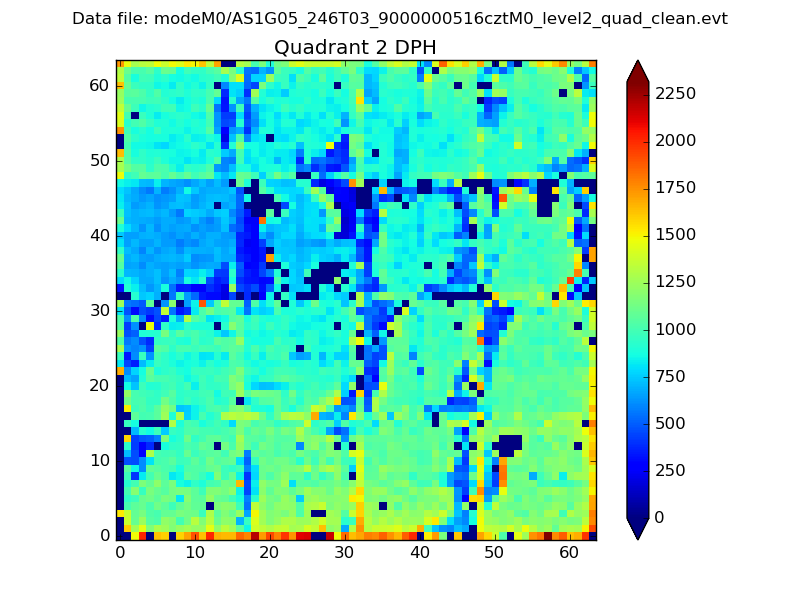
Histogram calculated using DETX and DETY for each event in the final _common_clean file
| Quadrant A |  |
 |
Quadrant B |
|---|---|---|---|
| Quadrant D |  |
 |
Quadrant C |
| Plot type | Count rate plots | Images |
|---|---|---|
| Comparison with Poisson distribution Blue bars denote a histogram of data divided into 1 sec bins. Red curve is a Poisson curve with rate = median count rate of data. |
 |
 |
| Quadrant-wise count rates Data is divided into 100 sec bins |
 |
|
| Module-wise count rates for Quadrant A Data is divided into 100 sec bins |
 |
 |
| Module-wise count rates for Quadrant B Data is divided into 100 sec bins |
 |
 |
| Module-wise count rates for Quadrant C Data is divided into 100 sec bins |
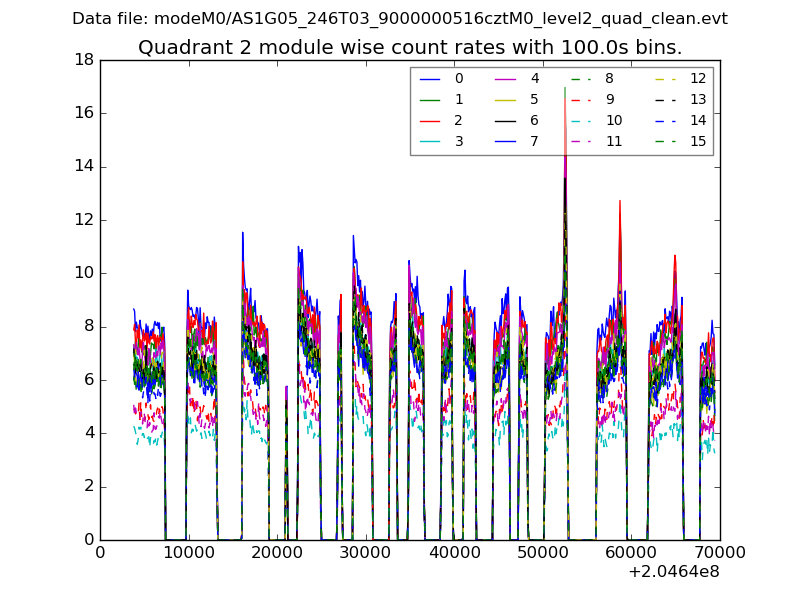 |
 |
| Module-wise count rates for Quadrant D Data is divided into 100 sec bins |
 |
 |
| Parameter | Plot |
|---|---|
| CZT HV Monitor |  |
| D_VDD |  |
| Temperature 1 | 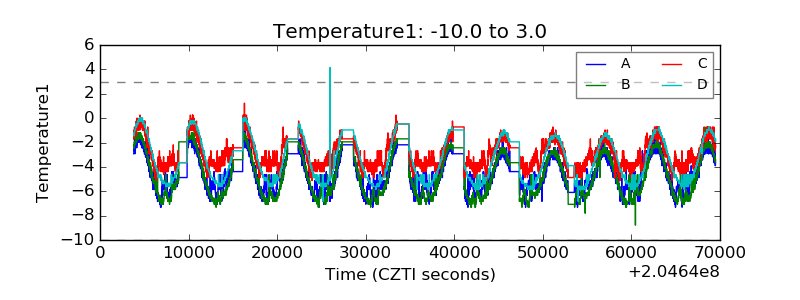 |
| Veto HV Monitor |  |
| Veto LLD |  |
| Alpha Counter |  |
| _CPM_Rate |  |
| CZT Counter |  |
| +2.5 Volts monitor |  |
| +5 Volts monitor |  |
| _ROLL_ROT |  |
| _Roll_DEC |  |
| _Roll_RA |  |
| Veto Counter |  |