| Param | Original file | Final file |
|---|---|---|
| Filename | modeM0/AS1G05_246T03_9000000516_04033cztM0_level2.evt | modeM0/AS1G05_246T03_9000000516_04033cztM0_level2_quad_clean.evt |
| Size (bytes) | 487,509,120 | 81,869,760 |
| Size | 464.9 MB | 78.1 MB |
| Events in quadrant A | 3,754,397 | 507,345 |
| Events in quadrant B | 3,486,437 | 510,346 |
| Events in quadrant C | 2,933,134 | 514,088 |
| Events in quadrant D | 4,146,348 | 491,333 |
| Mode M9 | |||
|---|---|---|---|
| Quadrant | BADHDUFLAG | Total packets | Discarded packets |
| A | 0 | 10 | 0 |
| B | 0 | 10 | 0 |
| C | 0 | 10 | 0 |
| D | 0 | 10 | 0 |
| Mode M0 | |||
|---|---|---|---|
| Quadrant | BADHDUFLAG | Total packets | Discarded packets |
| A | 0 | 15798 | 2 |
| B | 0 | 14834 | 1 |
| C | 0 | 13462 | 1 |
| D | 0 | 16942 | 1 |
| Mode SS | |||
|---|---|---|---|
| Quadrant | BADHDUFLAG | Total packets | Discarded packets |
| A | 0 | 130 | 0 |
| B | 0 | 130 | 0 |
| C | 0 | 130 | 0 |
| D | 0 | 130 | 0 |
| Quadrant | Total seconds | Saturated seconds | Saturation percentage |
|---|---|---|---|
| A | 6547 | 219 | 3.345044% |
| B | 6547 | 84 | 1.283030% |
| C | 6547 | 50 | 0.763709% |
| D | 6547 | 182 | 2.779899% |
Noise dominated data is calculated using 1-second bins in cleaned event files. If a bin has >2000 counts, and if more than 50% of those come from <1% of pixels, then it is considered to be noise-dominated and hence unusable.
| Quadrant | # 1 sec bins | Bins with >0 counts | Bins with >2000 counts | High rate bins dominated by noise | Noise dominated (total time) | Noise dominated (detector-on time) | Marked lightcurve |
|---|---|---|---|---|---|---|---|
| A | 7492 | 6547 | 114 | 114 | 1.52% | 1.74% | 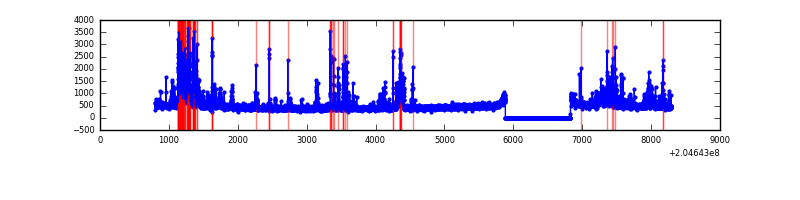 |
| B | 7492 | 6548 | 25 | 25 | 0.33% | 0.38% | 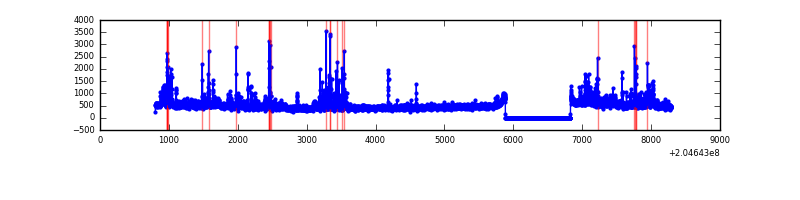 |
| C | 7492 | 6547 | 1 | 1 | 0.01% | 0.02% | 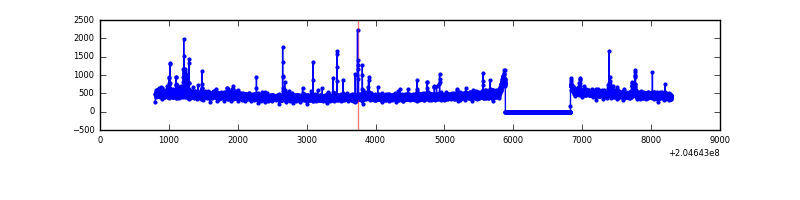 |
| D | 7492 | 6547 | 103 | 103 | 1.37% | 1.57% | 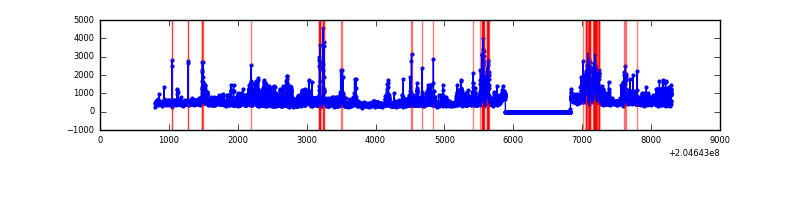 |
Top three noisy pixels from each quadrant. If the there are fewer than three noisy pixels in the level2.evt file, extra rows are filled as -1
| Pixel properties | Quadrant properties | ||||||
|---|---|---|---|---|---|---|---|
| Quadrant | DetID | PixID | Counts | Sigma | Mean | Median | Sigma |
| A | 0 | 50 | 406968 | 2699.13 | 734 | 716 | 150.5 |
| A | 0 | 118 | 268055 | 1776.2 | 734 | 716 | 150.5 |
| A | 8 | 15 | 183418 | 1213.87 | 734 | 716 | 150.5 |
| B | 10 | 16 | 175881 | 1212.18 | 745 | 727 | 144.5 |
| B | 15 | 204 | 147820 | 1017.98 | 745 | 727 | 144.5 |
| B | 4 | 81 | 86438 | 593.18 | 745 | 727 | 144.5 |
| C | 9 | 144 | 89049 | 521.11 | 726 | 727 | 169.5 |
| C | 12 | 4 | 6887 | 36.34 | 726 | 727 | 169.5 |
| C | 13 | 61 | 6294 | 32.85 | 726 | 727 | 169.5 |
| D | 11 | 132 | 613863 | 3530.36 | 719 | 697 | 173.7 |
| D | 2 | 232 | 368869 | 2119.78 | 719 | 697 | 173.7 |
| D | 8 | 112 | 279110 | 1602.99 | 719 | 697 | 173.7 |
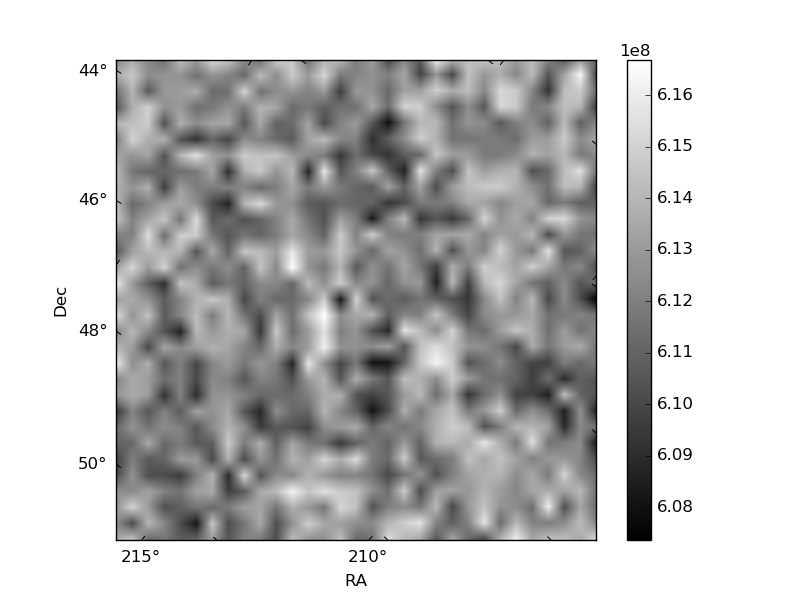
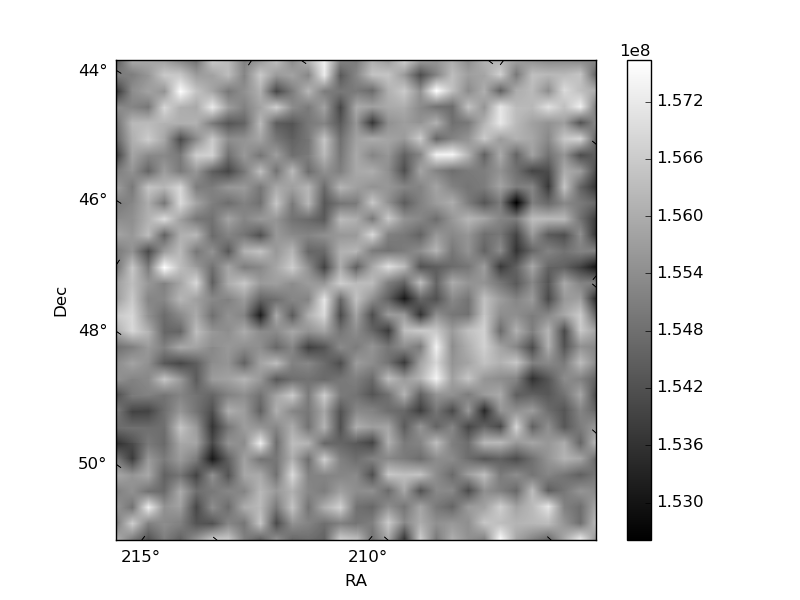
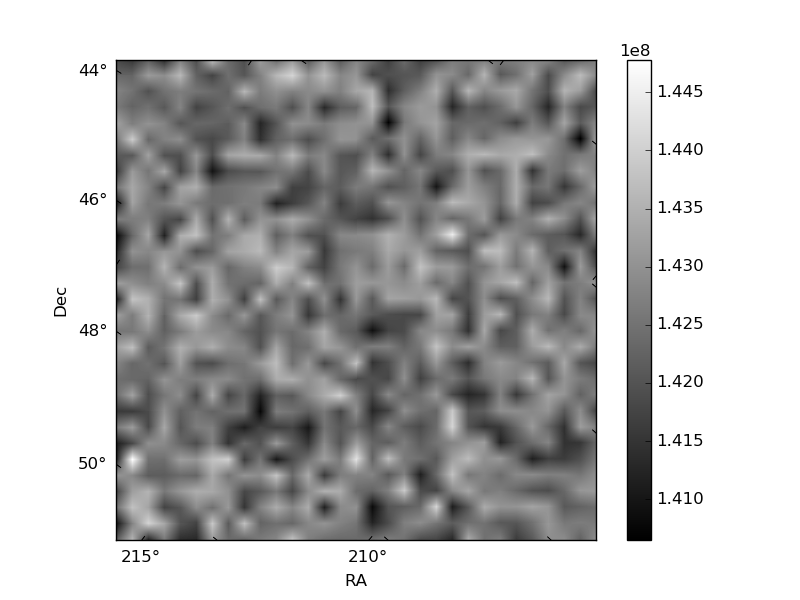
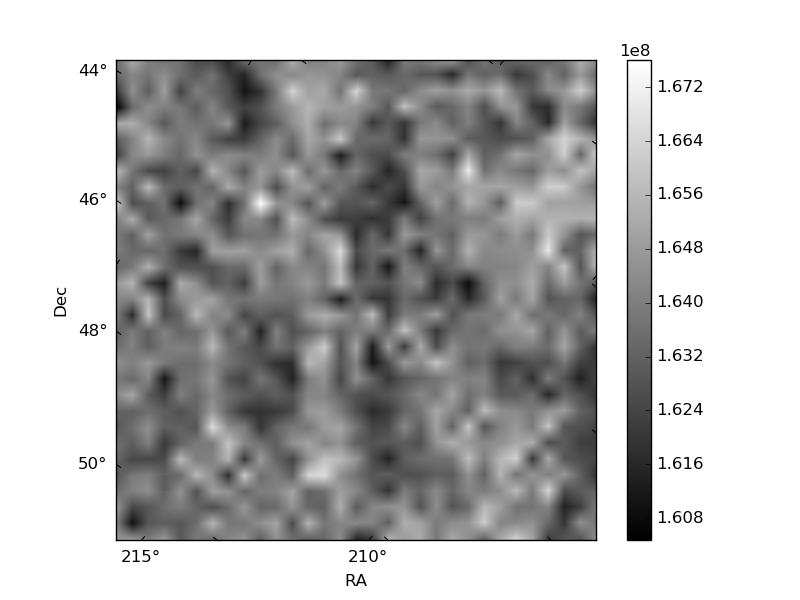
Histogram calculated using DETX and DETY for each event in the final _common_clean file
| Quadrant A | 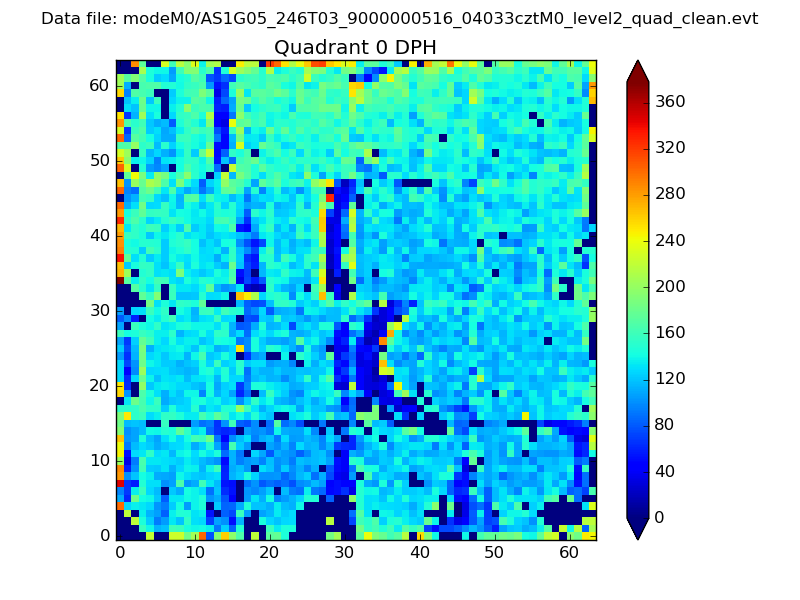 |
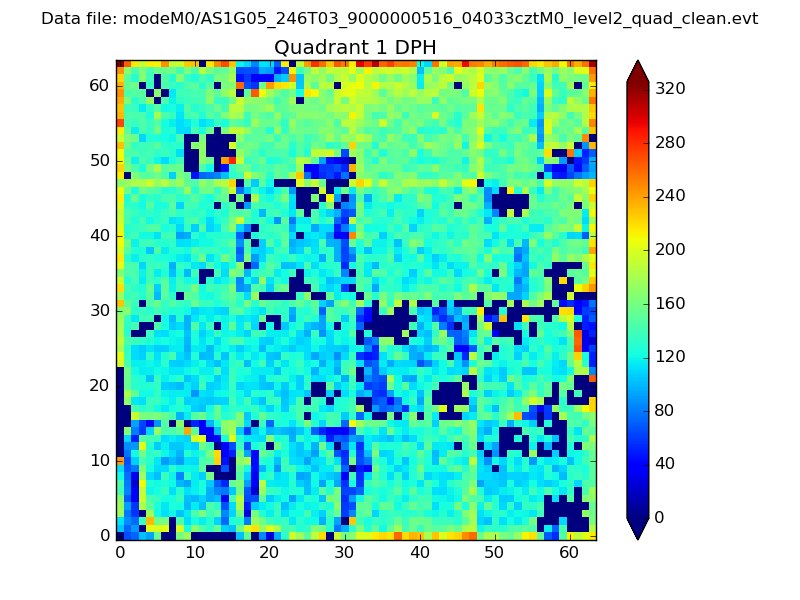 |
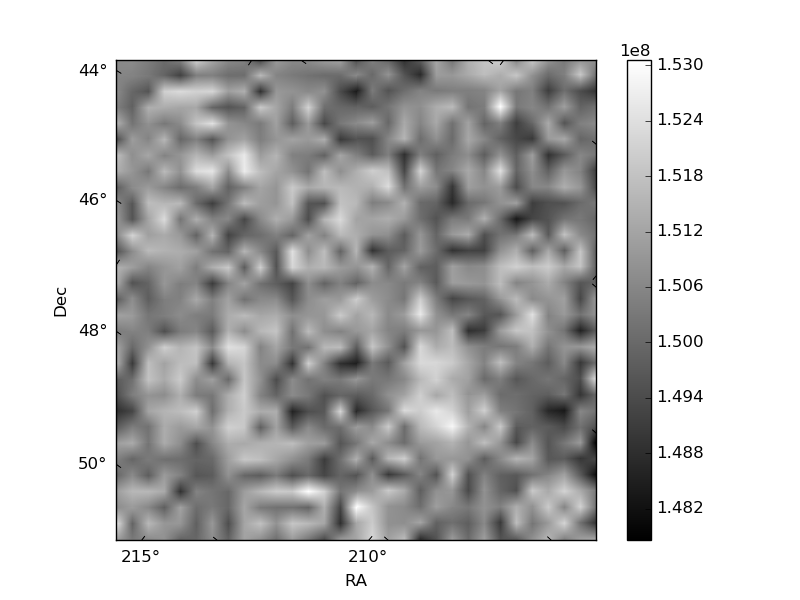
Quadrant B |
|---|---|---|---|
| Quadrant D | 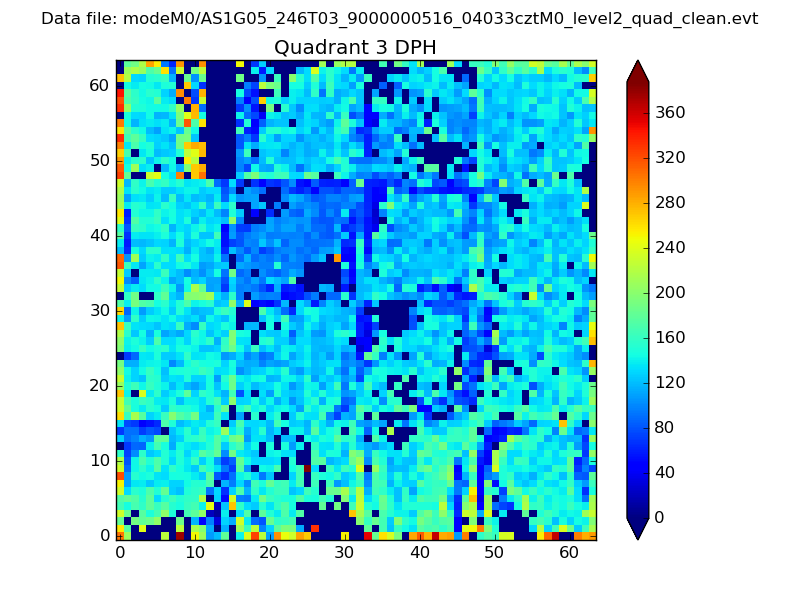 |
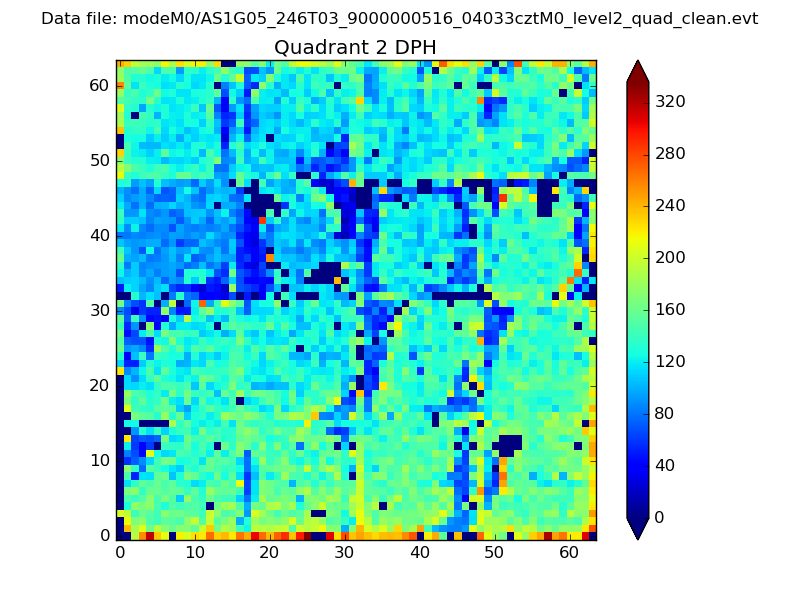 |
Quadrant C |
| Plot type | Count rate plots | Images |
|---|---|---|
| Comparison with Poisson distribution Blue bars denote a histogram of data divided into 1 sec bins. Red curve is a Poisson curve with rate = median count rate of data. |
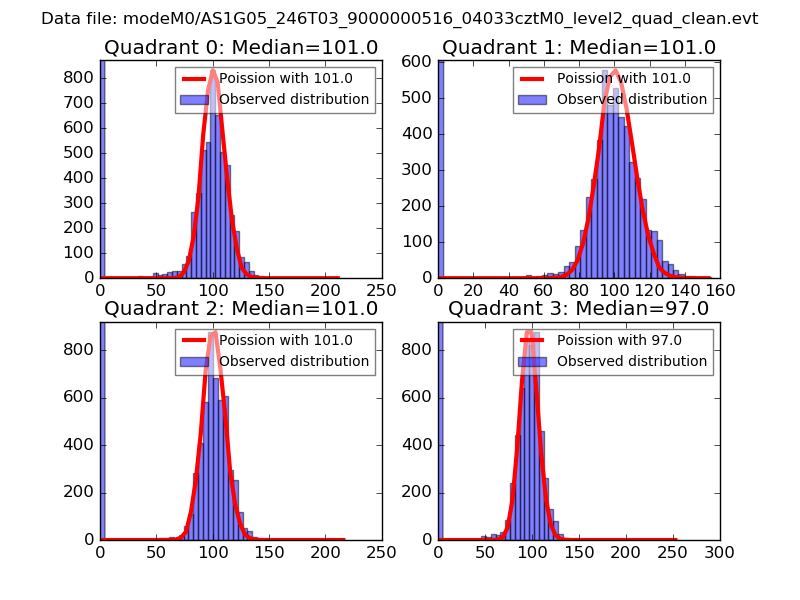 |
 |
| Quadrant-wise count rates Data is divided into 100 sec bins |
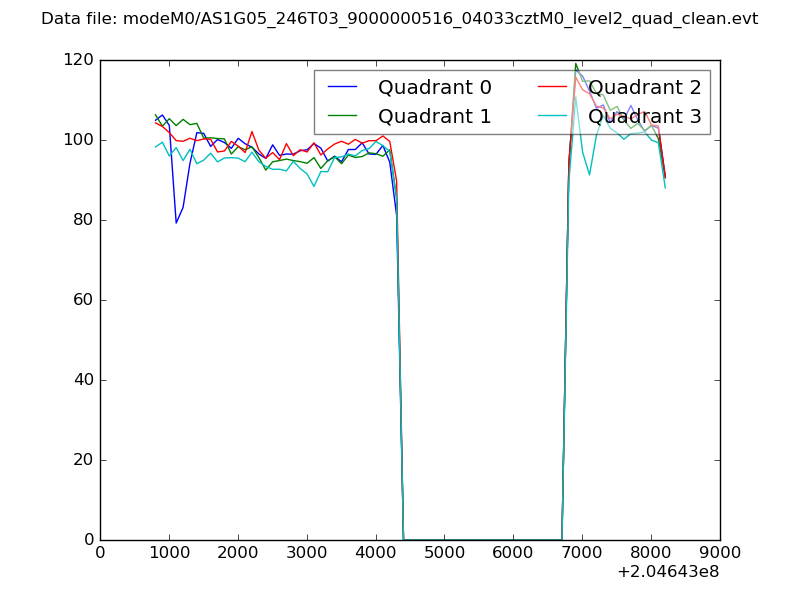 |
|
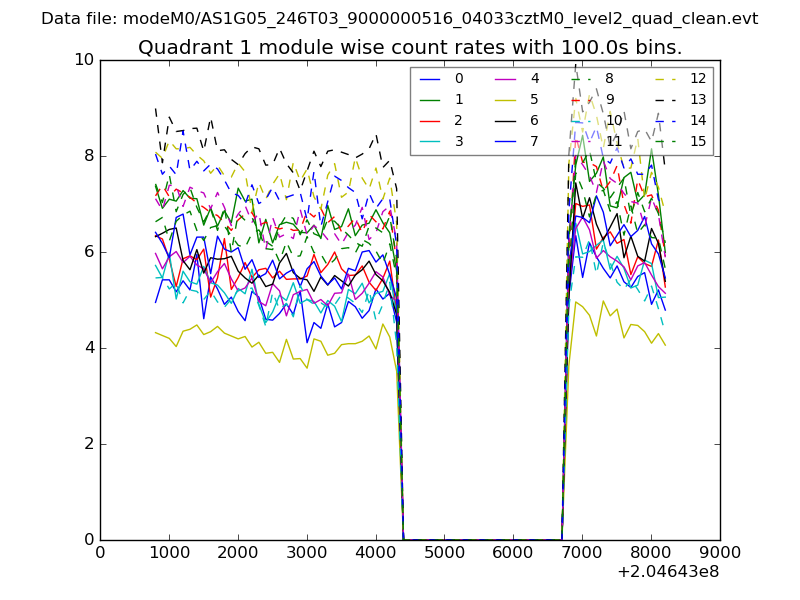
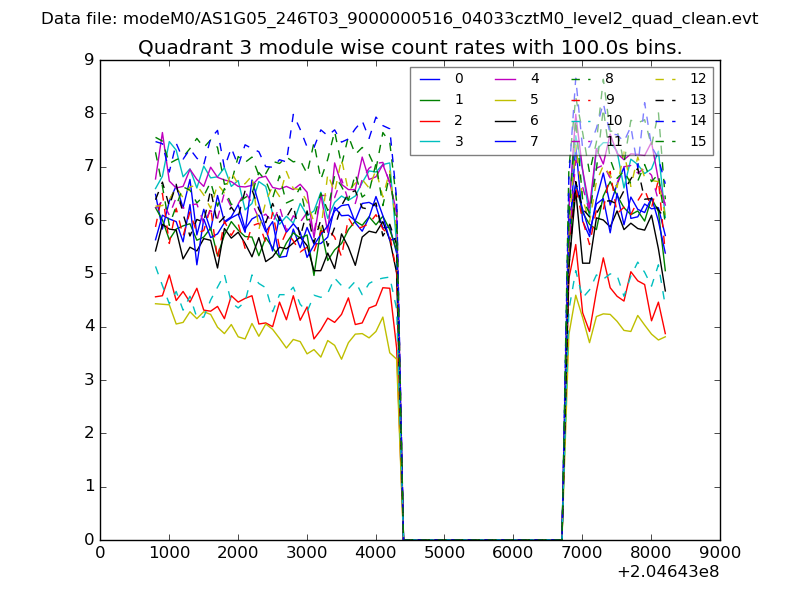
| Module-wise count rates for Quadrant A Data is divided into 100 sec bins |
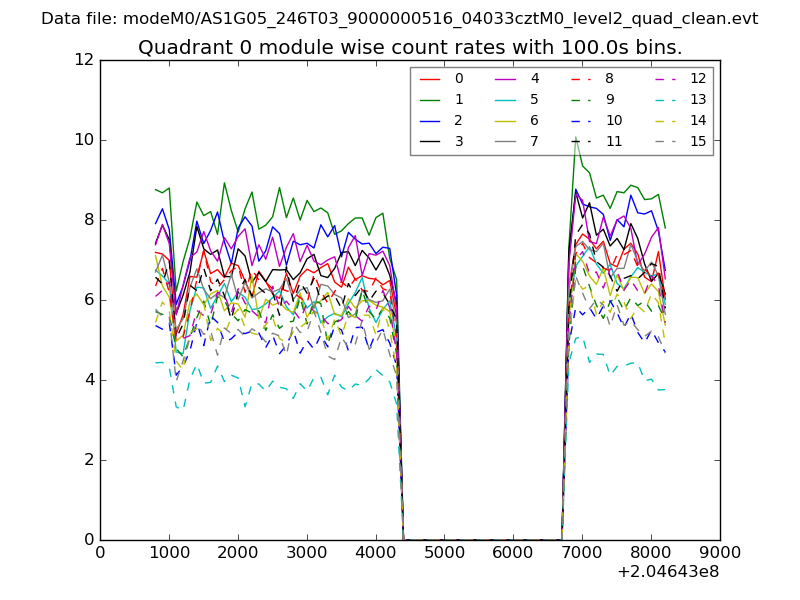 |
 |
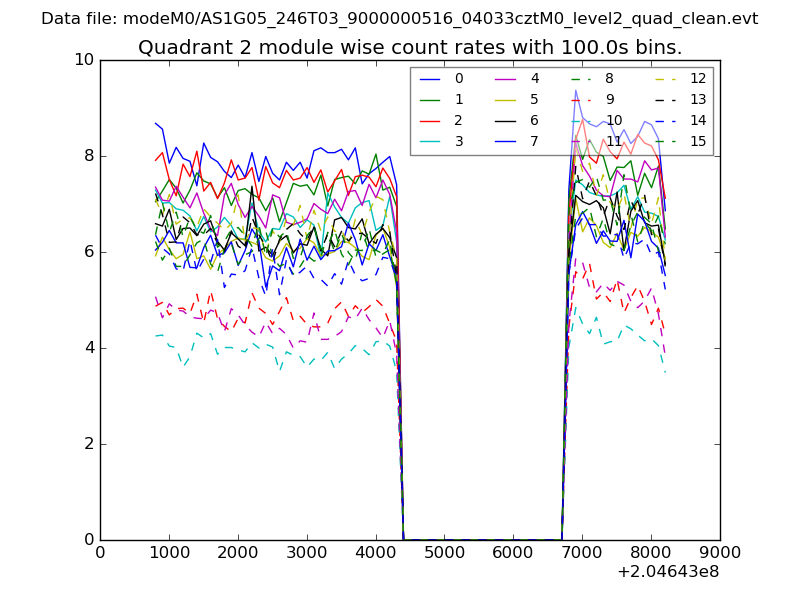
| Module-wise count rates for Quadrant B Data is divided into 100 sec bins |
 |
 |
| Module-wise count rates for Quadrant C Data is divided into 100 sec bins |
 |
 |
| Module-wise count rates for Quadrant D Data is divided into 100 sec bins |
 |
 |
| Parameter | Plot |
|---|---|
| CZT HV Monitor | 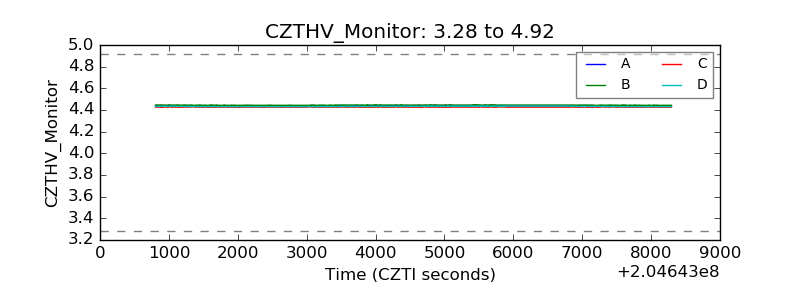 |
| D_VDD | 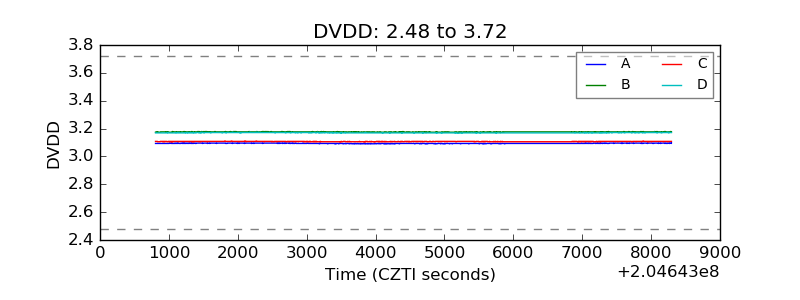 |
| Temperature 1 | 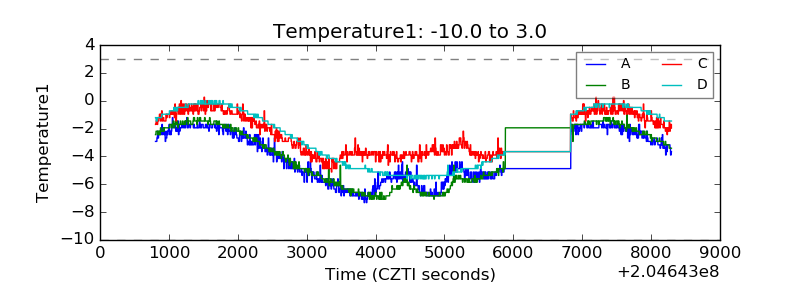 |
| Veto HV Monitor | 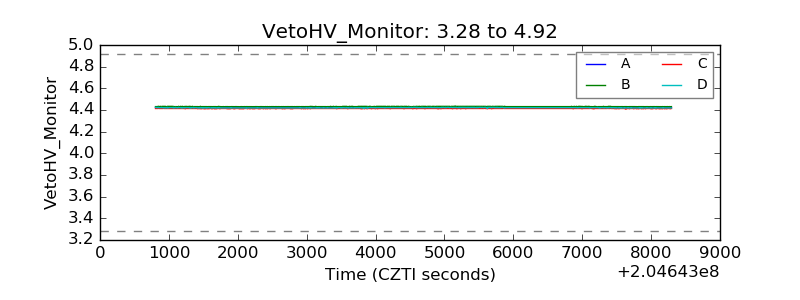 |
| Veto LLD | 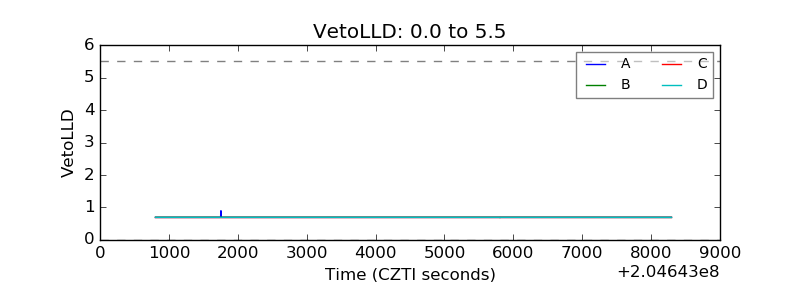 |
| Alpha Counter | 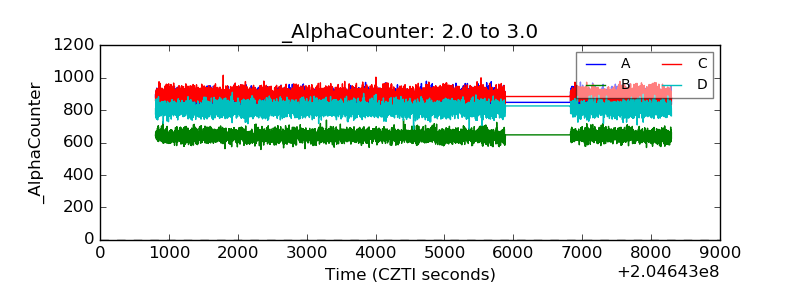 |
| _CPM_Rate | 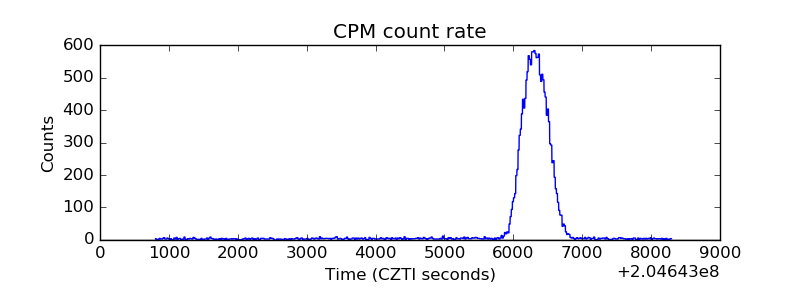 |
| CZT Counter | 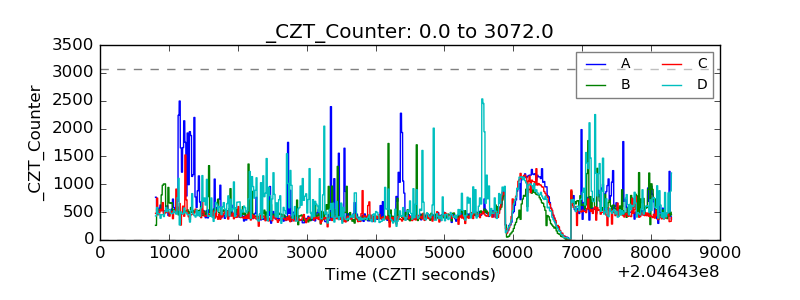 |
| +2.5 Volts monitor |  |
| +5 Volts monitor |  |
| _ROLL_ROT | 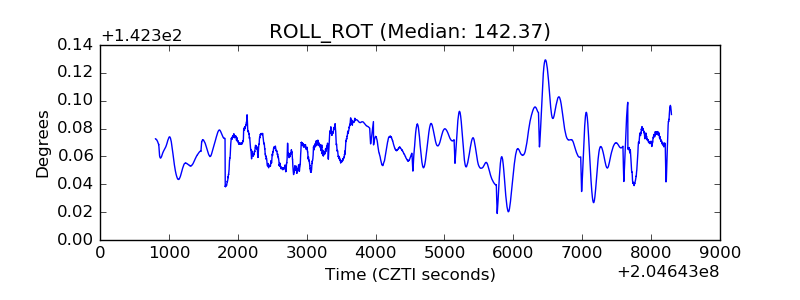 |
| _Roll_DEC | 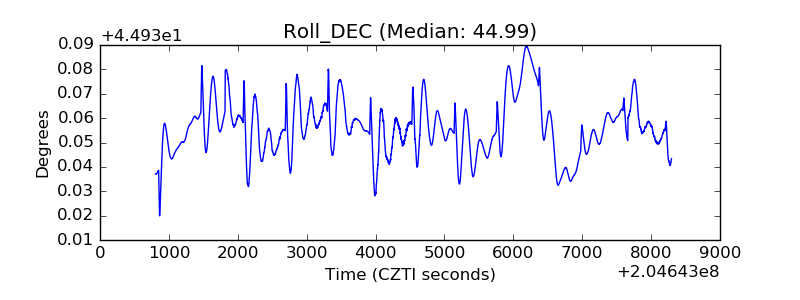 |
| _Roll_RA | 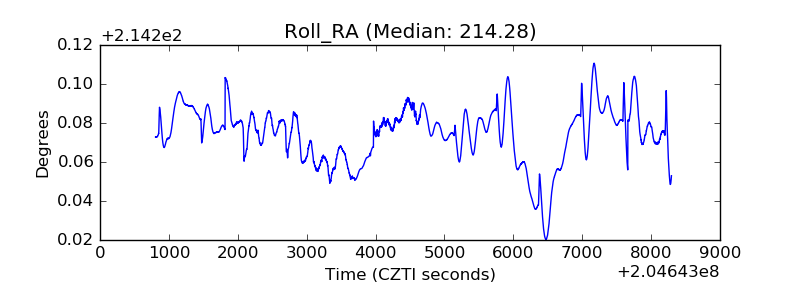 |
| Veto Counter | 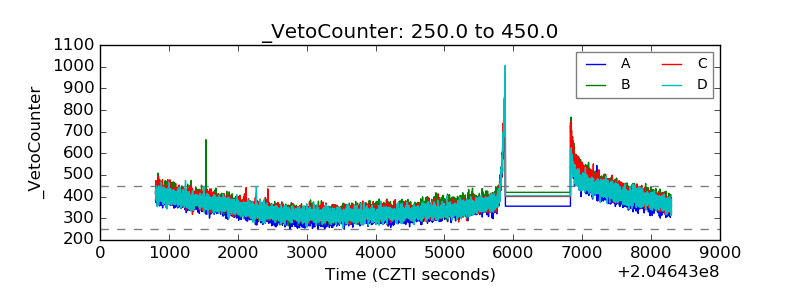 |