| Param | Original file | Final file |
|---|---|---|
| Filename | modeM0/AS1G05_246T03_9000000516_04037cztM0_level2.evt | modeM0/AS1G05_246T03_9000000516_04037cztM0_level2_quad_clean.evt |
| Size (bytes) | 462,545,280 | 76,348,800 |
| Size | 441.1 MB | 72.8 MB |
| Events in quadrant A | 3,488,461 | 461,900 |
| Events in quadrant B | 3,394,965 | 486,449 |
| Events in quadrant C | 2,856,681 | 495,534 |
| Events in quadrant D | 3,848,875 | 437,089 |
| Mode M9 | |||
|---|---|---|---|
| Quadrant | BADHDUFLAG | Total packets | Discarded packets |
| A | 0 | 13 | 0 |
| B | 0 | 13 | 0 |
| C | 0 | 13 | 0 |
| D | 0 | 13 | 0 |
| Mode M0 | |||
|---|---|---|---|
| Quadrant | BADHDUFLAG | Total packets | Discarded packets |
| A | 0 | 14689 | 2 |
| B | 0 | 14298 | 1 |
| C | 0 | 12813 | 1 |
| D | 0 | 15964 | 1 |
| Mode SS | |||
|---|---|---|---|
| Quadrant | BADHDUFLAG | Total packets | Discarded packets |
| A | 0 | 124 | 0 |
| B | 0 | 124 | 0 |
| C | 0 | 124 | 0 |
| D | 0 | 124 | 0 |
| Quadrant | Total seconds | Saturated seconds | Saturation percentage |
|---|---|---|---|
| A | 6175 | 269 | 4.356275% |
| B | 6175 | 81 | 1.311741% |
| C | 6175 | 28 | 0.453441% |
| D | 6175 | 331 | 5.360324% |
Noise dominated data is calculated using 1-second bins in cleaned event files. If a bin has >2000 counts, and if more than 50% of those come from <1% of pixels, then it is considered to be noise-dominated and hence unusable.
| Quadrant | # 1 sec bins | Bins with >0 counts | Bins with >2000 counts | High rate bins dominated by noise | Noise dominated (total time) | Noise dominated (detector-on time) | Marked lightcurve |
|---|---|---|---|---|---|---|---|
| A | 7450 | 6176 | 228 | 228 | 3.06% | 3.69% | 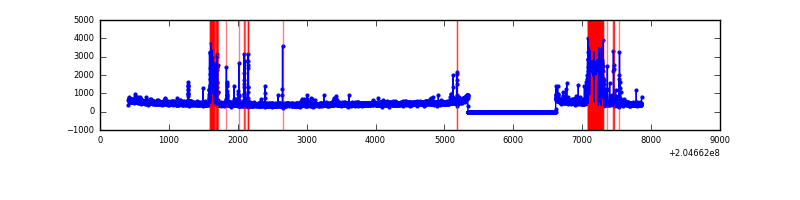 |
| B | 7450 | 6176 | 50 | 50 | 0.67% | 0.81% | 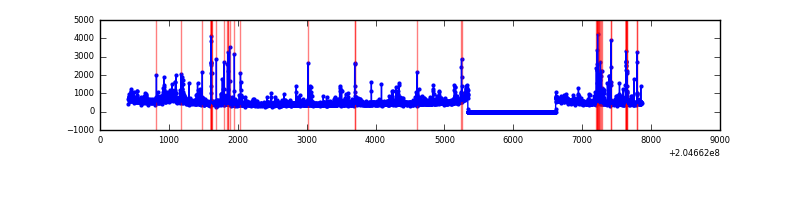 |
| C | 7450 | 6176 | 10 | 10 | 0.13% | 0.16% | 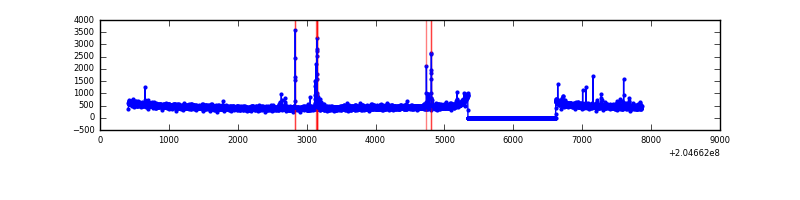 |
| D | 7450 | 6176 | 304 | 304 | 4.08% | 4.92% | 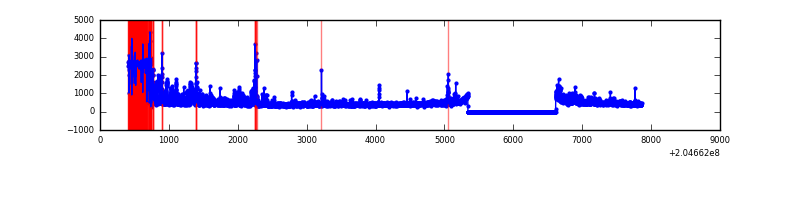 |
Top three noisy pixels from each quadrant. If the there are fewer than three noisy pixels in the level2.evt file, extra rows are filled as -1
| Pixel properties | Quadrant properties | ||||||
|---|---|---|---|---|---|---|---|
| Quadrant | DetID | PixID | Counts | Sigma | Mean | Median | Sigma |
| A | 0 | 50 | 703533 | 4985.23 | 695 | 681 | 141.0 |
| A | 8 | 15 | 36851 | 256.55 | 695 | 681 | 141.0 |
| A | 0 | 118 | 32293 | 224.22 | 695 | 681 | 141.0 |
| B | 10 | 16 | 295241 | 2146.59 | 723 | 707 | 137.2 |
| B | 15 | 204 | 117861 | 853.83 | 723 | 707 | 137.2 |
| B | 14 | 167 | 80801 | 583.73 | 723 | 707 | 137.2 |
| C | 9 | 144 | 61200 | 367.19 | 710 | 715 | 164.7 |
| C | 12 | 4 | 10546 | 59.68 | 710 | 715 | 164.7 |
| C | 1 | 16 | 9537 | 53.56 | 710 | 715 | 164.7 |
| D | 13 | 53 | 713976 | 4464.16 | 666 | 648 | 159.8 |
| D | 11 | 132 | 436267 | 2726.2 | 666 | 648 | 159.8 |
| D | 2 | 232 | 97589 | 606.68 | 666 | 648 | 159.8 |
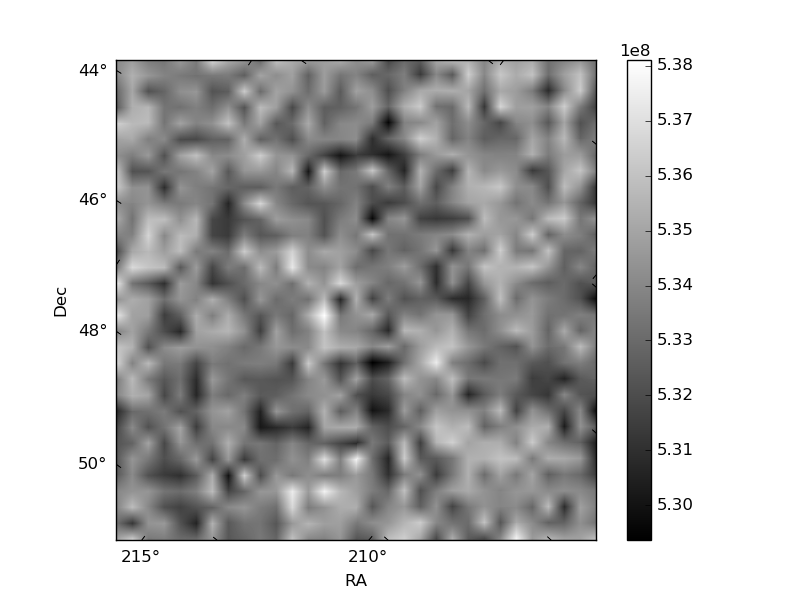
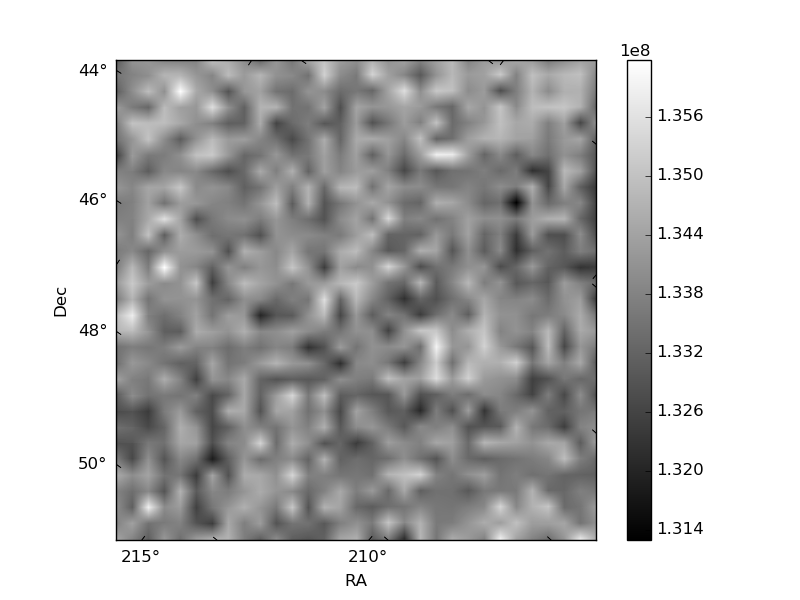
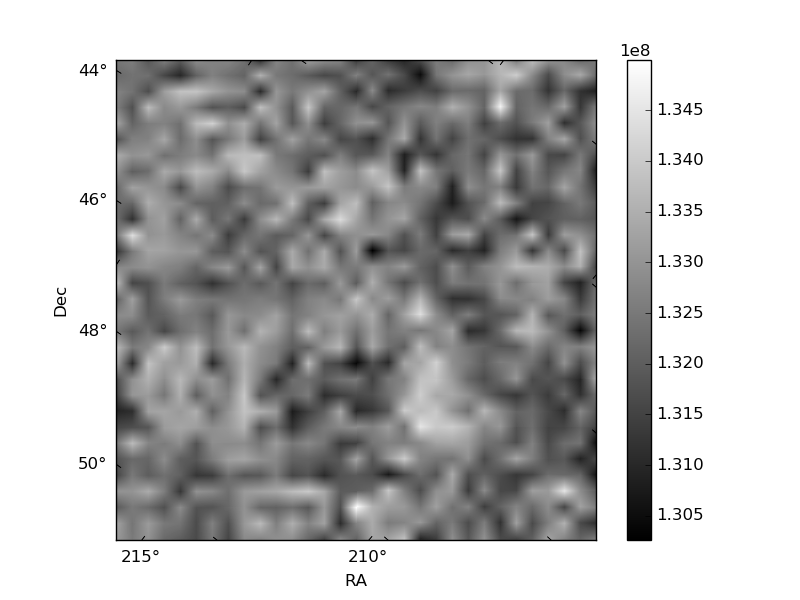
Histogram calculated using DETX and DETY for each event in the final _common_clean file
| Quadrant A | 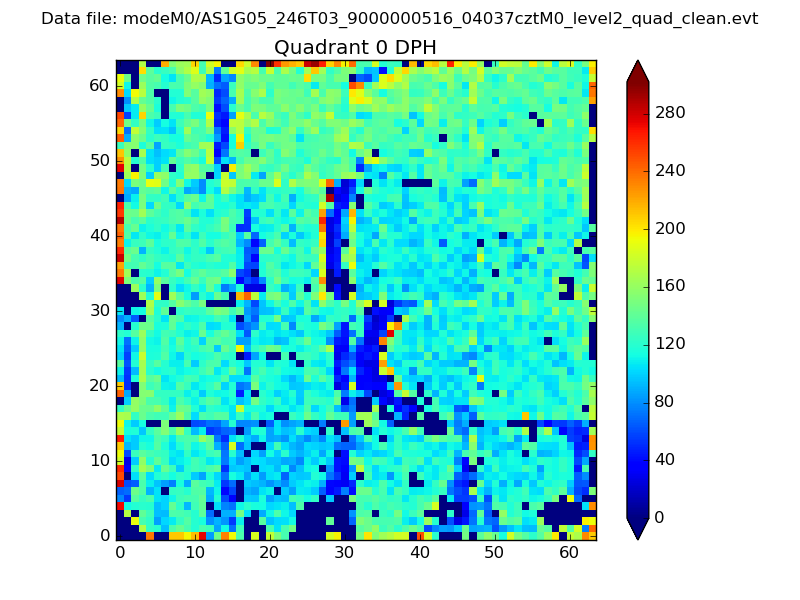 |
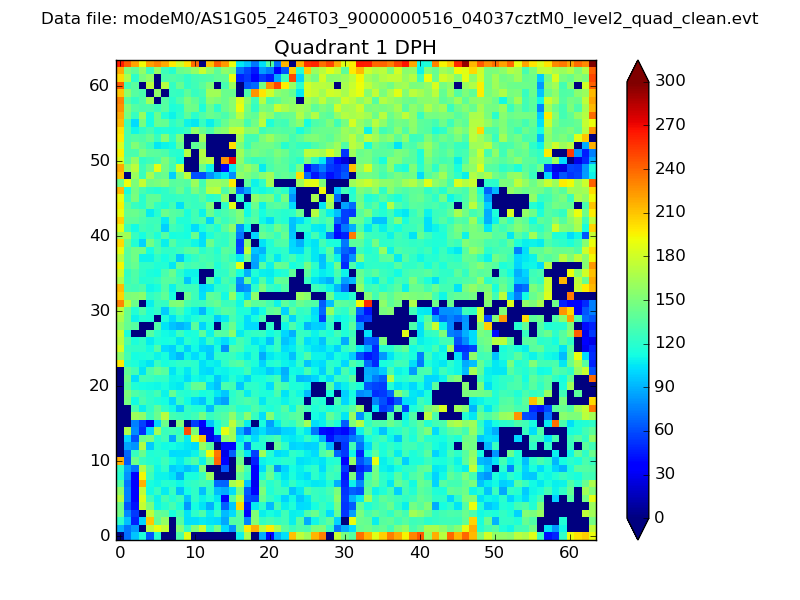 |
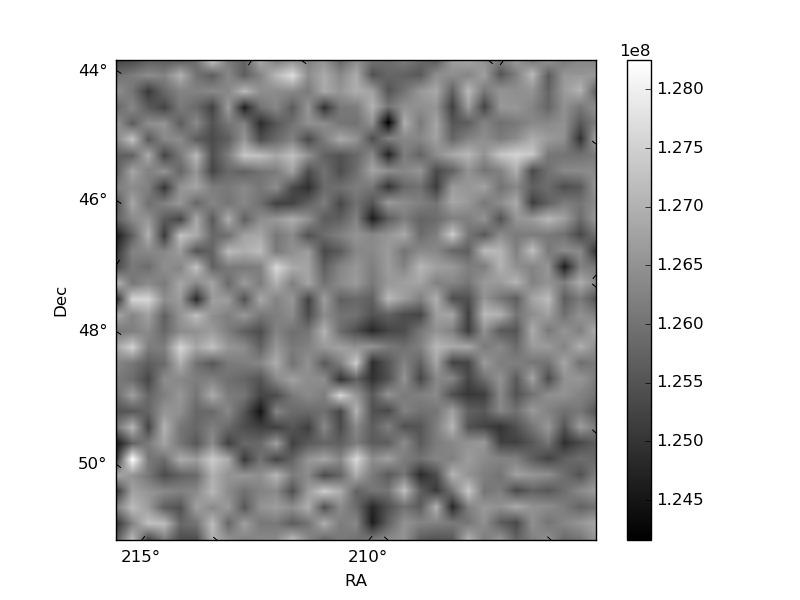
Quadrant B |
|---|---|---|---|
| Quadrant D | 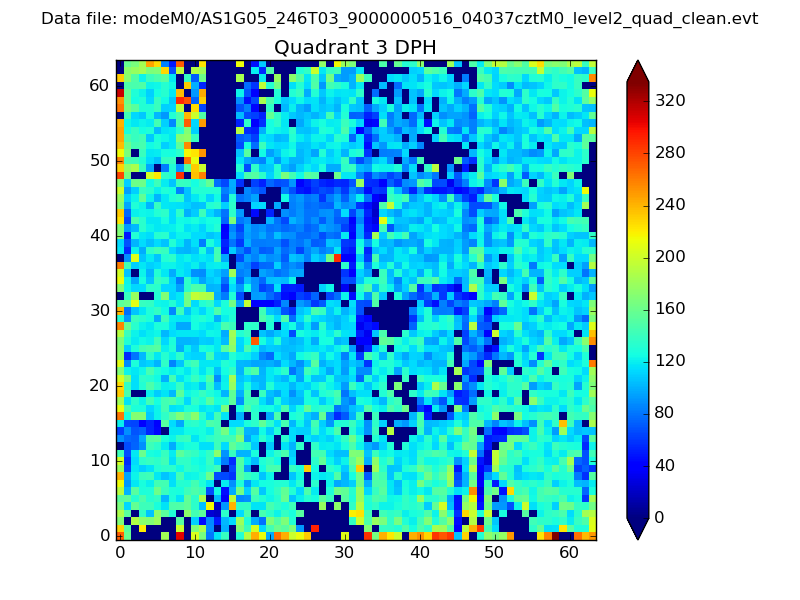 |
 |
Quadrant C |
| Plot type | Count rate plots | Images |
|---|---|---|
| Comparison with Poisson distribution Blue bars denote a histogram of data divided into 1 sec bins. Red curve is a Poisson curve with rate = median count rate of data. |
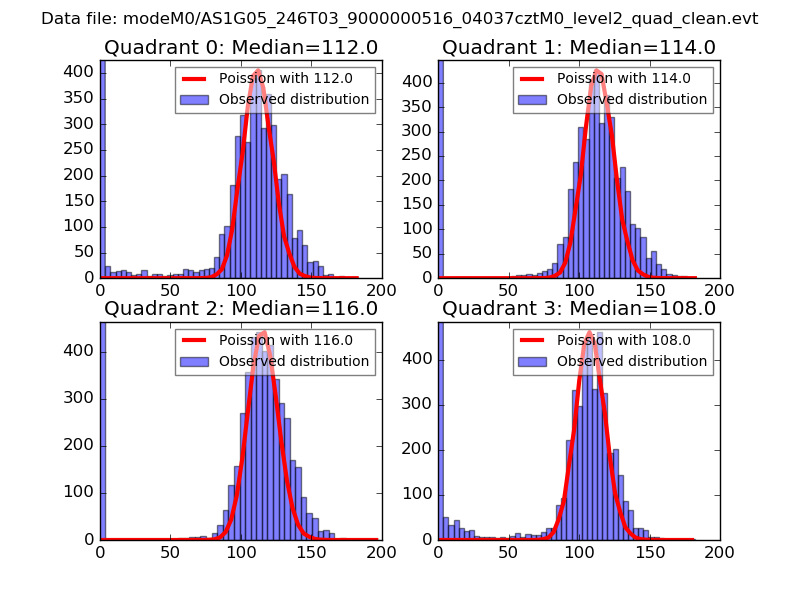 |
 |
| Quadrant-wise count rates Data is divided into 100 sec bins |
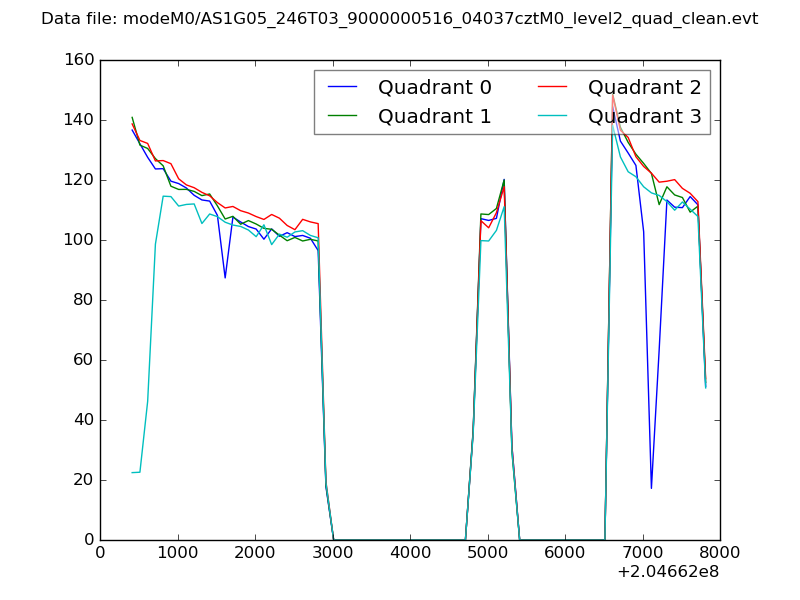 |
|
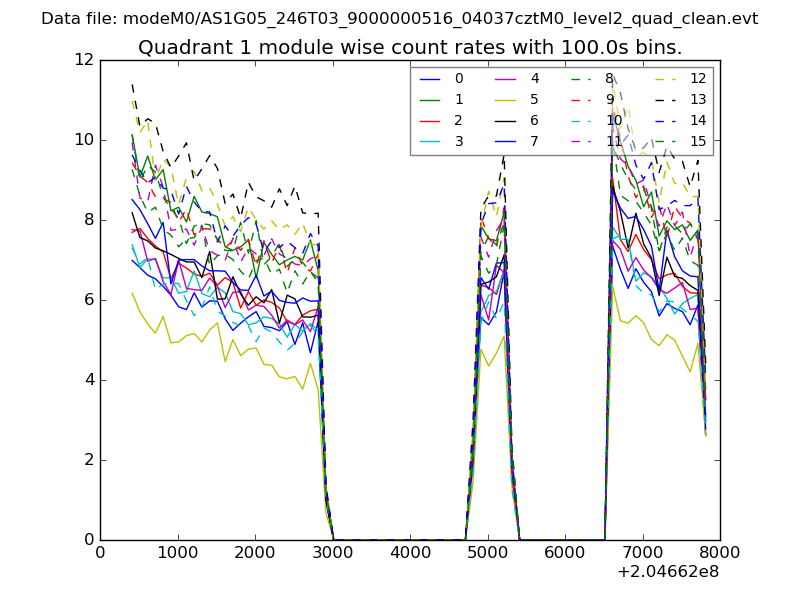
| Module-wise count rates for Quadrant A Data is divided into 100 sec bins |
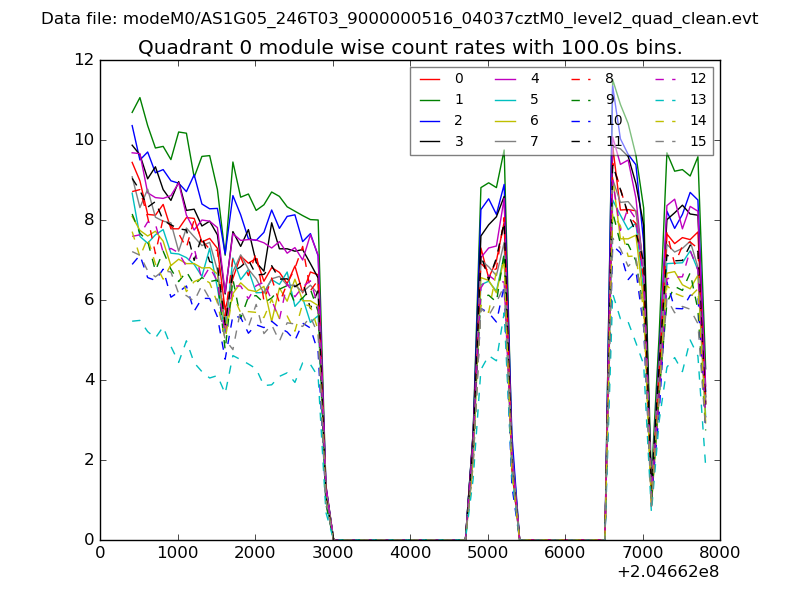 |
 |
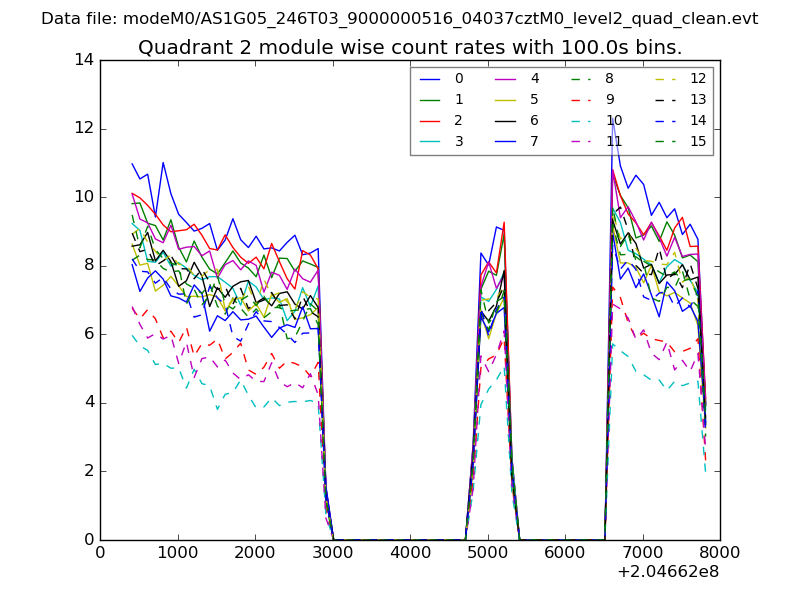
| Module-wise count rates for Quadrant B Data is divided into 100 sec bins |
 |
 |
| Module-wise count rates for Quadrant C Data is divided into 100 sec bins |
 |
 |
| Module-wise count rates for Quadrant D Data is divided into 100 sec bins |
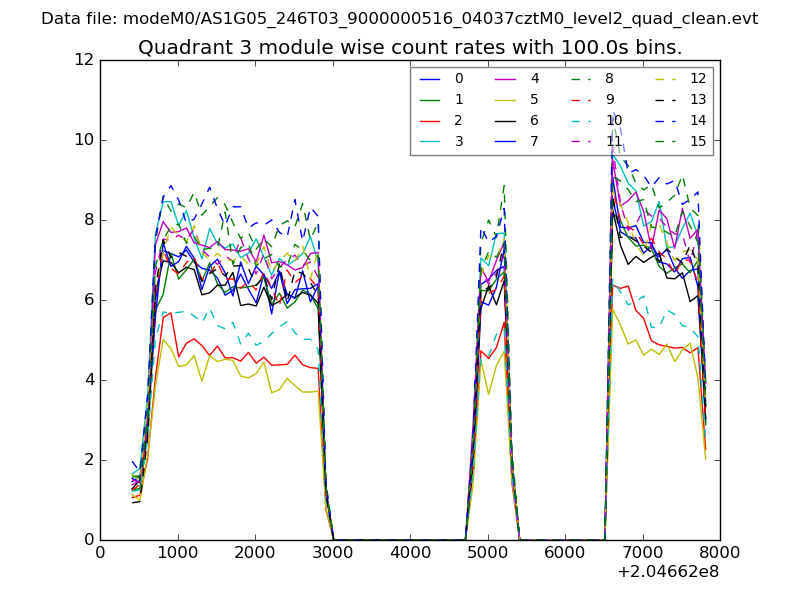 |
 |
| Parameter | Plot |
|---|---|
| CZT HV Monitor | 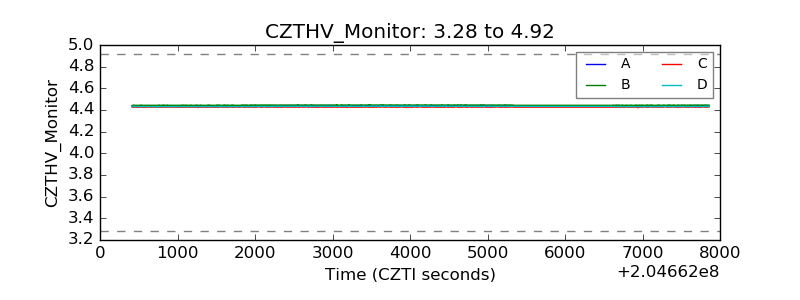 |
| D_VDD | 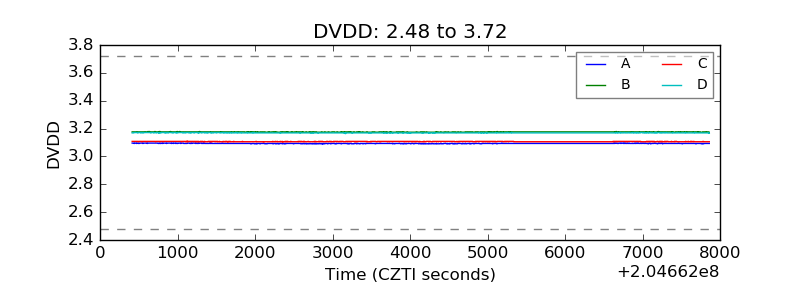 |
| Temperature 1 | 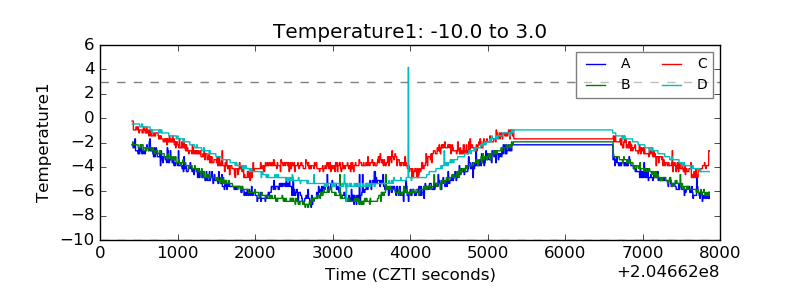 |
| Veto HV Monitor | 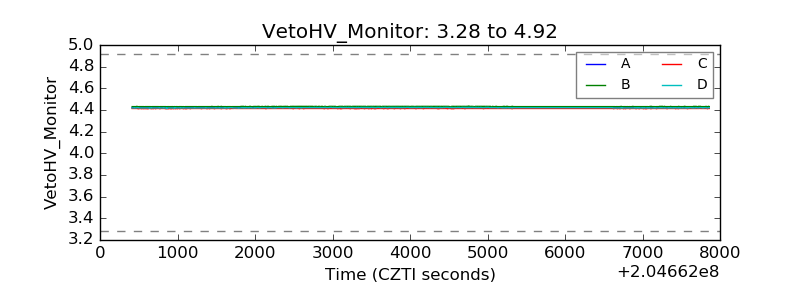 |
| Veto LLD |  |
| Alpha Counter | 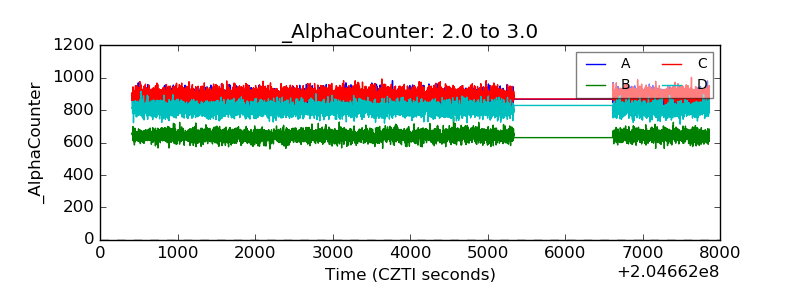 |
| _CPM_Rate | 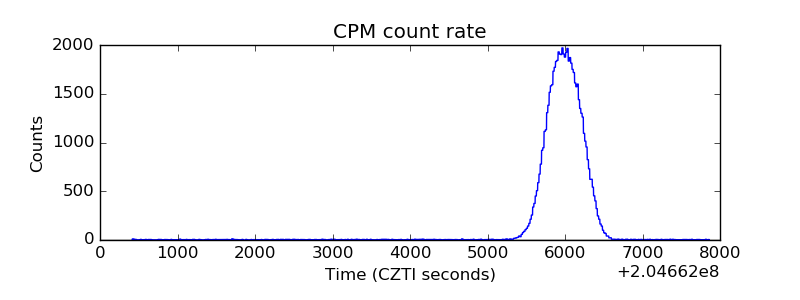 |
| CZT Counter | 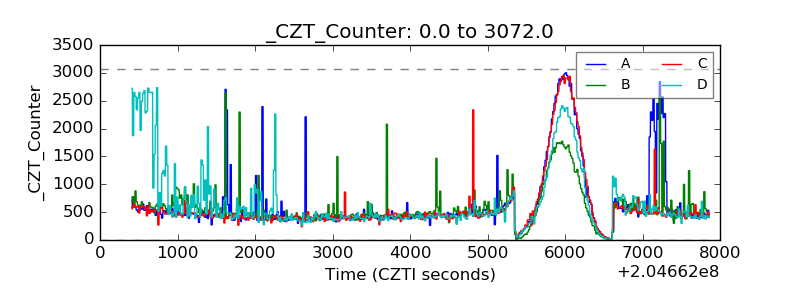 |
| +2.5 Volts monitor |  |
| +5 Volts monitor |  |
| _ROLL_ROT | 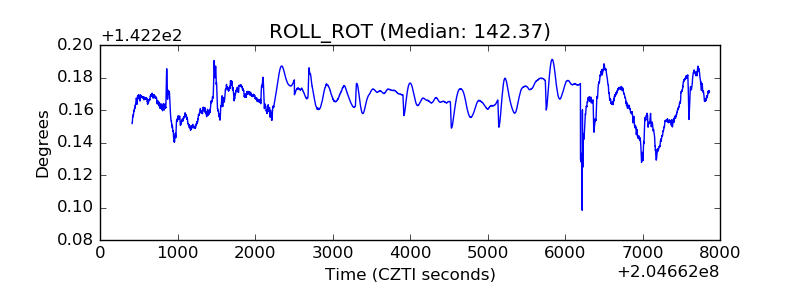 |
| _Roll_DEC | 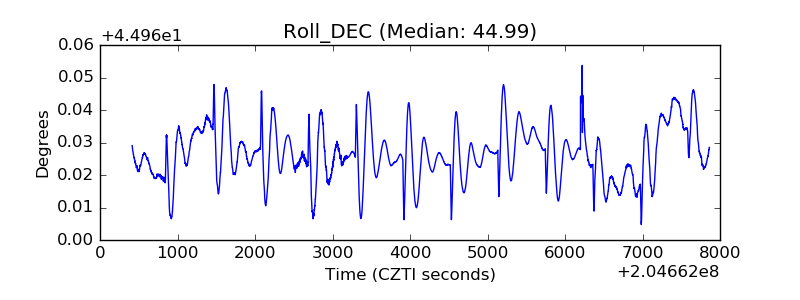 |
| _Roll_RA | 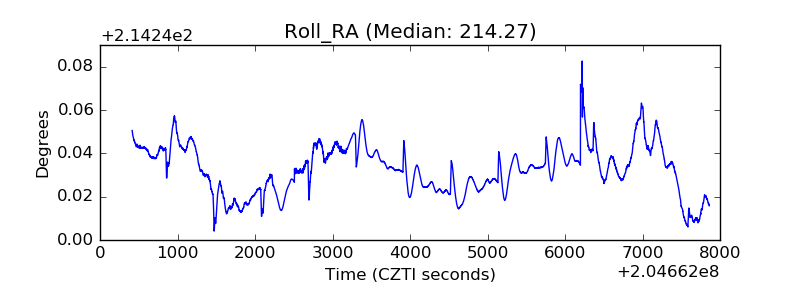 |
| Veto Counter | 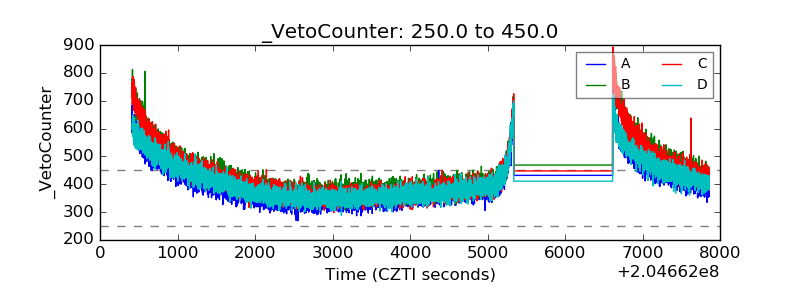 |